Analyzing Ethereum, Bitcoin and more than 1200 other cryptocurrencies using PostgreSQL
Cryptocurrencies are the driving force of the new gold rush. The author suggests using data analysis to better understand this emerging market.
Recently there is a feeling that money grows on trees.
The volume of stock trading reaches millions of dollars, and market capitalization - billions . It is time to talk about the gold rush, fueled by the emergence of an increasing number of new cryptocurrencies.
We live in an era of digital currencies. Appearing less than 10 years ago, the concept of cryptocurrency has already become widespread today. Despite such a short time, there are already over a thousand different cryptocurrencies on the market, and ICOs occur almost every day .
As we get used to the new, rapidly gaining market, it is important to try to understand what is happening to it. There are many risks, both at the micro level (for example, personal investment) and at the macro level (for example, preventing market crashes or large capital losses). This is where we come into play.
We are dealing with data, or more precisely, I represent the development team of TimescaleDB , a new open source PostgreSQL database for working with time series. We thought that it would be useful and exciting to analyze the cryptocurrency market using PostgreSQL and TimescaleDB (and R to visualize the received data).
In the course of the work, we analyzed historical data on OHLC-charts for more than 1200 cryptocurrencies, kindly provided to us by CryptoCompare (the last sample date is June 26 of this year). The step in this particular dataset is 24 hours, but it should be noted that TimescaleDB scales easily to work with much shorter time intervals. Our product, in particular, is excellently suited as a basic tool for working with the growing flow of data on new coins and exchanges.
Here is what you can learn for yourself from this post:
Disclaimer: this analysis should not be considered as a recommendation for those or other financial transactions. If you want to conduct your own analysis, pay attention to the instructions , which describe the installation of TimescaleDB and the download of CryptoCompare data.
Let's start with the good old syndrome of lost profits . If you are at least familiar with cryptocurrencies, you have probably heard about Bitcoin, the “great-grandfather” of all cryptocurrencies. It turns out that if in July 2010 you invested $ 100 in it, today this amount would increase to $ 5 million.
During this time, Bitcoin showed a rather pleasant dynamics (even taking into account the relatively recent collapse):
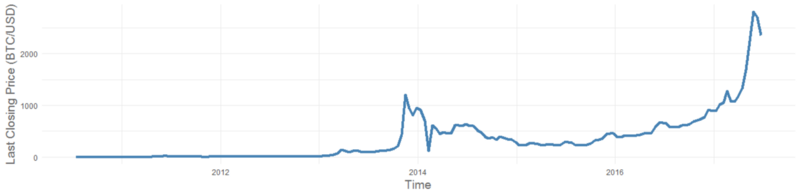
BTC to US dollar exchange rate at the time of the exchange closing in the last 7 years
Using PostgreSQL, we requested BTC price readings at two-week intervals by analyzing the exchange rate to the US dollar on the exchanges. Note: time_bucket and last in this query are TimescaleDB's own functions (not available in PostgreSQL) used to analyze time series.
However, it cannot be said that everything at BTC was always smooth. Let's take a closer look at the daily volatility of the course and perform calculations using the powerful PostgreSQL window functions :
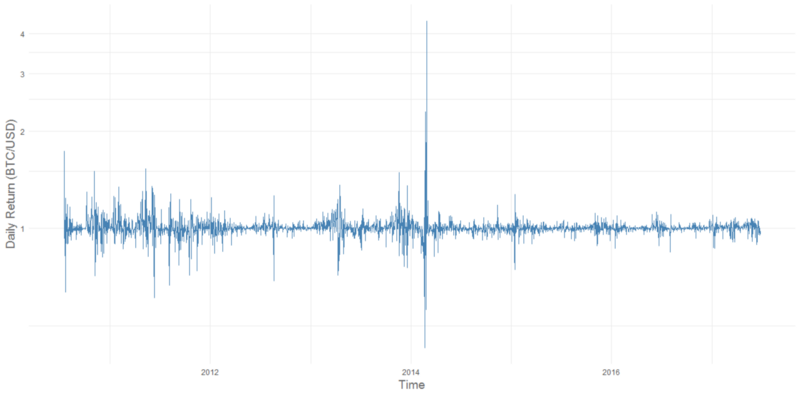
The rate of division of the BTC / USD of the current day by the rate of the previous (7-year period)
Due to the relative immaturity of the market, the course of Bitcoin is subject to significant fluctuations. A stable increase in value as a whole speaks about the success of cryptocurrency, but there is in its history one period of sharp growth, clearly out of the general picture, observed in early 2014. Having considered this period in more detail, we note major jumps in February-March 2014. Investors who invested in BTC at the peak of the market had to wait considerably, because the course soon stabilized, and soon did not reach the indicators at which the sale of bitcoins purchased at that time became a profitable business.

The rate of division of the BTC / USD of the current day by the rate of the previous (2014)
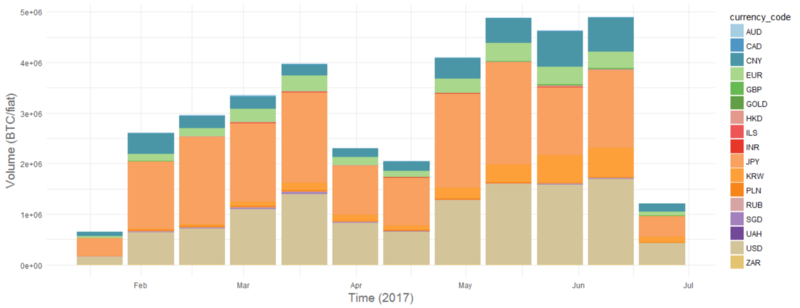
Cryptocurrency market is an international phenomenon. Studying trading volumes in terms of currencies, we noticed something interesting:

BTC trading volumes in various fiat currencies over the past 7 years (two-week intervals, multiple bars)
In 2014, there was a small jump in the value of Bitcoin in China, caused by the alleged devaluation of the yuan and the weakening of the domestic stock market of the country. This was followed by a boom in 2016 and early 2017: the Chinese currency dominated bitcoin trading.

Yuan share in Bitcoin trade for the last year (two-week intervals)
In just a few months, this figure dropped sharply.
What is the reason? Here it is time to go beyond the analysis of numerical data and do the good old research. Our conclusions well illustrate the fact that it is impossible to rely only on quantitative data to study the market.
In early 2017, the People’s Bank of China put into effect decrees restricting the activities of cryptocurrency exchanges. Already in February, the two largest stock exchanges in the country (OKCoin and Huobi.com) suspended the withdrawal of cryptocurrency in exchange for foreign currency, and by the middle of this year the flow of Chinese transactions had disappeared. At the same time, Japan became the leader in the number of transactions with Bitcoins. It even went so far that Bitcoin was recognized as a legal currency in April 2017.
The amount of BTC in various currencies after a sharp decline in the share of BTC / CNY transactions in 2017. BTC / JPY - new leader in terms of volume (two-week intervals)
Despite the fact that the “Bitcoin train went away” back in 2010, there is no cause for concern. Many observers agree that even against the background of its high volatility, the Ethereum price drops look even more impressive (and the recent “correction” is another proof of this). Let's look at the prices of Ethereum in Bitcoin equivalent (as is customary to quote it):

ETH to BTC at the close of the trading day for the last 3 years
However, as we know, Bitcoin itself is not marked by noticeable stability, which reduces the usefulness of the above graph. Let's look at ETH prices in fiat currencies, with the help of daily BTC exchange prices for fiat currencies. (To do this, we use the useful properties of the Postgres JOINs and several clever filters):
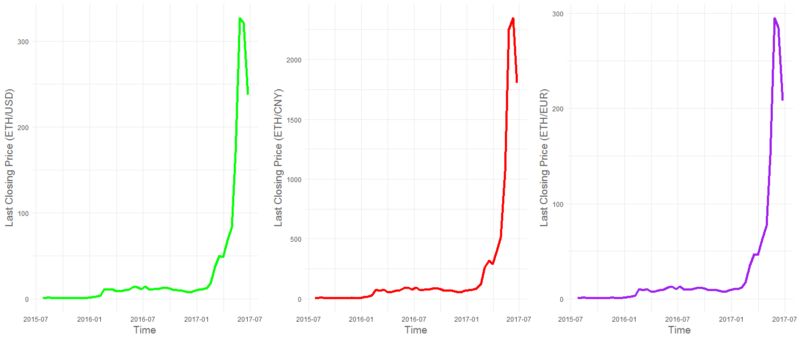
ETH rate to three fiat currencies at the close of the trading day for the last 3 years
In the first year of its existence, ETH surpassed any of the annual BTC growth figures for the entire history of the latter. An impressive 530% growth in the average closing price compared to the previous year is a good start. In general, by 2017, the cumulative growth rate for all these years fell in 2017 compared to 2016 to 200%. However, even this result still looks impressive for any other asset. As for the last half year, now prices for ETH have grown by 3000%. Therefore, if you invested $ 100 in ETH in January of this year (almost 7 months ago), today their cost would be $ 3 thousand.
Expressing the value of ETH in stable currencies (USD, EUR, CNY), we see that all three charts have the same shape. In the past six months, there has been a clear increase in all currency equivalents, except for BTC. The ETH / BTC rate chart, being similar to fiat currency charts, is much more prone to BTC cost fluctuations. As a result, attempts to express the price of ETH in BTC create an improbable impression of instability first. Obviously, the BTC is still too young currency to consider it base.
We hope that this brief overview of the BTC and ETH trends has enabled you to better understand the chaotic world of cryptocurrencies. So, what do we do with the other 1200 cryptocurrencies?
Well, for starters, let's use our data set to track their origin:
Important note: Our data set contains information at the time of its collection, which could have happened after the ICO.
Timestamp of the first entry for each cryptocurrency (descending)
The market is constantly evolving, and besides, judging by the daily increase in new cryptocurrencies, it is also constantly expanding. The list published above contains only 20 of the newest tokens as of June 26 and provides an idea of how many new cryptocurrencies appear every week.
Let's calculate the number of new cryptocurrencies that appear every day based on the first date of the pricing information on them:

Number of new cryptocurrencies per day for the last 4 years

Number of new cryptocurrencies per day for the current year
Number of new cryptocurrencies by date, daily statistics (descending)
When we request information about the first appearance of data on cryptocurrencies (to track their "age"), it becomes noticeable that the market is not only a group of investors, there is another category of its participants - creators of digital assets. Just recently, on May 25–28, according to our recruitment, there was a large influx of new coins — over 300 new tokens in less than a week. (Since our set only records pricing information on cryptocurrencies, the information about their appearance may not correspond to the dates of the ICO.)
Cryptocurrency today is so much that it becomes difficult to distinguish between sensible and doubtful. How can you determine which ones are worthy of attention? Here you have one of the metrics: the total volume of exchange transactions for the last week.
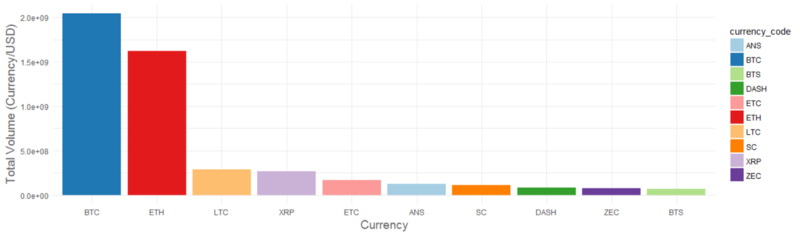
Total volume of transactions of 10 main cryptocurrencies in US dollars for the last week (descending)
Total volume of transactions of 10 main cryptocurrencies in US dollars for the last week (descending)
A small explanation of this request: data on BTC and other cryptocurrencies live in different tables. Therefore, we have to combine these two queries with UNION. Earlier, we also decided that we want to receive quotes in fiat currencies (for example, in dollars), and not in BTC. Therefore, the second half of the query combines the data with a BTC table for converting BTC to USD.
Leaders in terms of operations were, oddly enough, Bitcoin and Ethereum. But the following members of the charts - Litecoin (LTC) , Ripple (XRP) , and Ethereum Classic (ETC) , are almost equal. Litecoin has been on the market for five years, is almost identical to Bitcoin and is often seen as a key player in the market. Ripple, which is positioned as a bank coin for representatives of the international commercial market and works for a more specific audience, is also considered a promising and gaining momentum. It is also interesting that in the top five there is not only ETH, but also ETC, which makes it possible to say that the market today is strongly focused on Ethereum.
Another way to “go through” a long list of cryptocurrencies is to analyze their profitability, for example, the indicator of total daily profit. In our set there are price data for more than 1200 cryptocurrencies. If you look at the largest rate increase per day, you can identify the leaders of intraday trading.
The highest intraday cryptocurrency cost difference (in descending order)
Let's define a cryptocurrency with the largest daily profit margin. To calculate the daily profit, we will use the window function again, and to search for the cryptocurrency that brought the most income on each single day we use the last function from the TimescaleDB set.
A conclusion for the last three months shows the quantitative superiority of AMIS (a 168-fold increase in value on June 15). This cryptocurrency showed the biggest increase in 15 different days. However, after looking more closely at it, we note that high growth is due to equally high price fluctuations: the cost of AMIS is often rolled back to the zero level after each increase.
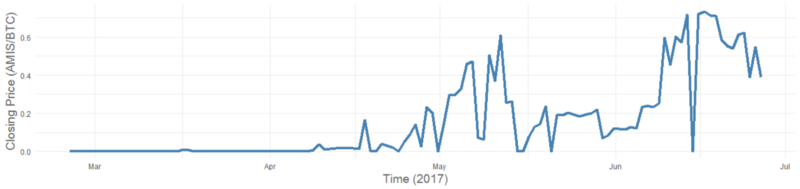
AMIS closing day price in the last five months
Another leader of this sample, YOVI, showed the best result 3 times, but is also subject to similar unreliable trends as AMIS:
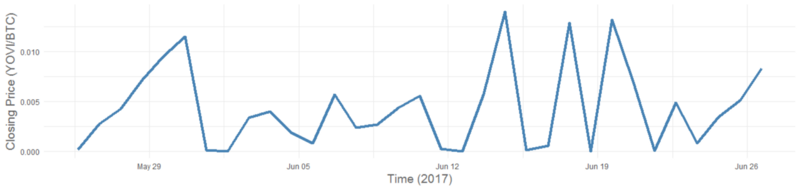
The closing price of the day for YOVI in the last five months
Despite the instability of this pair of trends, they nevertheless look more promising compared to ETH, the cost of which steadily dropped in the first year of its existence (2015):
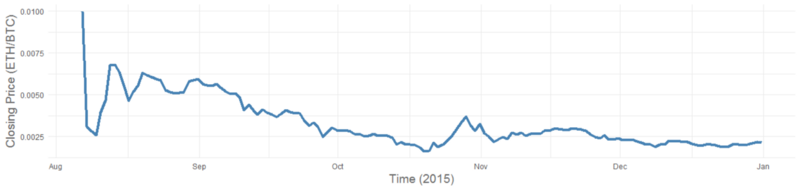
Day closing price for ETH in 2015
(Repeated disclaimer: TimescaleDB does not support any of these cryptocurrencies and is not responsible for your investments in them and any possible losses associated with them.)
In this material, we made several conclusions from an open data set on cryptocurrencies, demonstrating the strengths of PostgreSQL and TimescaleDB. Nevertheless, it should be remembered that the cryptocurrency market will inevitably change next month, next week or even tomorrow.
However, if you want to independently study this set and carry out your analysis, the appropriate instruction for downloading data and installing TimescaleDB is available at your service.
If you want to learn more about TimescaleDB and how it improves PostgreSQL's efficiency in working with time series, we recommend that you familiarize yourself with the technical post .

Recently there is a feeling that money grows on trees.
The volume of stock trading reaches millions of dollars, and market capitalization - billions . It is time to talk about the gold rush, fueled by the emergence of an increasing number of new cryptocurrencies.
We live in an era of digital currencies. Appearing less than 10 years ago, the concept of cryptocurrency has already become widespread today. Despite such a short time, there are already over a thousand different cryptocurrencies on the market, and ICOs occur almost every day .
As we get used to the new, rapidly gaining market, it is important to try to understand what is happening to it. There are many risks, both at the micro level (for example, personal investment) and at the macro level (for example, preventing market crashes or large capital losses). This is where we come into play.
We are dealing with data, or more precisely, I represent the development team of TimescaleDB , a new open source PostgreSQL database for working with time series. We thought that it would be useful and exciting to analyze the cryptocurrency market using PostgreSQL and TimescaleDB (and R to visualize the received data).
In the course of the work, we analyzed historical data on OHLC-charts for more than 1200 cryptocurrencies, kindly provided to us by CryptoCompare (the last sample date is June 26 of this year). The step in this particular dataset is 24 hours, but it should be noted that TimescaleDB scales easily to work with much shorter time intervals. Our product, in particular, is excellently suited as a basic tool for working with the growing flow of data on new coins and exchanges.
Here is what you can learn for yourself from this post:
- A few valuable general conclusions about the state of affairs in the cryptocurrency market.
- Better understanding of how a bunch of TimescaleDB + PostgreSQL can simplify data analysis by time series.
- Get instructions for self-loading this data set, discover new trends (and maybe even make your own strategy for entering the market with their help!).
Disclaimer: this analysis should not be considered as a recommendation for those or other financial transactions. If you want to conduct your own analysis, pay attention to the instructions , which describe the installation of TimescaleDB and the download of CryptoCompare data.
So, if 7 years ago you invested $ 100 in Bitcoin, now it would be worth ...
Let's start with the good old syndrome of lost profits . If you are at least familiar with cryptocurrencies, you have probably heard about Bitcoin, the “great-grandfather” of all cryptocurrencies. It turns out that if in July 2010 you invested $ 100 in it, today this amount would increase to $ 5 million.
During this time, Bitcoin showed a rather pleasant dynamics (even taking into account the relatively recent collapse):
-- BTC USD prices by two week intervals SELECT time_bucket('14 days', time) as period, last(closing_price, time) AS last_closing_price FROM btc_prices WHERE currency_code = 'USD' GROUP BY currency_code, period ORDER BY period;
BTC to US dollar exchange rate at the time of the exchange closing in the last 7 years
Using PostgreSQL, we requested BTC price readings at two-week intervals by analyzing the exchange rate to the US dollar on the exchanges. Note: time_bucket and last in this query are TimescaleDB's own functions (not available in PostgreSQL) used to analyze time series.
We hope that you did not buy bitcoins in February 2014 ...
However, it cannot be said that everything at BTC was always smooth. Let's take a closer look at the daily volatility of the course and perform calculations using the powerful PostgreSQL window functions :
-- Daily BTC returns by day SELECT time, closing_price / lead(closing_price) over prices AS daily_factor FROM ( SELECT time, closing_price FROM btc_prices WHERE currency_code = 'USD' GROUP BY 1,2 ) sub window prices AS (ORDER BY time DESC);
The rate of division of the BTC / USD of the current day by the rate of the previous (7-year period)
Due to the relative immaturity of the market, the course of Bitcoin is subject to significant fluctuations. A stable increase in value as a whole speaks about the success of cryptocurrency, but there is in its history one period of sharp growth, clearly out of the general picture, observed in early 2014. Having considered this period in more detail, we note major jumps in February-March 2014. Investors who invested in BTC at the peak of the market had to wait considerably, because the course soon stabilized, and soon did not reach the indicators at which the sale of bitcoins purchased at that time became a profitable business.
The rate of division of the BTC / USD of the current day by the rate of the previous (2014)
Goodbye China, hello Japan
Cryptocurrency market is an international phenomenon. Studying trading volumes in terms of currencies, we noticed something interesting:
-- BTC trading volumes by currency SELECT time_bucket('14 days', time) as period, currency_code, sum(volume_btc) FROM btc_prices GROUP BY currency_code, period ORDER BY period;
BTC trading volumes in various fiat currencies over the past 7 years (two-week intervals, multiple bars)
In 2014, there was a small jump in the value of Bitcoin in China, caused by the alleged devaluation of the yuan and the weakening of the domestic stock market of the country. This was followed by a boom in 2016 and early 2017: the Chinese currency dominated bitcoin trading.
Yuan share in Bitcoin trade for the last year (two-week intervals)
In just a few months, this figure dropped sharply.
What is the reason? Here it is time to go beyond the analysis of numerical data and do the good old research. Our conclusions well illustrate the fact that it is impossible to rely only on quantitative data to study the market.
In early 2017, the People’s Bank of China put into effect decrees restricting the activities of cryptocurrency exchanges. Already in February, the two largest stock exchanges in the country (OKCoin and Huobi.com) suspended the withdrawal of cryptocurrency in exchange for foreign currency, and by the middle of this year the flow of Chinese transactions had disappeared. At the same time, Japan became the leader in the number of transactions with Bitcoins. It even went so far that Bitcoin was recognized as a legal currency in April 2017.
The amount of BTC in various currencies after a sharp decline in the share of BTC / CNY transactions in 2017. BTC / JPY - new leader in terms of volume (two-week intervals)
And now let's discuss what it would be like if you invested $ 100 in ETH in January 2017 ...
Despite the fact that the “Bitcoin train went away” back in 2010, there is no cause for concern. Many observers agree that even against the background of its high volatility, the Ethereum price drops look even more impressive (and the recent “correction” is another proof of this). Let's look at the prices of Ethereum in Bitcoin equivalent (as is customary to quote it):
-- ETH prices in BTC by two week intervals SELECT time_bucket('14 days', c.time) as period, last(c.closing_price, c.time) AS last_closing_price_in_btc FROM crypto_prices c WHERE c.currency_code = 'ETH' GROUP BY period ORDER BY period;
ETH to BTC at the close of the trading day for the last 3 years
However, as we know, Bitcoin itself is not marked by noticeable stability, which reduces the usefulness of the above graph. Let's look at ETH prices in fiat currencies, with the help of daily BTC exchange prices for fiat currencies. (To do this, we use the useful properties of the Postgres JOINs and several clever filters):
-- ETH prices in BTC, USD, EUR, and CNY by two week intervals SELECT time_bucket('14 days', c.time) as period, last(c.closing_price, c.time) AS last_closing_price_in_btc, last(c.closing_price, c.time) * last(b.closing_price, c.time) filter (WHERE b.currency_code = 'USD') AS last_closing_price_in_usd, last(c.closing_price, c.time) * last(b.closing_price, c.time) filter (WHERE b.currency_code = 'EUR') AS last_closing_price_in_eur, last(c.closing_price, c.time) * last(b.closing_price, c.time) filter (WHERE b.currency_code = 'CNY') AS last_closing_price_in_cny FROM crypto_prices c JOIN btc_prices b ON time_bucket('1 day', c.time) = time_bucket('1 day', b.time) WHERE c.currency_code = 'ETH' GROUP BY period ORDER BY period;
ETH rate to three fiat currencies at the close of the trading day for the last 3 years
In the first year of its existence, ETH surpassed any of the annual BTC growth figures for the entire history of the latter. An impressive 530% growth in the average closing price compared to the previous year is a good start. In general, by 2017, the cumulative growth rate for all these years fell in 2017 compared to 2016 to 200%. However, even this result still looks impressive for any other asset. As for the last half year, now prices for ETH have grown by 3000%. Therefore, if you invested $ 100 in ETH in January of this year (almost 7 months ago), today their cost would be $ 3 thousand.
Expressing the value of ETH in stable currencies (USD, EUR, CNY), we see that all three charts have the same shape. In the past six months, there has been a clear increase in all currency equivalents, except for BTC. The ETH / BTC rate chart, being similar to fiat currency charts, is much more prone to BTC cost fluctuations. As a result, attempts to express the price of ETH in BTC create an improbable impression of instability first. Obviously, the BTC is still too young currency to consider it base.
What about the other 1200 cryptocurrencies?
We hope that this brief overview of the BTC and ETH trends has enabled you to better understand the chaotic world of cryptocurrencies. So, what do we do with the other 1200 cryptocurrencies?
Well, for starters, let's use our data set to track their origin:
Important note: Our data set contains information at the time of its collection, which could have happened after the ICO.
-- Currencies sorted by first time we have data for them SELECT ci.currency_code, min(c.time) FROM currency_info ci JOIN crypto_prices c ON ci.currency_code = c.currency_code AND c.closing_price > 0 GROUP BY ci.currency_code ORDER BY min(c.time) DESC;
currency_code | min ---------------+------------------------ CIR | 2017-06-26 20:00:00+00 MDC | 2017-06-26 20:00:00+00 WBTC | 2017-06-26 20:00:00+00 NET | 2017-06-26 20:00:00+00 NAS2 | 2017-06-26 20:00:00+00 TPAY | 2017-06-26 20:00:00+00 MRSA | 2017-06-26 20:00:00+00 XCI | 2017-06-26 20:00:00+00 PAY | 2017-06-19 20:00:00+00 SNM | 2017-06-18 20:00:00+00 LGD | 2017-06-17 20:00:00+00 SNT | 2017-06-16 20:00:00+00 IOT | 2017-06-12 20:00:00+00 QRL | 2017-06-09 20:00:00+00 MGO | 2017-06-09 20:00:00+00 CFI | 2017-06-08 20:00:00+00 VERI | 2017-06-07 20:00:00+00 EQT | 2017-06-07 20:00:00+00 ZEN | 2017-06-05 20:00:00+00 BAT | 2017-05-31 20:00:00+00
Timestamp of the first entry for each cryptocurrency (descending)
The market is constantly evolving, and besides, judging by the daily increase in new cryptocurrencies, it is also constantly expanding. The list published above contains only 20 of the newest tokens as of June 26 and provides an idea of how many new cryptocurrencies appear every week.
Let's calculate the number of new cryptocurrencies that appear every day based on the first date of the pricing information on them:
-- Number of new currencies with data sorted by day SELECT day, COUNT(code) FROM ( SELECT min(c.time) AS day, ci.currency_code AS code FROM currency_info ci JOIN crypto_prices c ON ci.currency_code = c.currency_code AND c.closing_price > 0 GROUP BY ci.currency_code ORDER BY min(c.time) )a GROUP BY day ORDER BY day DESC;
Number of new cryptocurrencies per day for the last 4 years
Number of new cryptocurrencies per day for the current year
day | count ------------------------+------- 2017-06-26 20:00:00+00 | 8 2017-06-19 20:00:00+00 | 1 2017-06-18 20:00:00+00 | 1 2017-06-17 20:00:00+00 | 1 2017-06-16 20:00:00+00 | 1 2017-06-12 20:00:00+00 | 1 2017-06-09 20:00:00+00 | 2 2017-06-08 20:00:00+00 | 1 2017-06-07 20:00:00+00 | 2 2017-06-05 20:00:00+00 | 1 2017-05-31 20:00:00+00 | 5 2017-05-28 20:00:00+00 | 29 2017-05-27 20:00:00+00 | 13 2017-05-26 20:00:00+00 | 32 2017-05-25 20:00:00+00 | 303 2017-05-16 20:00:00+00 | 1 2017-05-15 20:00:00+00 | 7
Number of new cryptocurrencies by date, daily statistics (descending)
When we request information about the first appearance of data on cryptocurrencies (to track their "age"), it becomes noticeable that the market is not only a group of investors, there is another category of its participants - creators of digital assets. Just recently, on May 25–28, according to our recruitment, there was a large influx of new coins — over 300 new tokens in less than a week. (Since our set only records pricing information on cryptocurrencies, the information about their appearance may not correspond to the dates of the ICO.)
Leaders and chasing cryptocurrency world
Cryptocurrency today is so much that it becomes difficult to distinguish between sensible and doubtful. How can you determine which ones are worthy of attention? Here you have one of the metrics: the total volume of exchange transactions for the last week.
-- 1200+ crypto currencies by total transaction volume (in btc) over the last month SELECT 'BTC' as currency_code, sum(b.volume_currency) as total_volume_in_usd FROM btc_prices b WHERE b.currency_code = 'USD' AND now() - date(b.time) < INTERVAL '8 day' GROUP BY b.currency_code UNION SELECT c.currency_code as currency_code, sum(c.volume_btc) * avg(b.closing_price) as total_volume_in_usd FROM crypto_prices c JOIN btc_prices b ON date(c.time) = date(b.time) WHERE c.volume_btc > 0 AND b.currency_code = 'USD' AND now() - date(b.time) < INTERVAL '8 day' AND now() - date(c.time) < INTERVAL '8 day' GROUP BY c.currency_code ORDER BY total_volume_in_usd DESC;
currency_code | total_volume_in_usd ---------------+--------------------- BTC | 2040879023.54 ETH | 1617388472.94011 LTC | 287613541.293571 XRP | 269417667.514443 ETC | 165712729.612886 ANS | 126377042.5269 SC | 111623857.796786 DASH | 86875922.3588143 ZEC | 78836728.2129428 BTS | 69459051.5958428
Total volume of transactions of 10 main cryptocurrencies in US dollars for the last week (descending)
Total volume of transactions of 10 main cryptocurrencies in US dollars for the last week (descending)
A small explanation of this request: data on BTC and other cryptocurrencies live in different tables. Therefore, we have to combine these two queries with UNION. Earlier, we also decided that we want to receive quotes in fiat currencies (for example, in dollars), and not in BTC. Therefore, the second half of the query combines the data with a BTC table for converting BTC to USD.
Leaders in terms of operations were, oddly enough, Bitcoin and Ethereum. But the following members of the charts - Litecoin (LTC) , Ripple (XRP) , and Ethereum Classic (ETC) , are almost equal. Litecoin has been on the market for five years, is almost identical to Bitcoin and is often seen as a key player in the market. Ripple, which is positioned as a bank coin for representatives of the international commercial market and works for a more specific audience, is also considered a promising and gaining momentum. It is also interesting that in the top five there is not only ETH, but also ETC, which makes it possible to say that the market today is strongly focused on Ethereum.
The most profitable cryptocurrencies
Another way to “go through” a long list of cryptocurrencies is to analyze their profitability, for example, the indicator of total daily profit. In our set there are price data for more than 1200 cryptocurrencies. If you look at the largest rate increase per day, you can identify the leaders of intraday trading.
-- Top crypto by daily return, by day SELECT time, last(currency_code,daily_factor), max(daily_factor) FROM ( SELECT currency_code, time, closing_price, lead(closing_price) over (partition BY currency_code ORDER BY time DESC) AS prev_day_closing_price, closing_price / lead(closing_price) over (partition BY currency_code ORDER BY time DESC) AS daily_factor FROM crypto_prices) q GROUP BY time ORDER BY time DESC;
time | last | daily_return ------------------------+--------+------------------ 2017-06-26 20:00:00+00 | CIN | 40.1428571428571 2017-06-25 20:00:00+00 | KC | 38 2017-06-24 20:00:00+00 | VOYA | 14.2747252747253 2017-06-23 20:00:00+00 | PAY | 3.18506315211422 2017-06-22 20:00:00+00 | YOVI | 119.607843137255 2017-06-21 20:00:00+00 | ION | 7.97665369649805 2017-06-20 20:00:00+00 | TES | 5.25157232704403 2017-06-19 20:00:00+00 | KNC | 150000 2017-06-18 20:00:00+00 | ZNY | 22.5217391304348 2017-06-17 20:00:00+00 | YOVI | 22.0590746115759 2017-06-16 20:00:00+00 | LTD | 9.50207468879668 2017-06-15 20:00:00+00 | AMIS | 168758.782201405 2017-06-14 20:00:00+00 | JANE | 6 2017-06-13 20:00:00+00 | YOVI | 690.636254501801 2017-06-12 20:00:00+00 | U | 5.21452145214522 2017-06-11 20:00:00+00 | JANE | 6 2017-06-10 20:00:00+00 | WGO | 3.58744394618834 2017-06-09 20:00:00+00 | BNT | 5000 2017-06-08 20:00:00+00 | XNC | 52.7704485488127 2017-06-07 20:00:00+00 | CBD | 14.3243243243243 2017-06-06 20:00:00+00 | CC | 72 2017-06-05 20:00:00+00 | BLAZR | 7.38461538461538 2017-06-04 20:00:00+00 | GREXIT | 13.0833333333333 2017-06-03 20:00:00+00 | EPY | 4.29880478087649 2017-06-02 20:00:00+00 | YOVI | 1257.67790262172 2017-06-01 20:00:00+00 | FCN | 8.57142857142857 2017-05-31 20:00:00+00 | EPY | 348.611111111111 2017-05-30 20:00:00+00 | BST | 14.1441860465116 2017-05-29 20:00:00+00 | FCN | 45.3086419753086 2017-05-28 20:00:00+00 | NOO | 56536.231884058
The highest intraday cryptocurrency cost difference (in descending order)
Let's define a cryptocurrency with the largest daily profit margin. To calculate the daily profit, we will use the window function again, and to search for the cryptocurrency that brought the most income on each single day we use the last function from the TimescaleDB set.
A conclusion for the last three months shows the quantitative superiority of AMIS (a 168-fold increase in value on June 15). This cryptocurrency showed the biggest increase in 15 different days. However, after looking more closely at it, we note that high growth is due to equally high price fluctuations: the cost of AMIS is often rolled back to the zero level after each increase.
AMIS closing day price in the last five months
Another leader of this sample, YOVI, showed the best result 3 times, but is also subject to similar unreliable trends as AMIS:
The closing price of the day for YOVI in the last five months
Despite the instability of this pair of trends, they nevertheless look more promising compared to ETH, the cost of which steadily dropped in the first year of its existence (2015):
Day closing price for ETH in 2015
(Repeated disclaimer: TimescaleDB does not support any of these cryptocurrencies and is not responsible for your investments in them and any possible losses associated with them.)
So, it turns out that money is growing ... on Merkle trees ?
In this material, we made several conclusions from an open data set on cryptocurrencies, demonstrating the strengths of PostgreSQL and TimescaleDB. Nevertheless, it should be remembered that the cryptocurrency market will inevitably change next month, next week or even tomorrow.
However, if you want to independently study this set and carry out your analysis, the appropriate instruction for downloading data and installing TimescaleDB is available at your service.
If you want to learn more about TimescaleDB and how it improves PostgreSQL's efficiency in working with time series, we recommend that you familiarize yourself with the technical post .
All Articles