この記事の後には何が得られますか:
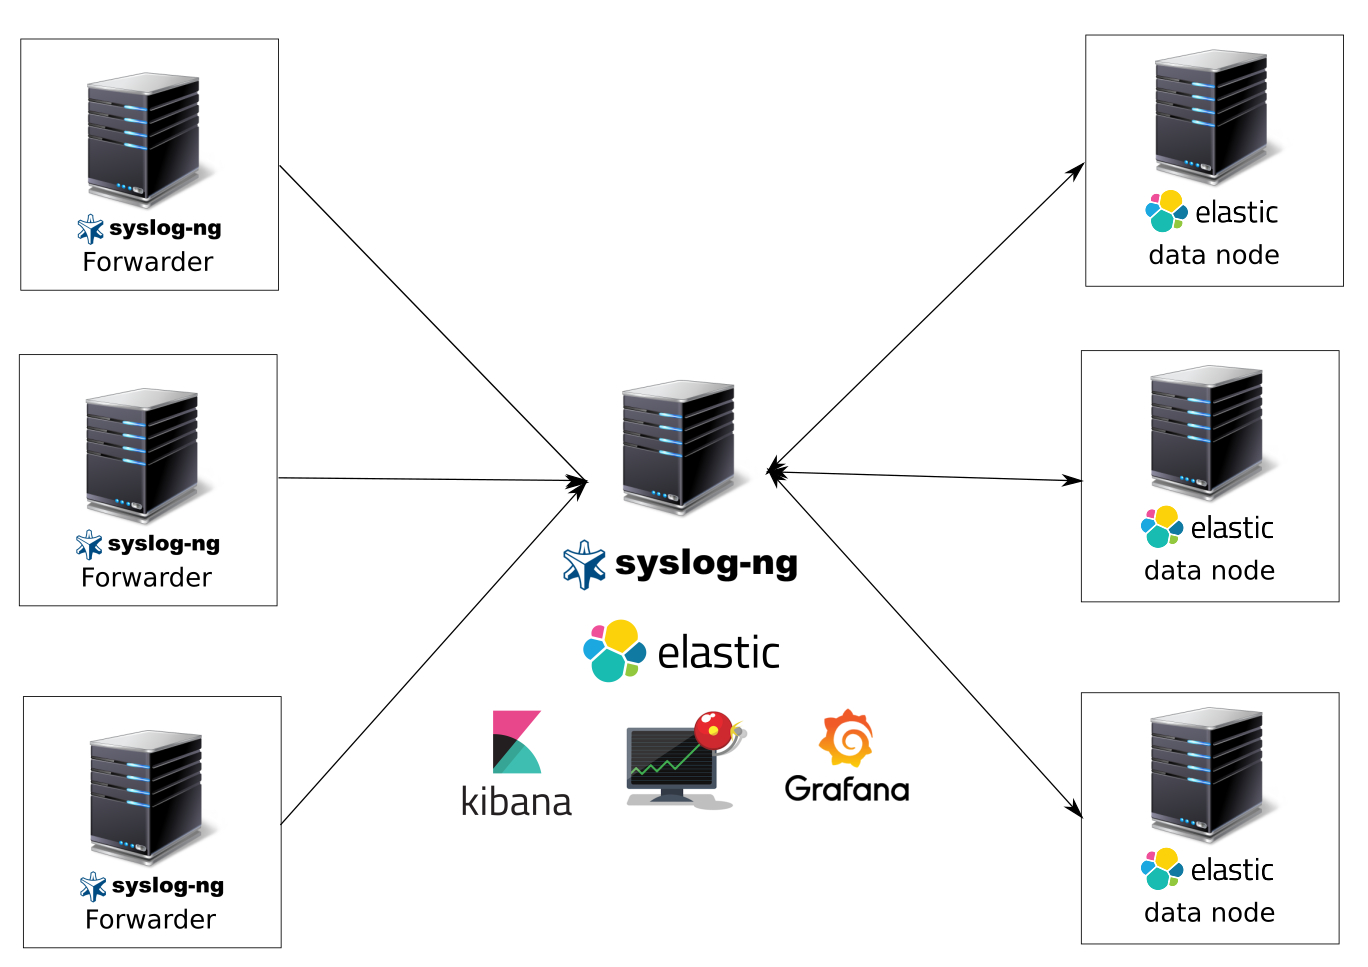
syslog-ngでログを収集および分析するシステム、データウェアハウスとしてelasticsearch、データ視覚化システムとしてkibanaおよびgrafana、ログによる便利な検索のためのkibana、イベント通知を送信するためのelasticalert。 ボリュームチュートリアルの準備をします。
収集するログ:
- ファシリティ(auth、syslog、メッセージなど)に応じてインデックスによってレイアウトされたすべてのシステムログ。
- nginxログ-アクセスとエラー。
- pm2を記録します。
- その他
システムを選択する理由
送信者、パーサー、ログ受信者としてsyslog-ngバンドルを選択したのはなぜですか? はい、それは非常に高速で信頼性が高く、リソースを必要としません(はい-はい)、幅広い機能-解析、フィルタリング、多数のデータストア(postgresql、mysql、elasticsearch、ファイルなど)、バッファリング(updはバッファリングをサポートしていません)、サードパーティモジュールおよびその他のチップ。
要件:
- Ubuntu 16.04またはdebian 8-9;
- デプロイ用のvm。
- まっすぐな腕。
進むか、猫へようこそ
少し説明。
運用ではelasticsearchクラスターのみを使用できます。1つのノードのシステムは単純に曲がります。 本番環境では、マスターノードと複数のデータノードのクラスターを使用します。 フェールオーバークラスターはここでは考慮されません。 誰も気にしない-先にグーグル。 クラスターは最も遅いノードの速度で動作するため、Elasticではクラスターノードに同じ構成を使用することをお勧めします。 4 cpuのノードと12 gbのRAMと700 gb ssdのノードを使用します。
ロギングシステムは、ヘッドサーバー(elasticnode1)とデータのみが保存されるelasticsearch datanode(elasticnode2-9)という複数の仮想マシンで構成されます。
DNSサーバーが構成されていない場合は、/ etc / hostsファイルをすぐに修正します。
10.10.10.210 elasticsearch-node1 elasticnode1 10.10.10.211 elasticsearch-node2 elasticnode2 10.10.10.212 elasticsearch-node3 elasticnode3 10.10.10.213 elasticsearch-node4 elasticnode4 10.10.10.214 elasticsearch-node5 elasticnode5 10.10.10.215 elasticsearch-node6 elasticnode6 10.10.10.216 elasticsearch-node7 elasticnode7 10.10.10.217 elasticsearch-node8 elasticnode8 10.10.10.218 elasticsearch-node9 elasticnode9
スケジューラを変更します-ssdがあります
echo noop > /sys/block/sda/queue/scheduler
ヘッドサーバーコンポーネント
(elasticnode1):
- syslog-ng-ログのメインの受信者、プロセッサ、および送信者。
- docker-その中で、grafana、kibana、elasticalertを発生させます。
- kibana-ログの視覚化と検索。
- grafana-視覚化と通知の送信(現時点では、データストアとしてelasticsearchを使用して通知を送信することはできません);
- elasticalert(それを介してelasticsearchからtelegramに通知を送信します-それなしではどこに行きますか);
- elasticsearch-実際には、ノードと解析済みファイルからすべてのデータを送信します。
- Kachetva OSのubuntu 16.04
データノードのコンポーネント(elasticnode2-elasticnode7):
- elasticsearch;
- ハチとしてのubuntu 16.04
ログ送信者コンポーネント:
- UbuntuまたはDebian
- syslog-ng。
現時点では、elasticsearch、kibanaなどの製品のバージョン6が登場していますが、本番では5.6.3を使用しています-最新バージョンに移行できるようになるまで。
ログの送信者を設定します。
syslog-ng最新バージョンをインストールします。 リポジトリからインストールします。 これがUbuntu 16.04のインストールです。
systemctl disable rsyslog; systemctl stop rsyslog; apt-get purge rsyslog -y wget -P . http://download.opensuse.org/repositories/home:/laszlo_budai:/syslog-ng/xUbuntu_17.04/Release.key; apt-key add Release.key echo "deb http://download.opensuse.org/repositories/home:/laszlo_budai:/syslog-ng/xUbuntu_16.10 ./" > /etc/apt/sources.list.d/syslog-ng-obs.list wget http://no.archive.ubuntu.com/ubuntu/pool/main/j/json-c/libjson-c3_0.12.1-1.1_amd64.deb && dpkg -i libjson-c3_0.12.1-1.1_amd64.deb apt-get update && apt-get install syslog-ng-core -y
Tyunim sysctl.conf
上書きする
: > /etc/sysctl.conf
挿入
nano /etc/sysctl.conf
vm.swappiness=1 vm.max_map_count=262144 net.ipv4.tcp_wmem = 4096 65536 16777216 net.ipv4.tcp_wmem = 4096 262144 4194304 net.ipv4.tcp_window_scaling = 1 net.ipv4.tcp_tw_reuse = 0 #net.ipv4.tcp_tw_recycle = 0 net.ipv4.tcp_timestamps = 1 net.ipv4.tcp_syncookies = 0 net.ipv4.tcp_synack_retries = 1 net.ipv4.tcp_sack = 1 net.ipv4.tcp_rmem = 4096 262144 4194304 net.ipv4.tcp_rfc1337 = 1 net.ipv4.tcp_orphan_retries = 0 net.ipv4.tcp_no_metrics_save = 1 net.ipv4.tcp_moderate_rcvbuf = 1 net.ipv4.tcp_mem = 50576 64768 98152 net.ipv4.tcp_max_syn_backlog = 65536 net.ipv4.tcp_max_orphans = 65536 net.ipv4.tcp_keepalive_time = 600 net.ipv4.tcp_keepalive_probes = 20 net.ipv4.tcp_keepalive_intvl = 60 net.ipv4.tcp_fin_timeout = 10 net.ipv4.tcp_congestion_control = htcp net.ipv4.tcp_adv_win_scale = 2 net.ipv4.route.flush = 1 net.ipv4.ip_local_port_range = 10240 65535 net.ipv4.ip_forward = 1 net.ipv4.icmp_ignore_bogus_error_responses = 1 net.ipv4.icmp_echo_ignore_broadcasts = 1 net.ipv4.icmp_echo_ignore_all = 1 net.ipv4.conf.lo.rp_filter = 1 net.ipv4.conf.lo.accept_source_route = 0 net.ipv4.conf.default.rp_filter = 1 net.ipv4.conf.default.accept_source_route = 0 net.ipv4.conf.all.send_redirects = 0 net.ipv4.conf.all.secure_redirects = 0 net.ipv4.conf.all.rp_filter = 1 net.ipv4.conf.all.accept_source_route = 0 net.ipv4.conf.all.accept_redirects = 0 kernel.sem = 350 358400 64 1024 fs.inotify.max_user_watches = 67108864 fs.file-max = 518144 net.core.somaxconn = 15000 #net.core.netdev_max_backlog = 1000 net.core.rmem_default = 65536 net.core.wmem_default = 65536 net.core.rmem_max = 67108864 net.core.wmem_max = 67108864 # Connection tracking to prevent dropped connections (usually issue on LBs) net.netfilter.nf_conntrack_max=262144 net.netfilter.nf_conntrack_tcp_timeout_established=86400
適用する
sysctl -p
ログを解析してクライアントからサーバーに送信するためにsyslog-ngを構成します。
/etc/syslog-ng/syslog-ng.confをこの形式にします。
@version: 3.13 @include "scl.conf" # options { sync (5000); time_reopen (10); time_reap(5); long_hostnames (off); use_dns (no); use_fqdn (no); create_dirs (no); keep_hostname (yes); log_fifo_size (536870912); stats_freq(60); flush_lines(500); flush_timeout(10000); bad_hostname("^gconfd$"); }; @include "/etc/syslog-ng/conf.d/*.conf"
サーバーにログを送信するための構成を作成します。
mkdir -p /etc/syslog-ng/conf.d/
ここに次の内容を貼り付けてください
nano /etc/syslog-ng/conf.d/output.conf
source s_src { system(); internal(); }; destination d_net { udp("elasticnode1" port(514) ); }; log { source(s_src); destination(d_net); };
したがって、すべてのログをudp経由でサーバーポート514に送信します。 そこで彼はそれらに対処します-インデックス、フィルターなどで分解します。
ログの内容を出力してnginxアクセスおよびエラーログを送信し、udpを介して指定ポートに送信することを設定します。
なぜnginxからポートに直接送信するのではなく、ファイルからコンテンツを出力し、udp経由で送信することを選択したのですか? nginxから直接ログを送信すると、奇妙なバグがいくつかありました(サーバーは500および502エラーを大量に返し始めました)。
nginxに送信するためのログを設定します。 nginx.conf構成を編集します。
# nginx, syslog-ng. log_format full_format '"$time_iso8601"|"$host"|"$http_host"|"$remote_addr"|"$http_x_forwarded_for"|"$request_method"|"$request"|"$status"|"$upstream_status"|"$body_bytes_sent"|"$http_referer"|"$request_time"|"$upstream_response_time"|"$upstream_http_x_cache"|"$uri"|"$upstream_addr"|"$upstream_response_length"|"$server_name"|"$upstream_cache_status"|"$http_user_agent"|"$scheme://$host$request_uri"|"$cookie_bar"'; access_log /var/log/nginx/access.log full_format; error_log /var/log/nginx/error.log; # , !!!!!! UDP!!!!! access_log syslog:server=syslogng-server:25230,tag=nginx1 full_format; error_log syslog:server=syslogng-server:25231,tag=nginx1 warn;
nginxを再起動します。 すべてのログは、上記の2つのファイルのフォルダー/ var / log / nginx /に(構成で再定義していない場合)分類されます。
ファイルを読み取り、udp経由で送信するようにsyslog-ngを構成します。
nano /etc/syslog-ng/conf.d/output-nginx-logs.conf
#### nginx_access destination udp_remote_log_host_nginx_main { udp("elasticnode1" port(25230) ); }; ### udp, tcp, destination tcp-remote_log_host_nginx_main { tcp ( "elasticnode1" port(25230) disk-buffer( mem-buf-length(10000) disk-buf-size(2000000) reliable(no) ) ); }; ###### nginx access################## source s_tail_log_host_nginx_main { file( "/var/log/nginx/access_main.log" follow_freq(1) flags(no-parse) ); }; log {source(s_tail_log_host_nginx_main); destination(udp_remote_log_host_nginx_main);}; #### nginx_error destination d_server_nginx_error { udp("elasticnode1" port(25231) ); }; source s_tail_nginx_error { file( "/var/log/nginx/error.log" follow_freq(1) flags(no-parse) ); }; log {source(s_tail_nginx_error ); destination(d_server_nginx_error);};
サーバー上のすべてのスペースを使い果たすことがないように、ログファイルを定期的にリセットすることを忘れないでください。 このスクリプトは王冠で使用できます。
#!/bin/bash /usr/bin/find /var/log/ -type f | xargs truncate -s 0 /usr/sbin/logrotate /etc/logrotate.conf > /dev/null 2>&1
syslog-ng、elasticsearch、kibana、grafana、elasticalertを使用してヘッドサーバーを構成します。
手始めに、「tyunim」「system。
Tyunim limits.conf
上書きする
: > /etc/security/limits.conf
挿入
nano /etc/security/limits.conf
* hard memlock unlimited * soft memlock unlimited * - nofile 999999 root soft nproc unlimited
確認する
ulimit -a
Tyunim sysctl.conf
上書きする
: > /etc/sysctl.conf
挿入
nano /etc/sysctl.conf
vm.swappiness=1 vm.max_map_count=262144 net.ipv4.tcp_wmem = 4096 65536 16777216 net.ipv4.tcp_wmem = 4096 262144 4194304 net.ipv4.tcp_window_scaling = 1 net.ipv4.tcp_tw_reuse = 0 #net.ipv4.tcp_tw_recycle = 0 net.ipv4.tcp_timestamps = 1 net.ipv4.tcp_syncookies = 0 net.ipv4.tcp_synack_retries = 1 net.ipv4.tcp_sack = 1 net.ipv4.tcp_rmem = 4096 262144 4194304 net.ipv4.tcp_rfc1337 = 1 net.ipv4.tcp_orphan_retries = 0 net.ipv4.tcp_no_metrics_save = 1 net.ipv4.tcp_moderate_rcvbuf = 1 net.ipv4.tcp_mem = 50576 64768 98152 net.ipv4.tcp_max_syn_backlog = 65536 net.ipv4.tcp_max_orphans = 65536 net.ipv4.tcp_keepalive_time = 600 net.ipv4.tcp_keepalive_probes = 20 net.ipv4.tcp_keepalive_intvl = 60 net.ipv4.tcp_fin_timeout = 10 net.ipv4.tcp_congestion_control = htcp net.ipv4.tcp_adv_win_scale = 2 net.ipv4.route.flush = 1 net.ipv4.ip_local_port_range = 10240 65535 net.ipv4.ip_forward = 1 net.ipv4.icmp_ignore_bogus_error_responses = 1 net.ipv4.icmp_echo_ignore_broadcasts = 1 net.ipv4.icmp_echo_ignore_all = 1 net.ipv4.conf.lo.rp_filter = 1 net.ipv4.conf.lo.accept_source_route = 0 net.ipv4.conf.default.rp_filter = 1 net.ipv4.conf.default.accept_source_route = 0 net.ipv4.conf.all.send_redirects = 0 net.ipv4.conf.all.secure_redirects = 0 net.ipv4.conf.all.rp_filter = 1 net.ipv4.conf.all.accept_source_route = 0 net.ipv4.conf.all.accept_redirects = 0 kernel.sem = 350 358400 64 1024 fs.inotify.max_user_watches = 67108864 fs.file-max = 518144 net.core.somaxconn = 15000 #net.core.netdev_max_backlog = 1000 net.core.rmem_default = 65536 net.core.wmem_default = 65536 net.core.rmem_max = 67108864 net.core.wmem_max = 67108864 # Connection tracking to prevent dropped connections (usually issue on LBs) net.netfilter.nf_conntrack_max=262144 net.netfilter.nf_conntrack_tcp_timeout_established=86400
適用する
systctl -p
スワップをオフにします。
swapoff -a
rsyslogを削除する
systemctl disable rsyslog systemctl stop rsyslog apt purge rsyslog -y
サーバーのすべての最新モジュールを使用してソースからsyslog-ngを収集します。
依存関係:
apt-get install bison gcc+ libglib2.0-0 libpcre3 glib-2.0 libglib2.0-dev flex python-dev libriemann-client-dev riemann-c-client libhiredis-dev libesmtp-dev libnet-dev libmaxminddb-dev libgeoip-dev libdbi-dev autoconf-archive libpixman-1-dev apt-get install libcurl4-openssl-dev -y
Granleをインストールする
wget https://services.gradle.org/distributions/gradle-4.4-bin.zip mkdir /opt/gradle unzip -d /opt/gradle gradle-4.4-bin.zip ls /opt/gradle/gradle-4.4 export PATH=$PATH:/opt/gradle/gradle-4.4/bin configure && make && make install
java8を入れてパスをエクスポートします
apt-get install openjdk-8-jdk -y export LD_LIBRARY_PATH=/usr/lib/jvm/java-8-openjdk-amd64/jre/lib/amd64/server:$LD_LIBRARY_PATH
syslog-ngリポジトリを複製し、ビルドしてインストールします
git clone https://github.com/balabit/syslog-ng/ cd syslog-ng ./autogen.sh ./configure --enable-all-modules --enable-systemd make -j4 && make install ldconfig -v
init.dスクリプトを追加します-アセンブリ(パス)中に何も変更しなかった場合、すべてが機能します。
nano /etc/init.d/syslog-ng
#! /bin/sh ### BEGIN INIT INFO # Provides: syslog-ng # Required-Start: $local_fs $network $time $remote_fs # Required-Stop: $local_fs $network $time $remote_fs # Default-Start: 2 3 4 5 # Default-Stop: 0 1 6 # Short-Description: Starting system logging daemon # Description: Starting syslog-NG, the next generation # syslog daemon. ### END INIT INFO# set -e SYSLOGNG_OPTS="" #we source /etc/default/syslog-ng if exists [ -r /etc/default/syslog-ng ] && . /etc/default/syslog-ng # stop syslog-ng before changing its PID file! PIDFILE="/var/run/syslog-ng.pid" SYSLOGNG="/usr/sbin/syslog-ng" NAME="syslog-ng" PATH=/sbin:/bin:/usr/sbin:/usr/bin test -f $SYSLOGNG || exit 0 # Define LSB log_* functions. # Depend on lsb-base (>= 3.0-6) to ensure that this file is present. . /lib/lsb/init-functions case "x$CONSOLE_LOG_LEVEL" in x[1-8]) dmesg -n $CONSOLE_LOG_LEVEL ;; x) ;; *) log_warning_msg "CONSOLE_LOG_LEVEL is of unaccepted value." ;; esac create_xconsole() { XCONSOLE=/dev/xconsole if [ "$(uname -s)" = "GNU/kFreeBSD" ]; then XCONSOLE=/var/run/xconsole ln -sf $XCONSOLE /dev/xconsole fi if [ ! -e $XCONSOLE ]; then mknod -m 640 $XCONSOLE p chown root:adm $XCONSOLE [ -x /sbin/restorecon ] && /sbin/restorecon $XCONSOLE fi } create_pidfiledir() { if [ ! -d /var/run/syslog-ng ] then mkdir -p /var/run/syslog-ng fi } syslogng_wait() { if [ "$2" -ne 0 ]; then return 1 fi if [ -n "$DPKG_MAINTSCRIPT_PACKAGE" ]; then return 0 fi RET=1 for i in $(seq 1 30); do status=0 syslog-ng-ctl stats >/dev/null 2>&1 || status=$? if [ "$status" != "$1" ]; then RET=0 break fi sleep 1s done return $RET } syslogng_start() { log_daemon_msg "Starting system logging" "$NAME" create_pidfiledir create_xconsole start-stop-daemon --start --oknodo --quiet --exec "$SYSLOGNG" \ --pidfile "$PIDFILE" -- -p "$PIDFILE" $SYSLOGNG_OPTS syslogng_wait 1 $? RET="$?" log_end_msg $RET return $RET } syslogng_stop() { log_daemon_msg "Stopping system logging" "$NAME" start-stop-daemon --stop --oknodo --quiet --name "$NAME" --retry 3 \ --pidfile "$PIDFILE" syslogng_wait 0 $? RET="$?" log_end_msg $RET return $RET } syslogng_reload() { log_daemon_msg "Reload system logging" "$NAME" if $SYSLOGNG -s $SYSLOGNG_OPTS then start-stop-daemon --stop --signal 1 --quiet --exec "$SYSLOGNG" \ --pidfile "$PIDFILE" syslogng_wait 1 $? RET="$?" log_end_msg $RET return $RET else log_end_msg 1 return 1 fi } case "$1" in start) syslogng_start || exit 1 ;; stop) syslogng_stop || exit 1 ;; reload|force-reload) syslogng_reload || exit 1 ;; restart) syslogng_stop syslogng_start || exit 1 ;; status) status_of_proc "$SYSLOGNG" "$NAME" && exit 0 || exit $? ;; *) echo "Usage: /etc/init.d/$NAME {start|stop|restart|reload|force-reload|status}" >&2 exit 1 ;; esac exit 0
私たちは彼に権利を与え、マスクを解除します
chmod +x /etc/init.d/syslog-ng && systemctl unmask syslog-ng
debパッケージからelasticsearchをインストールします。
wget https://artifacts.elastic.co/downloads/elasticsearch/elasticsearch-5.6.3.deb dpkg -i elasticsearch-5.6.3.deb
より小さな操作。 データのディレクトリを作成し、システムの再起動後にelasticsearchを自動実行します。
mkdir /elasticsearchdata/ && chown -R elasticsearch:elasticsearch /elasticsearchdata/ update-rc.d elasticsearch defaults 95 10 sudo /bin/systemctl daemon-reload sudo /bin/systemctl enable elasticsearch.service
elasticsearchを最大メモリ使用量に設定します。 これを行うために、elasticsearch.serviceはこの形式に縮小されます。
nano /usr/lib/systemd/system/elasticsearch.service
[Unit] Description=Elasticsearch Documentation=http://www.elastic.co Wants=network-online.target After=network-online.target [Service] Environment=ES_HOME=/usr/share/elasticsearch Environment=CONF_DIR=/etc/elasticsearch Environment=DATA_DIR=/var/lib/elasticsearch Environment=LOG_DIR=/var/log/elasticsearch Environment=PID_DIR=/var/run/elasticsearch EnvironmentFile=-/etc/default/elasticsearch LimitMEMLOCK=infinity WorkingDirectory=/usr/share/elasticsearch User=elasticsearch Group=elasticsearch ExecStartPre=/usr/share/elasticsearch/bin/elasticsearch-systemd-pre-exec ExecStart=/usr/share/elasticsearch/bin/elasticsearch \ -p ${PID_DIR}/elasticsearch.pid \ --quiet \ -Edefault.path.logs=${LOG_DIR} \ -Edefault.path.data=${DATA_DIR} \ -Edefault.path.conf=${CONF_DIR} # StandardOutput is configured to redirect to journalctl since # some error messages may be logged in standard output before # elasticsearch logging system is initialized. Elasticsearch # stores its logs in /var/log/elasticsearch and does not use # journalctl by default. If you also want to enable journalctl # logging, you can simply remove the "quiet" option from ExecStart. StandardOutput=journal StandardError=inherit # Specifies the maximum file descriptor number that can be opened by this process LimitNOFILE=65536 # Specifies the maximum number of processes LimitNPROC=2048 # Specifies the maximum size of virtual memory LimitAS=infinity # Specifies the maximum file size LimitFSIZE=infinity # Disable timeout logic and wait until process is stopped TimeoutStopSec=0 # SIGTERM signal is used to stop the Java process KillSignal=SIGTERM # Send the signal only to the JVM rather than its control group KillMode=process # Java process is never killed SendSIGKILL=no # When a JVM receives a SIGTERM signal it exits with code 143 SuccessExitStatus=143 [Install] WantedBy=multi-user.target # Built for distribution-5.6.3 (distribution)
変更後のsystemctlの反動
systemctl daemon-reload
ファイル/etc/elasticsearch/jvm.optionsを編集します
nano /etc/elasticsearch/jvm.options
elasticsearch開発者の推奨に従って、RAMの半分(VMあたり12ギガバイト)をヒープ領域に6g入れます。
# Xms represents the initial size of total heap space # Xmx represents the maximum size of total heap space -Xms6g -Xmx6g
ホストサーバーでelasticsearch構成を編集します。 フォームに持ってきます
nano /etc/elasticsearch/elasticsearch.yml
network.host: 0.0.0.0 cluster.name: "production" node.name: elasticnode1 discovery.zen.ping.unicast.hosts: ["elasticnode1", "elasticnode2", "elasticnode3","elasticnode4","elasticnode5","elasticnode6","elasticnode7","elasticnode8","elasticnode9"] # avoid swapping the Elasticsearch bootstrap.memory_lock: true ###Make node master - non data node.master: true node.data: false # minimum_master_nodes need to be explicitly set when bound on a public IP discovery.zen.minimum_master_nodes: 1 path.data: /elasticsearchdata/
ここで、データパスを変更し、クラスター名を設定し、マスターノードがあることを示し(クラスター内のデータの分布を制御します)、日付ノードではない(データを保存しない)、すべてのクラスターノードのリストを指定し、elasticsearchのスワップを無効にします(ブートストラップ)。 memory_lock:true)、クラスターのマスターノードの最小数を示します-1(ここではHAを行いません)。
以前に古い日付ディレクトリをクリーンアップして、elasticsearchクラスターを開始します。
rm -rf /var/lib/elasticsearch/* && /etc/init.d/elasticsearch restart
コンソールからクラスターの状態を確認します
curl -XGET 'http://elastinode1:9200/_cluster/state?pretty' curl http://elastinode1:9200/_nodes/process?pretty
elasticsearchデータノードの設定-elasticnode2-9
上記のようにファイル/ etc / hostsを編集します
elasticsearchをインストールし(/usr/lib/systemd/system/elasticsearch.serviceと/etc/elasticsearch/jvm.optionsを忘れないでください)、ウィザードと同じ方法でシステムを調整します。 重要-すべてのノードに同一バージョンのelasticsearchが必要です。
データノードのElasticsearch構成。
nano /etc/elasticsearch/elasticsearch.yml
network.host: 0.0.0.0 cluster.name: "production" node.name: elasticnode2 discovery.zen.ping.unicast.hosts: ["elasticnode1", "elasticnode2", "elasticnode3", "elasticnode4", "elasticnode5", "elasticnode6", "elasticnode7", "elasticnode8", "elasticnode9"] # avoid swapping the Elasticsearch bootstrap.memory_lock: true ###Make node master - non data node.master: false node.data: true # minimum_master_nodes need to be explicitly set when bound on a public IP discovery.zen.minimum_master_nodes: 1 path.data: /elasticsearchdata/
ここでの設定はウィザードに似ています-データのパスを変更し、クラスター名を設定し、データノード(データを格納)であることを示し、すべてのクラスターノードのリストを示し、elasticsearchのスワップを無効にし(bootstrap.memory_lock:true)、マスターノードの最小数を指定しましたクラスター-1。
ノードを起動し、以前に/ var / lib / elasticsearch /を削除します。そうしないと、データストレージパスを変更したため、エラーがスローされます。
rm -rf /var/lib/elasticsearch/* && /etc/init.d/elasticsearch restart
新しいデータノードを追加してクラスターのバランスを再調整する方法をすぐに決定します。
クラスターのすべてのノードの設定で、discovery.zen.ping.unicast.hosts行に新しいノードを追加するだけで、現在のクラスターでelasticsearchを再起動する必要はありません。
コマンドラインからのリクエストを使用して、ホストサーバーでリバランスプロセスを開始します
curl -XPUT http://elasticnode1:9200/_cluster/settings -d '{ "transient" : { "cluster.routing.allocation.enable" : "all" } }'
すぐにcluster.routing.allocation.disk.watermarkをもう一度見てみましょう。
curl -XPUT http://elasticnode1:9200/_cluster/settings -d '{ "transient": { "cluster.routing.allocation.disk.watermark.low": "90%", "cluster.routing.allocation.disk.watermark.high": "10gb", "cluster.info.update.interval": "1m" } }'
6 Elasticsearchの場合
curl -H "Content-Type: application/json" -XPUT http://elasticnode1:9200/_cluster/settings -d '{ "transient": { "cluster.routing.allocation.disk.watermark.low": "93%", "cluster.routing.allocation.disk.watermark.high": "95%", "cluster.info.update.interval": "1m" } }'
ここで、クラスターが動作するための最小利用可能スペースを決定します。このしきい値を超えると、動作を停止します-データを受信します。
ホストサーバーにkibanaとgrafanaをインストールします。
Kibanaとgrafanaは、docker-composeで安全に実行できます。これについては、以下で説明します。 原則として、システム全体をdocker-composeを使用して上げることができます。 以下では、1つのコマンドですべてを上げることができるリポジトリへのリンクをレイアウトします。これは、原則として、小規模なシステムやテストに非常に適しています。 Dockerがすべてです。
ubuntu 16.04にdockerおよびdocker-composeをインストールします
apt-get install \ apt-transport-https \ ca-certificates \ curl \ software-properties-common -y curl -fsSL https://download.docker.com/linux/ubuntu/gpg | apt-key add - add-apt-repository \ "deb [arch=amd64] https://download.docker.com/linux/ubuntu \ $(lsb_release -cs) \ stable" apt-get update && apt-get install docker-ce -y curl -L https://github.com/docker/compose/releases/download/1.18.0/docker-compose-`uname -s`-`uname -m` -o /usr/local/bin/docker-compose chmod +x /usr/local/bin/docker-compose
このコンテンツでdocker-compose.ymlファイルを作成します。 定められた環境kibana.localに注意してください
"ELASTICSEARCH_URL=http://elasticnode1:9200" - elasticsearch
docker-compose.ymlの内容
version: '3.3' services: kibana.local: image: kibana:5.6.3 container_name: kibana.local hostname: kibana.local ports: - "5601:5601" networks: - local-network tty: true privileged: true restart: always extra_hosts: - "elasticnode1:10.10.10.210" environment: - "TZ=Asia/Yekaterinburg" - "ELASTICSEARCH_URL=http://elasticnode1:9200" grafana.local: image: grafana/grafana container_name: grafana.local hostname: grafana.local volumes: - ./configs/grafana/:/etc/grafana/ - ./data/grafana/:/var/lib/grafana/ - ./data/grafana/:/var/log/grafana/ ports: - "13000:3000" networks: - local-network tty: true privileged: true restart: always environment: - "TZ=Asia/Yekaterinburg" - "GF_INSTALL_PLUGINS=grafana-clock-panel,grafana-simple-json-datasource,vonage-status-panel,grafana-piechart-panel,grafana-worldmap-panel" networks: local-network: driver: bridge
docker-composeを実行する
docker-compose up -d
grafanaでは、デフォルトのユーザー名とパスワードはadmin adminです。
私たちはキバナに行きます-すべてが大丈夫です。
さらに進みます。
syslog-ngシステムを構成すると、ログの受信、処理、およびkibanaへの送信がログに記録されます。
geoip2 maxmindデータベースをすぐにダウンロードして、将来的にgeoipマップを作成します。 パーサーgeoip2 syslog-ng 2は、maxminddbライブラリを使用して地理情報を検索します。 開発者によると、以前のバージョンよりもはるかに高速であり、より詳細な情報も提供します。
ダウンロードして解凍します。
cd /usr/local/etc wget http://geolite.maxmind.com/download/geoip/database/GeoLite2-City.mmdb.gz gunzip GeoLite2-City.mmdb.gz
すぐに例を確認してください。
mmdblookup --file GeoLite2-City.mmdb --ip 1.2.3.4 { "city": { "geoname_id": 3054643 <uint32> "names": { "de": "Budapest" <utf8_string> "en": "Budapest" <utf8_string> "es": "Budapest" <utf8_string> "fr": "Budapest" <utf8_string> "ja": "ブダペスト" <utf8_string> "pt-BR": "Budapeste" <utf8_string> "ru": "" <utf8_string> "zh-CN": "布达佩斯" <utf8_string> } } [...] "location": { "accuracy_radius": 100 <uint16> "latitude": 47.500000 <double> "longitude": 19.083300 <double> "time_zone": "Europe/Budapest" <utf8_string> } [...]
わかった さらに進みます。
syslog-ngを/ etc / syslog-ngにインストールしたディレクトリへのシンボリックリンクを作成しましょう-これは、syslog-ng configsの標準の場所に慣れている人にとってより便利です。
ln -s /usr/local/etc /etc/syslog-ng
メインの設定を編集しましょう-このフォームにそれをもたらします:
nano /usr/local/etc/syslog-ng.conf
@version: 3.13 @include "scl.conf" @module mod-java # options { sync (5000); time_reopen (10); time_reap(5); long_hostnames (off); use_dns (no); use_fqdn (no); create_dirs (no); keep_hostname (yes); log_fifo_size (536870912); stats_freq(60); flush_lines(500); flush_timeout(10000); bad_hostname("^gconfd$"); }; @include "/usr/local/etc/conf.d/*.conf"
便宜上、すべての構成を含めるディレクトリを作成します。
mkdir -p /usr/local/etc/conf.d
次に、他のマシンからシステムログを受信し、インデックスによるパーティション化を使用してelasticsearchに送信するための設定を挿入します。
nano /usr/local/etc/conf.d/input.conf
### udp 514 source udp-remote-system-logs { udp(port(514) log_iw_size(1000) log_fetch_limit(1000000));}; ######################## # ######################## filter f_dbg { level(debug); }; filter f_info { level(info); }; filter f_notice { level(notice); }; filter f_warn { level(warn); }; filter f_err { level(err); }; filter f_crit { level(crit .. emerg); }; filter f_debug { level(debug) and not facility(auth, authpriv, news, mail); }; filter f_error { level(err .. emerg) ; }; filter f_messages { level(info,notice,warn) and not facility(auth,authpriv,cron,daemon,mail,news); }; filter f_auth { facility(auth, authpriv) and not filter(f_debug); }; filter f_cron { facility(cron) and not filter(f_debug); }; filter f_daemon { facility(daemon) and not filter(f_debug); }; filter f_kern { facility(kern) and not filter(f_debug); }; filter f_lpr { facility(lpr) and not filter(f_debug); }; filter f_local { facility(local0, local1, local3, local4, local5, local6, local7) and not filter(f_debug); }; filter f_mail { facility(mail) and not filter(f_debug); }; filter f_news { facility(news) and not filter(f_debug); }; filter f_syslog3 { not facility(auth, authpriv, mail) and not filter(f_debug); }; filter f_user { facility(user) and not filter(f_debug); }; filter f_uucp { facility(uucp) and not filter(f_debug); }; filter f_cnews { level(notice, err, crit) and facility(news); }; filter f_cother { level(debug, info, notice, warn) or facility(daemon, mail); }; filter f_ppp { facility(local2) and not filter(f_debug); }; filter f_console { level(warn .. emerg); }; ### - elasticsearch ### , ######################## # auth logs ######################## destination d_elastic_auth { elasticsearch2( index("auth-${YEAR}.${MONTH}.${DAY}") type("test") time-zone("UTC") client_mode("http") flush-limit("10000") cluster_url("http://elasticnode1:9200") custom_id("${UNIQID}") template("$(format_json --scope nv_pairs --key ISODATE @timestamp=${ISODATE})") ); }; log { source(udp-remote-system-logs);filter(f_auth); destination(d_elastic_auth); }; ######################## # crons logs ######################## destination d_elastic_crons { elasticsearch2( index("crons-${YEAR}.${MONTH}.${DAY}") type("test") time-zone("UTC") client_mode("http") flush-limit("10000") cluster_url("http://elasticnode1:9200") custom_id("${UNIQID}") template("$(format_json --scope nv_pairs --key ISODATE @timestamp=${ISODATE})") ); }; log { source(udp-remote-system-logs); filter(f_cron); destination(d_elastic_crons); }; ######################## # kern logs ######################## destination d_elastic_kern { elasticsearch2( index("kern-${YEAR}.${MONTH}.${DAY}") type("test") time-zone("UTC") client_mode("http") flush-limit("10000") cluster_url("http://elasticnode1:9200") custom_id("${UNIQID}") template("$(format_json --scope nv_pairs --key ISODATE @timestamp=${ISODATE})") ); }; log { source(udp-remote-system-logs ); filter(f_kern); destination(d_elastic_kern); }; ######################## # daemon logs ######################## destination d_elastic_daemon { elasticsearch2( index("daemon-${YEAR}.${MONTH}.${DAY}") type("test") time-zone("UTC") client_mode("http") flush-limit("10000") cluster_url("http://elasticnode1:9200") custom_id("${UNIQID}") template("$(format_json --scope nv_pairs --key ISODATE @timestamp=${ISODATE})") ); }; log { source(udp-remote-system-logs); filter(f_daemon); destination(d_elastic_daemon); }; ######################## # user logs ######################## destination d_elastic_user { elasticsearch2( index("user-${YEAR}.${MONTH}.${DAY}") type("test") time-zone("UTC") client_mode("http") flush-limit("10000") cluster_url("http://elasticnode1:9200") custom_id("${UNIQID}") template("$(format_json --scope nv_pairs --key ISODATE @timestamp=${ISODATE})") ); }; log { source(udp-remote-system-logs); filter(f_user); destination(d_elastic_user); }; ######################## # lpr logs ######################## destination d_elastic_lpr { elasticsearch2( index("lpr-${YEAR}.${MONTH}.${DAY}") type("test") time-zone("UTC") client_mode("http") flush-limit("10000") cluster_url("http://elasticnode1:9200") custom_id("${UNIQID}") template("$(format_json --scope nv_pairs --key ISODATE @timestamp=${ISODATE})") ); }; log { source(udp-remote-system-logs); filter(f_lpr); destination(d_elastic_lpr); }; ######################## # syslog logs ######################## destination d_elastic_syslog { elasticsearch2( index("syslog-${YEAR}.${MONTH}.${DAY}") type("test") time-zone("UTC") client_mode("http") flush-limit("10000") cluster_url("http://elasticnode1:9200") custom_id("${UNIQID}") template("$(format_json --scope nv_pairs --key ISODATE @timestamp=${ISODATE})") ); }; log { source(udp-remote-system-logs); filter(f_syslog3);destination(d_elastic_syslog); }; ######################## # uucp logs ######################## destination d_elastic_uucp { elasticsearch2( index("uucp-${YEAR}.${MONTH}.${DAY}") type("test") time-zone("UTC") client_mode("http") flush-limit("10000") cluster_url("http://elasticnode1:9200") custom_id("${UNIQID}") template("$(format_json --scope nv_pairs --key ISODATE @timestamp=${ISODATE})") ); }; log { source(udp-remote-system-logs); filter(f_uucp); destination(d_elastic_uucp); }; ######################## # mail logs ######################## destination d_elastic_mail { elasticsearch2( index("mail-${YEAR}.${MONTH}.${DAY}") type("test") time-zone("UTC") client_mode("http") flush-limit("10000") cluster_url("http://elasticnode1:9200") custom_id("${UNIQID}") template("$(format_json --scope nv_pairs --key ISODATE @timestamp=${ISODATE})") ); }; log { source(udp-remote-system-logs); filter(f_mail);destination(d_elastic_mail); }; ######################## # messages logs ######################## destination d_elastic_messages { elasticsearch2( index("messages-${YEAR}.${MONTH}.${DAY}") type("test") time-zone("UTC") client_mode("http") flush-limit("10000") cluster_url("http://elasticnode1:9200") custom_id("${UNIQID}") template("$(format_json --scope nv_pairs --key ISODATE @timestamp=${ISODATE})") ); }; log { source(udp-remote-system-logs); filter(f_messages); destination(d_elastic_messages); }; ######################## # debug logs ######################## destination d_elastic_debug { elasticsearch2( index("debug-${YEAR}.${MONTH}.${DAY}") type("test") time-zone("UTC") client_mode("http") flush-limit("10000") cluster_url("http://elasticnode1:9200") custom_id("${UNIQID}") template("$(format_json --scope nv_pairs --key ISODATE @timestamp=${ISODATE})") ); }; log { source(udp-remote-system-logs); filter(f_debug); destination(d_elastic_debug); }; ######################## # error logs ######################## destination d_elastic_error { elasticsearch2( index("error-${YEAR}.${MONTH}.${DAY}") type("test") time-zone("UTC") client_mode("http") flush-limit("10000") cluster_url("http://elasticnode1:9200") custom_id("${UNIQID}") template("$(format_json --scope nv_pairs --key ISODATE @timestamp=${ISODATE})") ); }; log { source(udp-remote-system-logs); filter(f_error);destination(d_elastic_error); }; ######################## # info logs ######################## destination d_elastic_info { elasticsearch2( index("info-${YEAR}.${MONTH}.${DAY}") type("test") time-zone("UTC") client_mode("http") flush-limit("10000") cluster_url("http://elasticnode1:9200") custom_id("${UNIQID}") template("$(format_json --scope nv_pairs --key ISODATE @timestamp=${ISODATE})") ); }; log { source(udp-remote-system-logs); filter(f_info); destination(d_elastic_info); };
syslog-ng . .
— nginx access error(php errors error.log), nodejs.
nano /usr/local/etc/conf.d/input-web.conf
# nginx, , , "|" #log_format full_format '"$time_iso8601"|"$http_host"|"$remote_addr"|"$http_x_forwarded_for"|"$request_method"|"$request"|"$status"|"$body_bytes_sent"|"$http_referer"|"$request_time"|"$upstream_http_x_cache"|"$uri"|"$upstream_addr"|"$host"|"$upstream_response_length"|"$upstream_status"|"$server_name"|"$http_host"|"$upstream_response_time"|"$upstream_cache_status"|"$http_user_agent"|"$scheme://$host$request_uri"|"$cookie_bar"'; #access_log /var/log/nginx/access.log full_format; #error_log /var/log/nginx/error.log; # nginx + libressl + syslog-ng + nodejs - https://github.com/galushkoav/nginx-php-nodejs ## nginx access 25230 udp source udp-nginx-acessfull { udp(port(25230) log_iw_size(1000) log_fetch_limit(1000000)) ; }; ## nginx access 25230 tcp, - source tcp-nginx-acessfull { tcp(port(25230) so_rcvbuf(67108864) log_iw_size(100000) log_fetch_limit(1000000) max-connections(200)); }; ### nginx, , , "|" parser p-nginx-acessfull-mapped { csv-parser(columns("nginx.time","nginx.host", "nginx.http_host", "nginx.remote_addr", "nginx.http_x_forwarded_for", "nginx.request_method", "nginx.request","nginx.status", "nginx.upstream_status","nginx.body_bytes_sent", "nginx.http_referer", "nginx.request_time","nginx.upstream_response_time", "nginx.upstream_http_x_cache", "nginx.uri", "nginx.upstream_addr", "nginx.upstream_response_length", "nginx.server_name","nginx.upstream_cache_status", "nginx.user_agent","nginx.request_uri","nginx.cookie_bar" ) flags(escape-double-char,strip-whitespace) delimiters("|") quote-pairs('""[]') ); }; ### ip nginx - "nginx.remote_addr" maxmidn geoip2 parser p_geoip2 { geoip2( "${nginx.remote_addr}", prefix( "geoip2." ) database( "/usr/local/etc/GEO/GeoLite2-City_20171205/GeoLite2-City.mmdb" ) ); }; ##Rewrite , , Elasticsearch. , GeoIP, . rewrite r_geoip2 { set( "${geoip2.location.latitude},${geoip2.location.longitude}", value( "geoip2.location2" ), condition(not "${geoip2.location.latitude}" == "") ); }; ### nginx_access elasticsearch - nginx-access-geo-* destination d_elastic-nginx-acessfull { elasticsearch2( index("nginx-access-geo-${YEAR}.${MONTH}.${DAY}") type("_doc") client_mode("http") flush-limit("100") cluster_url("http://elasticnode1:9200") custom_id("${UNIQID}") template("$(format-json --scope rfc5424 --scope nv-pairs --exclude DATE --key ISODATE)") persist-name(elasticsearch-nginx) ); }; log {source (udp-nginx-acessfull); parser(p-nginx-acessfull-mapped); rewrite(r_geoip2); parser(p_geoip2); destination(d_elastic-nginx-acessfull);}; ## nginx error 25231 udp source udp-nginx-error { udp(port(25231) log_iw_size(1000) log_fetch_limit(1000000)); }; destination d_elastic-nginxerror { elasticsearch2( index("nginxerror-${YEAR}.${MONTH}.${DAY}") type("test") time-zone("UTC") client_mode("http") flush-limit("10000") cluster_url("http://elasticnode1:9200") custom_id("${UNIQID}") template("$(format_json --scope nv_pairs --key ISODATE @timestamp=${ISODATE})") ); }; ########### - unlink filter f_tail_nginx_error_unlink {not match ("unlink") ;}; log {source(udp-nginx-error); filter(f_tail_nginx_error_unlink); destination(d_elastic-nginxerror); };
.
, index elasticsearch — "-.", nginx-access-geo-2018.01. , — nginx-access-geo-${YEAR}.${MONTH}.${DAY}.
elasticsearch nginx access — mapping nginx-access-geo-2018.01:
- nginx.upstream_response_time nginx.request_time float string, upstreams;
- mapping elasticsearch geoip, .
重要です。 nginx-access-geo-* .
elasticsearch.
curl -XPUT "http://127.0.0.1:9200/_template/nginxaccess_per_index" -d \ ' { "template" : "nginx-access-geo-*", "mappings" : { "_default_" : { "properties" : { "nginx" : { "properties" : { "request_time": {"type": "integer","ignore_malformed": true}, "upstream_response_time": {"type": "integer","ignore_malformed": true}, "remote_addr": {"type": "ip"}, "status": {"type": "integer","ignore_malformed": true}, "body_bytes_sent": {"type": "integer","ignore_malformed": true}, "upstream_response_length": {"type": "integer","ignore_malformed": true}, "request_uri": {"type": "text","fields": {"keyword": {"type": "keyword"} } } } }, "geoip2" : { "properties" : { "location2" : {"type" : "geo_point"} } } } } } } } '
Mapping elasticsearch6
curl -H "Content-Type: application/json" -XPUT "http://127.0.0.1:9200/_template/nginxaccess_per_index" -d \ ' { "template" : "nginx-access-geo-*", "mappings" : { "_default_" : { "properties" : { "nginx" : { "properties" : { "request_time": {"type": "integer","ignore_malformed": true}, "upstream_response_time": {"type": "integer","ignore_malformed": true}, "remote_addr": {"type": "ip"}, "status": {"type": "integer","ignore_malformed": true}, "body_bytes_sent": {"type": "integer","ignore_malformed": true}, "upstream_response_length": {"type": "integer","ignore_malformed": true}, "request_uri": {"type": "text","fields": {"keyword": {"type": "keyword"} } } } }, "geoip2" : { "properties" : { "location2" : {"type" : "geo_point"} } } } } } } } ' . . ```bash curl -X GET 'http://elasticnode1:9200/nginx-access-geo-2018.01'
.
syslog-ng,
syslog-ng -Fvde
—
/etc/init.d/syslog-ng start
— elasticsearch .
elasticsearch " -*" , , :
curl 'http://elasticnode1:9200/_cat/indices?v' | awk '{ print $3 }' | sed -e '1d' | cut -d"-" -f1 | awk '{print $0"-*"}'
おわりに
root@human-K73SM:/etc/systemd/system# curl 'http://elasticnode1:9200/_cat/indices?v' | awk '{ print $3 }' | sed -e '1d' | cut -d"-" -f1 | awk '{print $0"-*"}' % Total % Received % Xferd Average Speed Time Time Time Current Dload Upload Total Spent Left Speed 100 3000 100 3000 0 0 11749 0 --:--:-- --:--:-- --:--:-- 11764 nginxerror-* mail-* nginxerror-* kern-* messages-* nginxerror-* nginx-* syslog-* .kibana-* error-* nginxerror-* nginx-* nginxerror-* nodejs-* syslog-* elastalert_status-* debug-* crons-* user-* auth-* daemon-* nginxerror-* info-* auth-*
, .kibana, elasticalert.
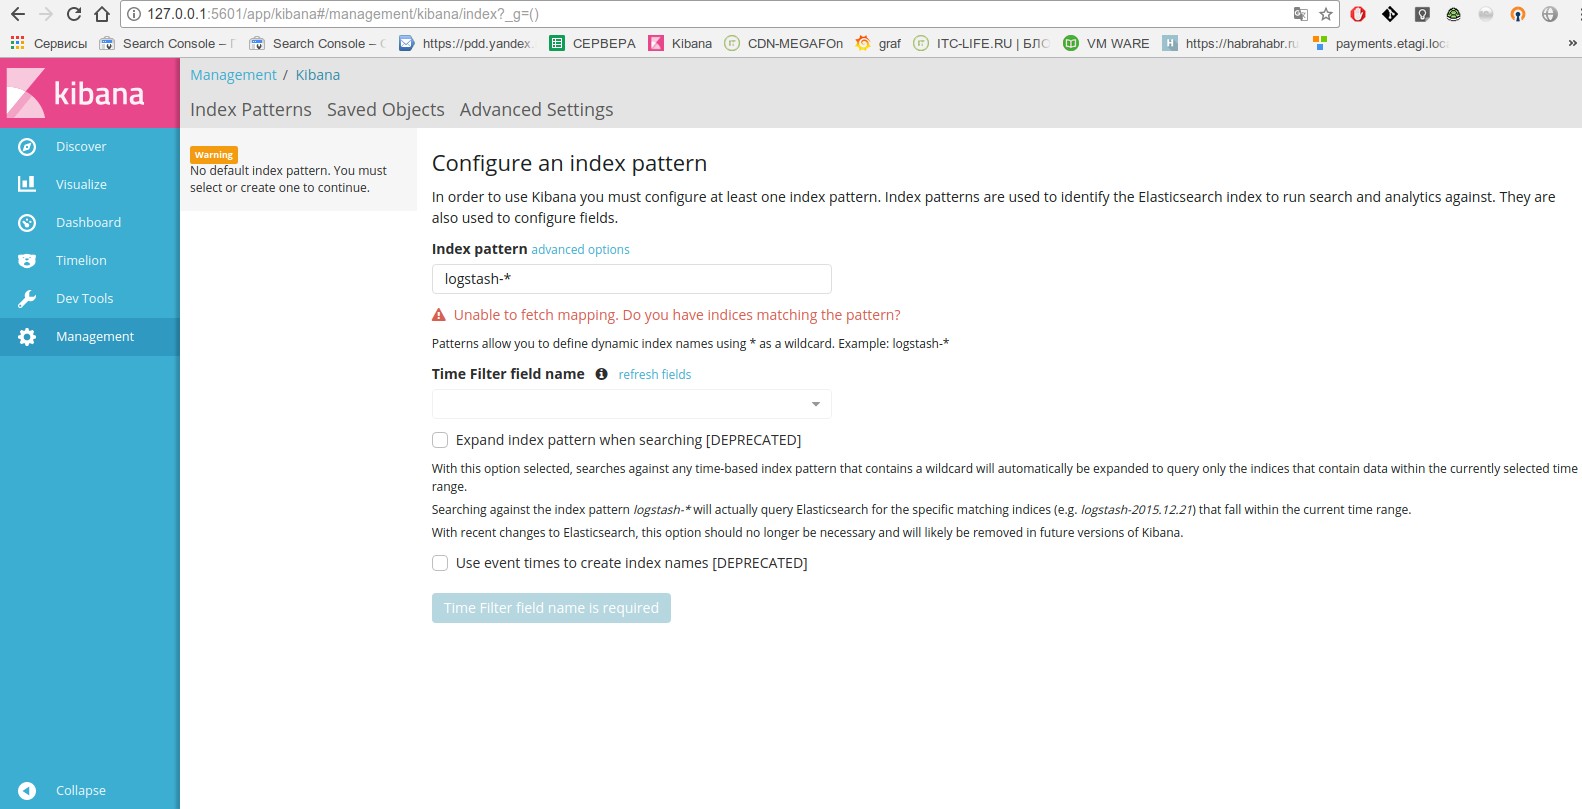
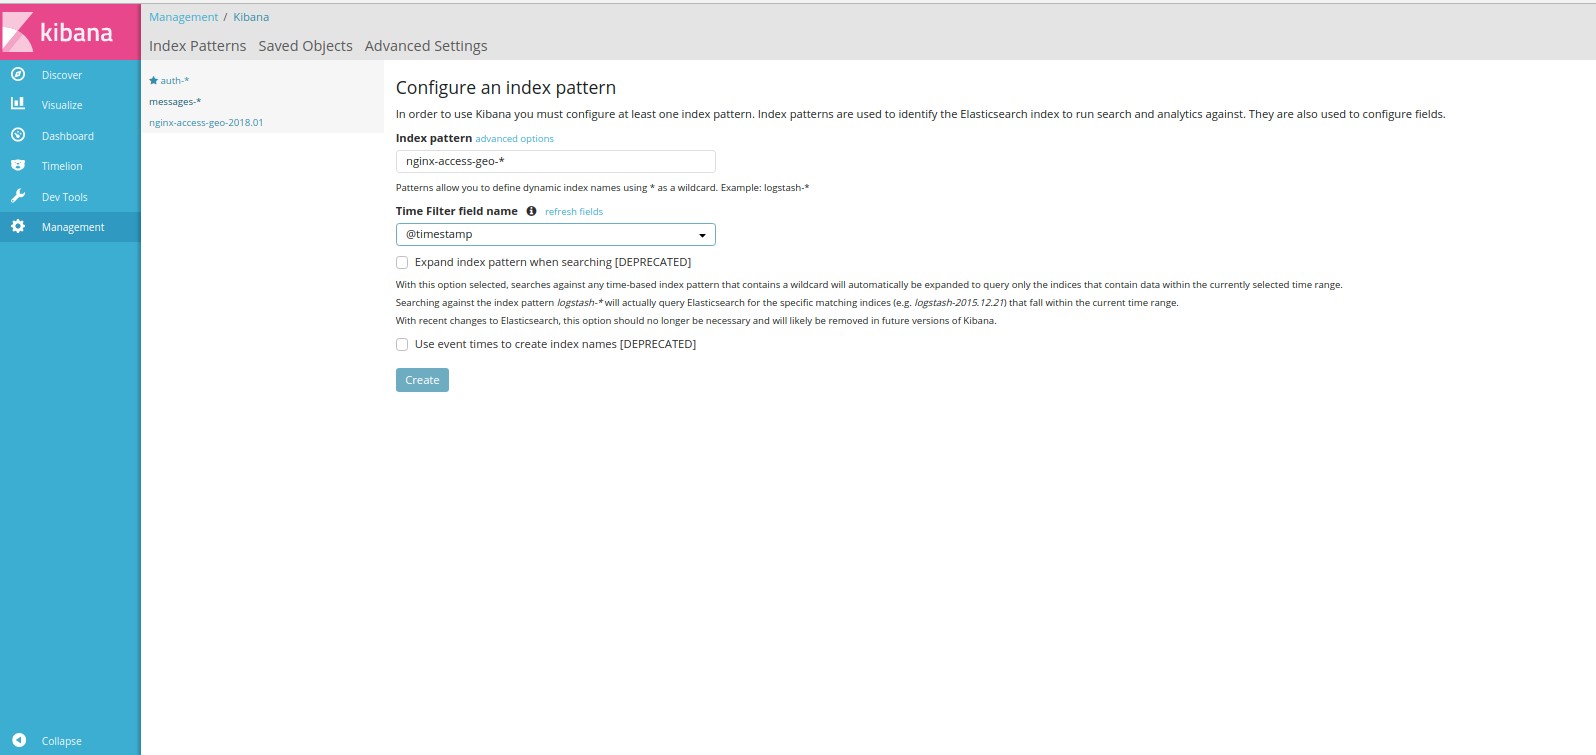
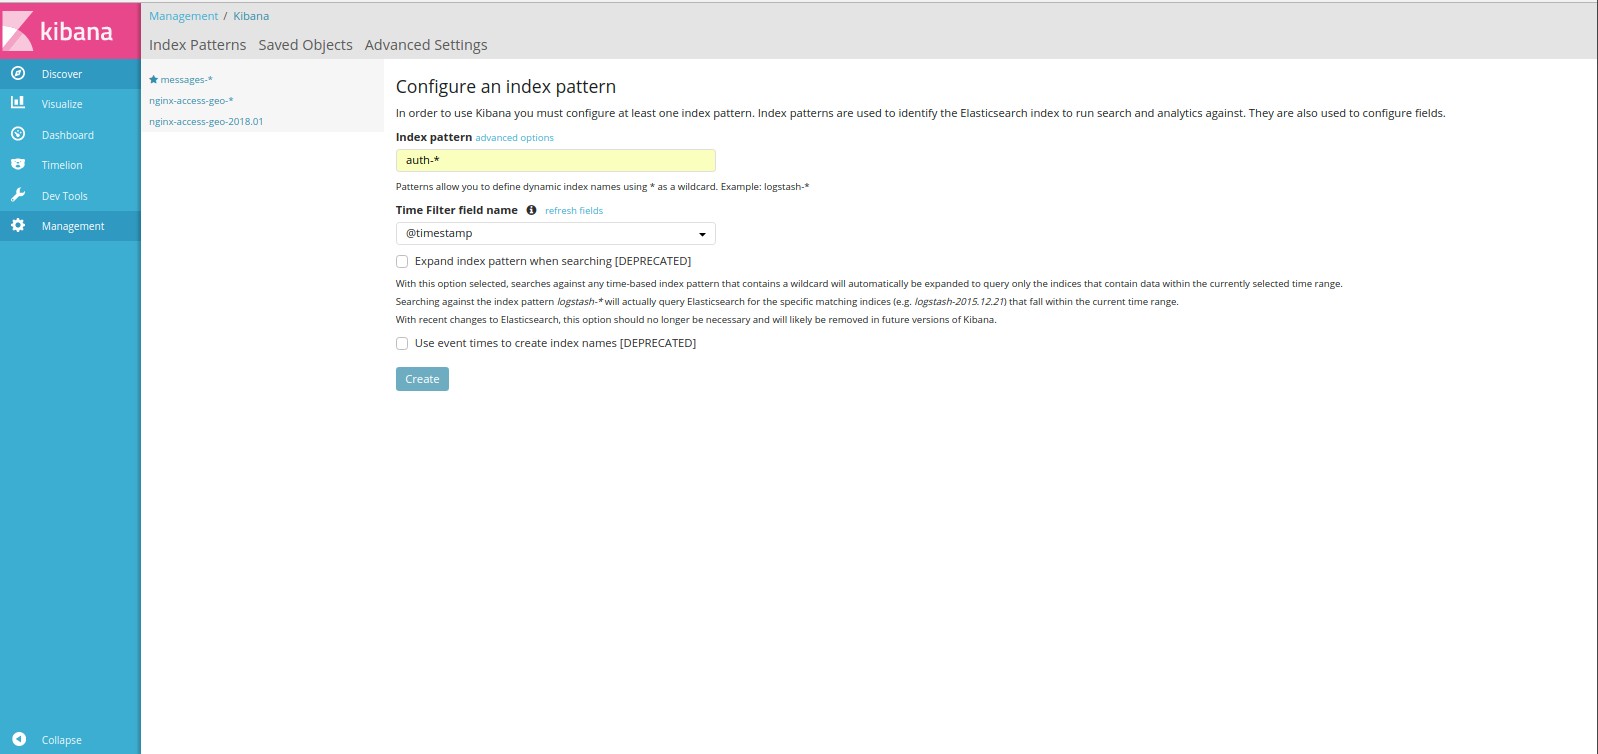
kibana , . elasticsearch 5.6.3 :
curl -XPOST "http://elasticnode1:9200/.kibana/index-pattern/kern-*" -H 'Content- Type: application/json' -d' { "title" : "kern-*", "timeFieldName" : "ISODATE" }'
6-
curl -XPOST "http://127.0.0.1:9200/.kibana/doc/index-pattern:auth-*" -H "Content-Type: application/json" -d \ ' { "type" : "index-pattern", "index-pattern" : { "title": "auth-*", "timeFieldName": "@timestamp" } }'
kern, wildcard, .. .
pm2 c syslog-ng.
Pm2 .
--merge-logs --log-type=json --log-date-format="YYYY-MM-DD HH:mm Z"
. .
#### nodejs destination d_server_pm2logs { udp("elasticnode1" port(25216)); }; source s_tail_pm2 { file( "/root/.pm2/logs/server-error.log" follow_freq(1) flags(no-parse) ); }; ### - . log {source(s_tail_pm2); destination(d_server_pm2logs);}
elasticsearch.
## nodejs source remote_log_host_nodejs { udp(port(25216) log_iw_size(1000) log_fetch_limit(1000000) flags(no-parse)); }; ### nodejs elasticsearch destination d_elastic_pm2logs { elasticsearch2( #client-lib-dir("/usr/share/elasticsearch/lib/") index("pm2logs-${YEAR}.${MONTH}.${DAY}") type("test") time-zone("UTC") client_mode("http") flush-limit("10000") cluster_url("http://elasticnode1:9200") custom_id("${UNIQID}") template("$(format_json --scope nv_pairs --key ISODATE @timestamp=${ISODATE})") ); }; log { source(remote_log_host_nodejs); destination(d_elastic_pm2logs); };
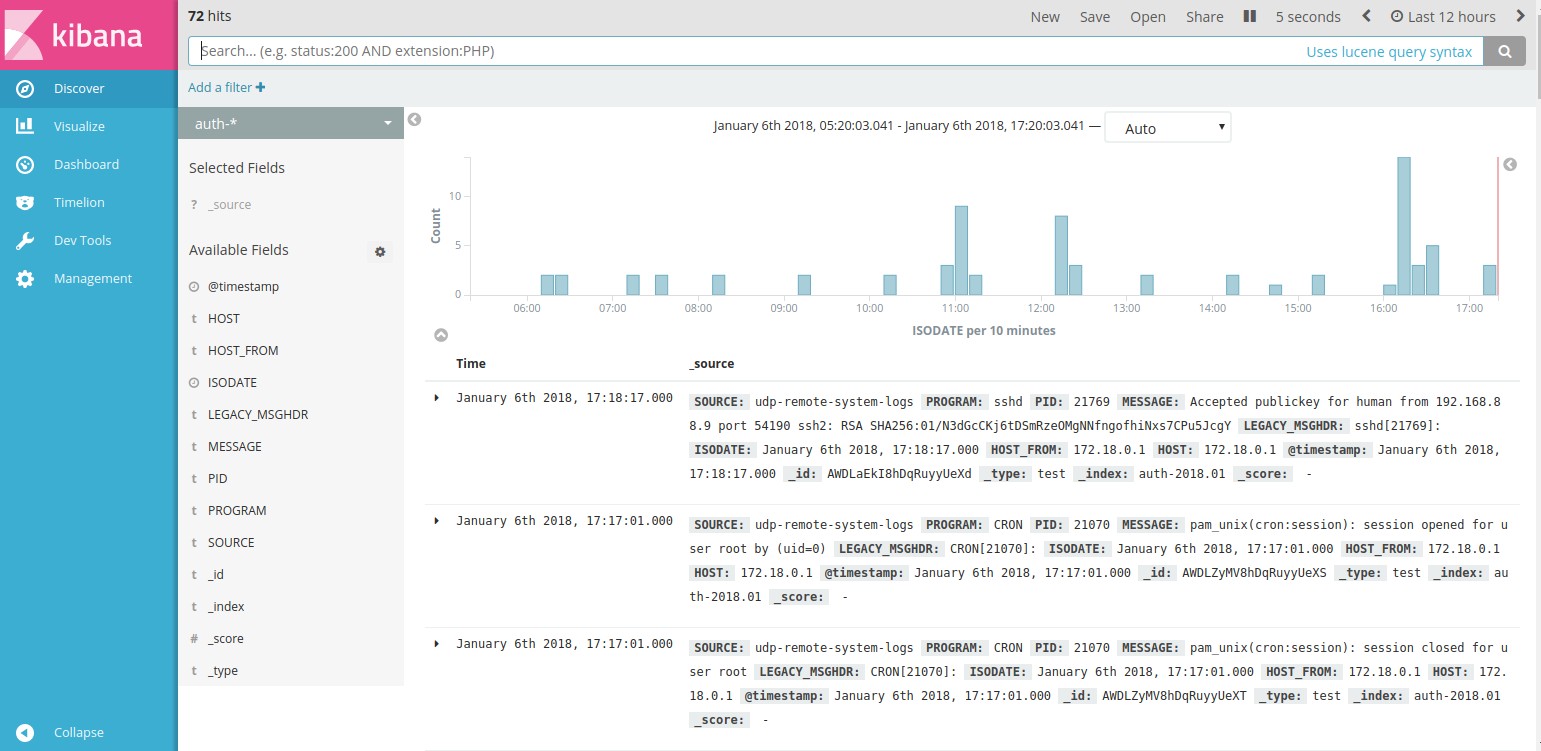
syslog-ng kibana.
syslog-ng .
kibana .
nginx, c 2 , nginx.request_time: [2 TO *].
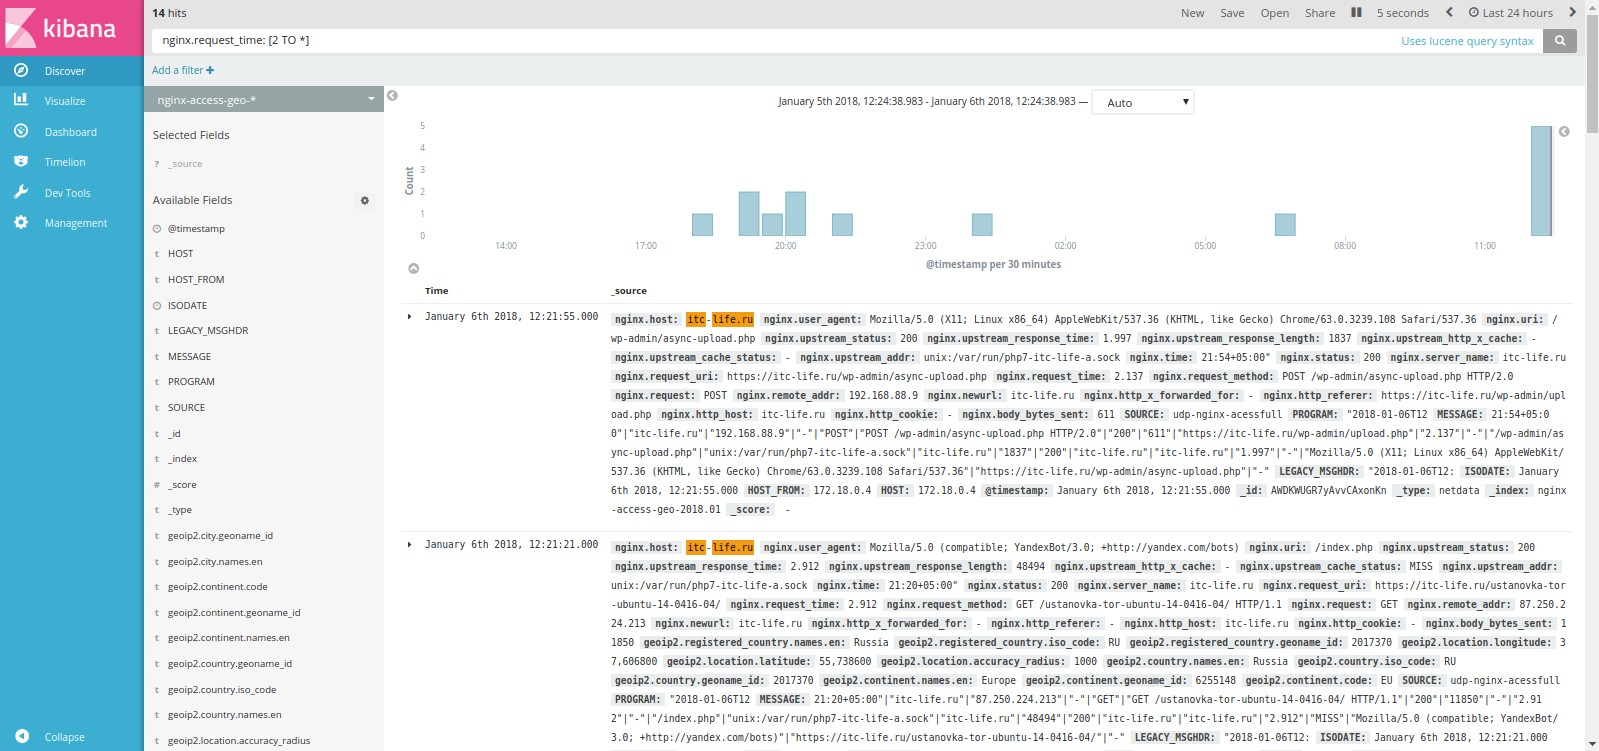
. 24 30 .
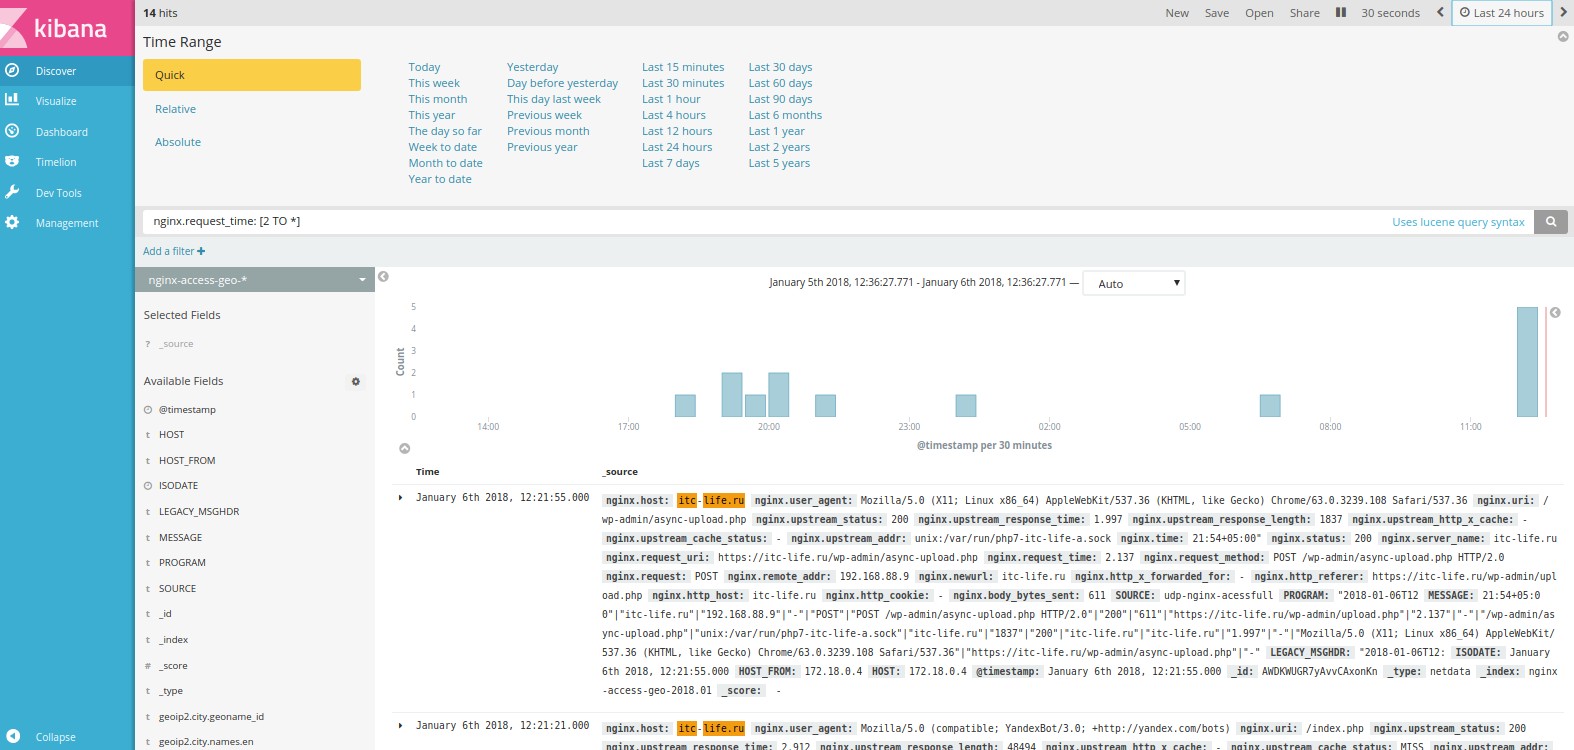
14 (hits).
. json .
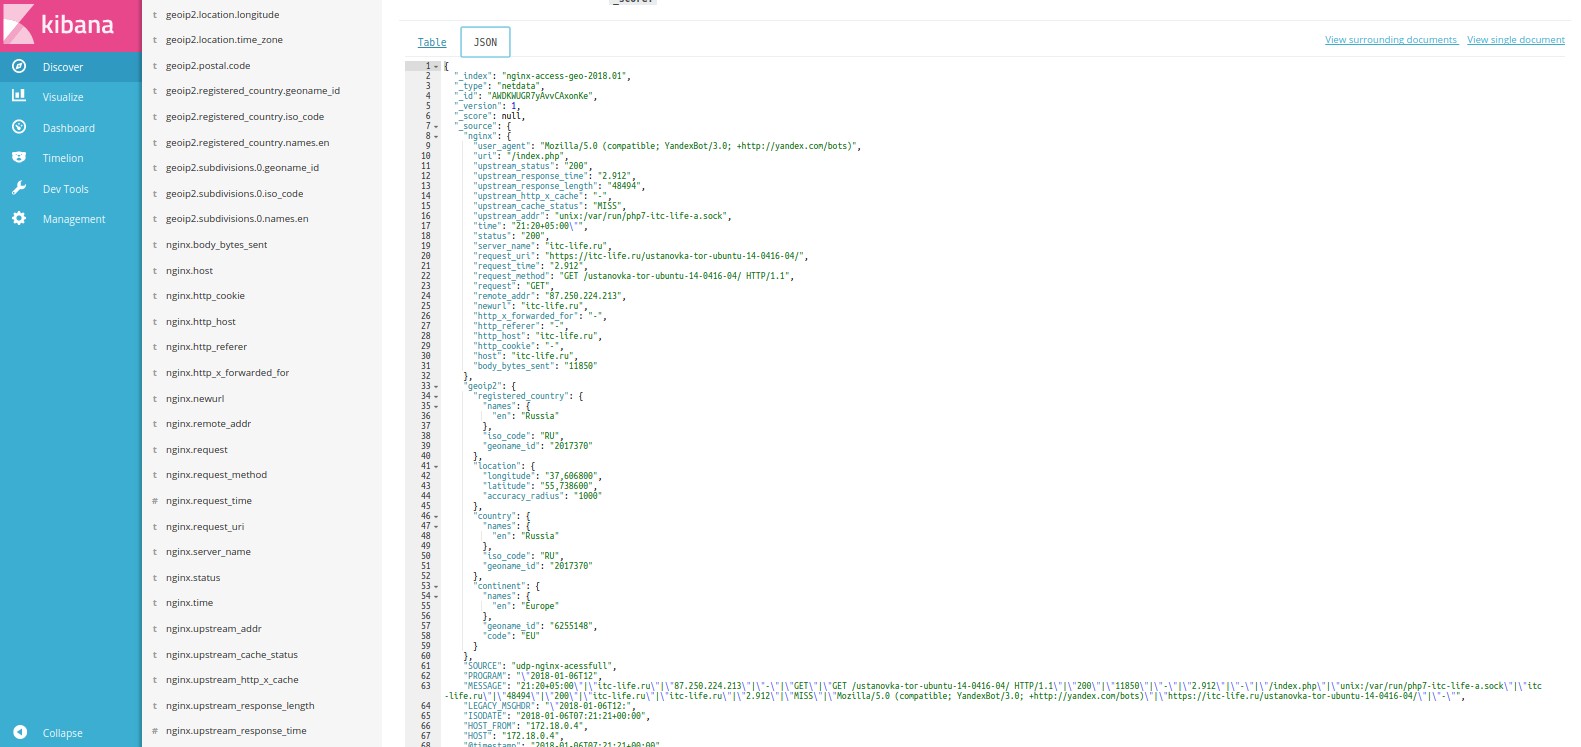
, ( ). :
curl 'http://elasticnode1:9200/_cat/indices?v'
:
health status index uuid pri rep docs.count docs.deleted store.size pri.store.size yellow open nginxerror-2018.01.03 jQVq1YWrSayxJ-zAeOeNKA 5 1 24 0 165.1kb 165.1kb yellow open nginxerror-2018.01.05 dJ0D2ronQWiGcCjj_jVNHg 5 1 96 0 183.9kb 183.9kb yellow open kern-2018.01 URAOk3_GRX6MMZfW8hLPbA 5 1 4196 0 1.5mb 1.5mb yellow open messages-2018.01 DiU8IEV2RseZ2mQNx2CJxA 5 1 4332 0 1.5mb 1.5mb yellow open syslog-2018.01 de2SOs8KRBGNkfd1ja4Mmg 5 1 38783 0 26.1mb 26.1mb yellow open .kibana jLUuELr-TRGSVr5JzPX52w 1 1 5 0 44.6kb 44.6kb yellow open error-2018.01 cnD8VeGkQa2n8HRTnC74SQ 5 1 671 0 438.6kb 438.6kb yellow open nginxerror-2018.01.06 z1eT1JC1QLC0AqyIQoj9ng 5 1 47 0 214.6kb 214.6kb yellow open nginx-access-geo 41WmT6BARUiQNjuahFhe1g 5 1 8583 0 14mb 14mb yellow open syslog-ng hE37Hu2JRd-lyJaq7nDh-A 5 1 52 0 197.2kb 197.2kb yellow open nginx-access-geo-2018.01 MfinD9z7SB-vIMRZcXJevw 5 1 2676 0 6mb 6mb yellow open debug-2018.01 SwxEA6sSQjGSMBm6FcyAww 5 1 507 0 362.3kb 362.3kb yellow open crons-2018.01 MOJetHGjQs-Gd3Vmg5kxHw 5 1 111 0 149.7kb 149.7kb yellow open user-2018.01 zbRxNpGsShWwz43LXjPaAw 5 1 571 0 392kb 392kb yellow open auth-2018.01 shHvBE8GSdCi2CIjTxNovg 5 1 468 0 370.8kb 370.8kb yellow open daemon-2018.01 p97FQLBHTbyy-sM23oJpWQ 5 1 33754 0 25.1mb 25.1mb yellow open nginxerror-2018.01.04 dJ-bnpNIQ328iudAVTg43A 5 1 109 0 170.5kb 170.5kb yellow open info-2018.01 bQp1i6YwQoGOvv1aJCjudA 5 1 36267 0 26.7mb 26.7mb
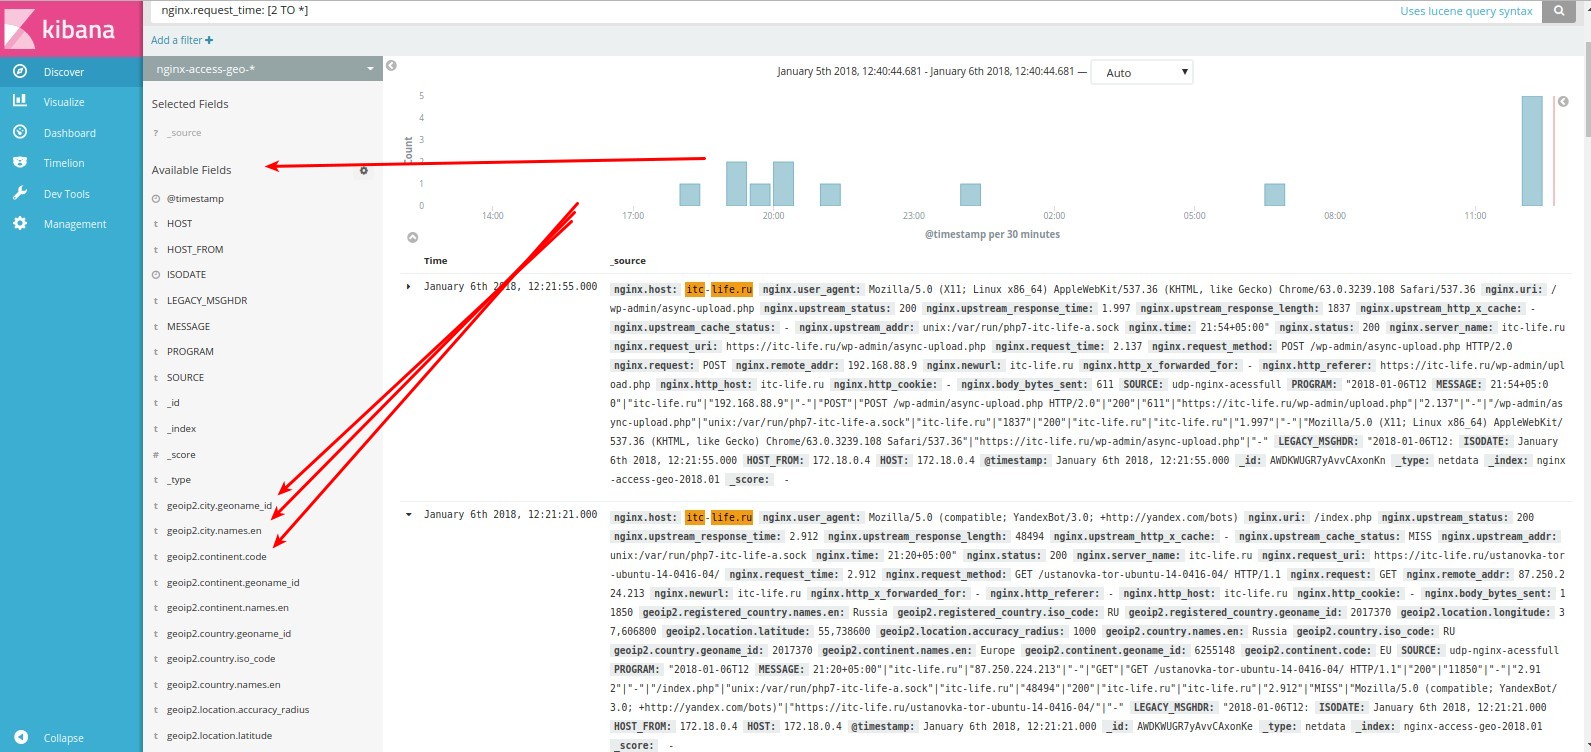
auth-*, , sudo .
, .
.
kibana .
kibana nginx, .
visualize >> new >> line index nginx-access-geo-*
:
- "Metrics" — Y-Axis "Aggregation" >> "Average" "Field" >> "nginx.request_time";
- "Buckets" — X-Axis Aggregation >> Date Histogram Field >> timestamp ;
- "Split series" "Sub Aggregation" >> "Terms" "Field" >> "nginx.http_host.keyword" "Order by ">> "metric: Average nginx.request_time".
"Apply Changes"
.
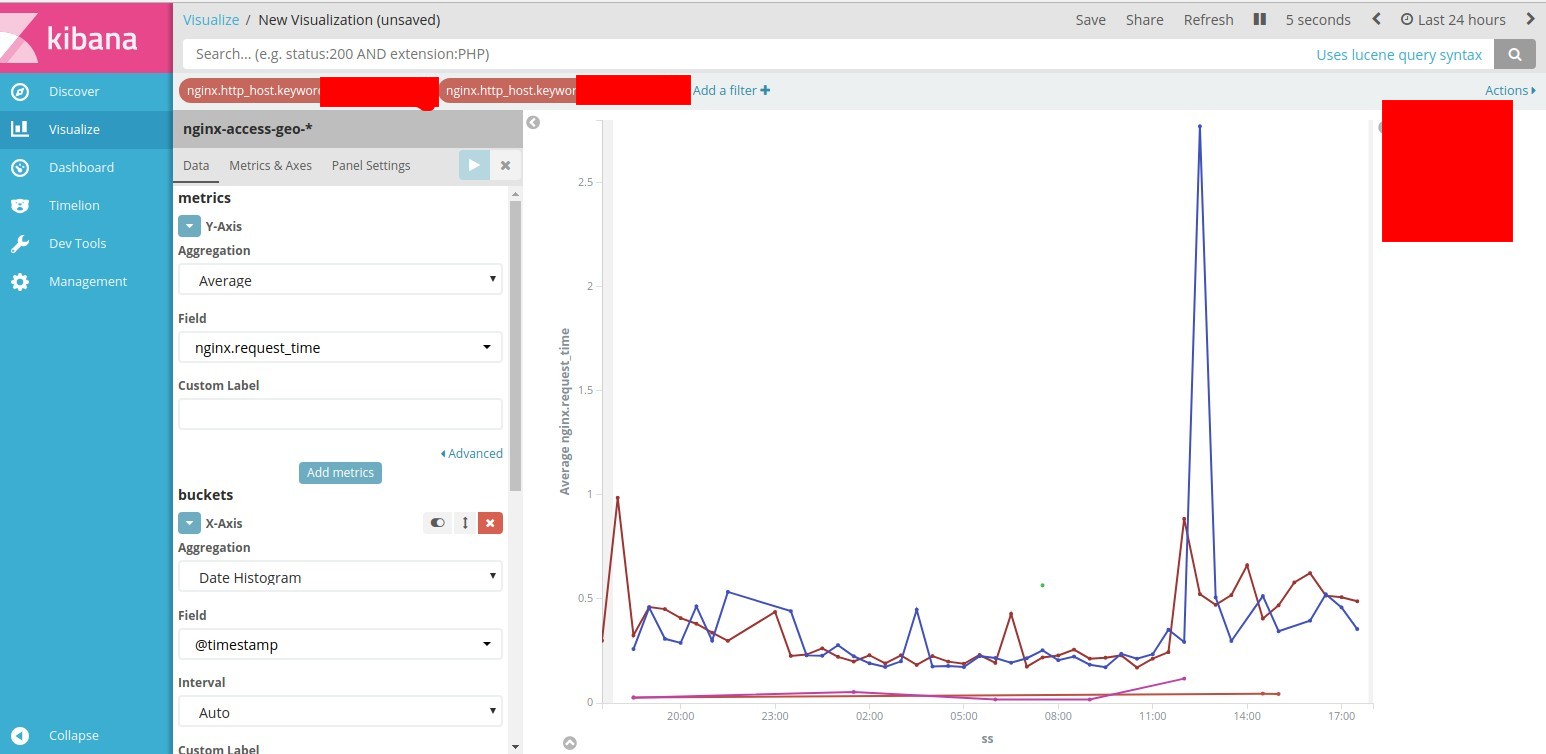
. .
elasticalert .
elasticalert, .
pip install elastalert pip install "elasticsearch>=5.0.0" mkdir -p /etc/elasticalert
nano /etc/elasticalert/config.yaml
#elastalert-create-index # This is the folder that contains the rule yaml files # Any .yaml file will be loaded as a rule rules_folder: rules # How often ElastAlert will query Elasticsearch # The unit can be anything from weeks to seconds run_every: minutes: 1 # ElastAlert will buffer results from the most recent # period of time, in case some log sources are not in real time buffer_time: minutes: 15 # The Elasticsearch hostname for metadata writeback # Note that every rule can have its own Elasticsearch host es_host: elasticnode1 # The Elasticsearch port es_port: 9200 # The AWS region to use. Set this when using AWS-managed elasticsearch #aws_region: us-east-1 # The AWS profile to use. Use this if you are using an aws-cli profile. # See http://docs.aws.amazon.com/cli/latest/userguide/cli-chap-getting-started.html # for details #profile: test # Optional URL prefix for Elasticsearch #es_url_prefix: elasticsearch # Connect with TLS to Elasticsearch #use_ssl: True timestamp_field: "@timestamp" #timestamp_field: timestamp # Verify TLS certificates #verify_certs: True # GET request with body is the default option for Elasticsearch. # If it fails for some reason, you can pass 'GET', 'POST' or 'source'. # See http://elasticsearch-py.readthedocs.io/en/master/connection.html?highlight=send_get_body_as#transport # for details #es_send_get_body_as: GET # Option basic-auth username and password for Elasticsearch #es_username: someusername #es_password: somepassword # Use SSL authentication with client certificates client_cert must be # a pem file containing both cert and key for client #verify_certs: True #ca_certs: /path/to/cacert.pem #client_cert: /path/to/client_cert.pem #client_key: /path/to/client_key.key # The index on es_host which is used for metadata storage # This can be a unmapped index, but it is recommended that you run # elastalert-create-index to set a mapping writeback_index: elastalert_status # If an alert fails for some reason, ElastAlert will retry # sending the alert until this time period has elapsed alert_time_limit: days: 2 telegram_bot_token: ___
elastalert-create-index, .
elastalert-create-index
mkdir -p /etc/elastalert/rules
nano /etc/elastalert/rules/example_frequency.yaml
name: status_502 # Type of alert. type: frequency # Index to search, wildcard supported index: nginx-access-geo-* # Alert when this many documents matching the query occur within a timeframe num_events: 20 # num_events must occur within this amount of time to trigger an alert timeframe: minutes: 2 # (Required) # A list of Elasticsearch filters used for find events # These filters are joined with AND and nested in a filtered query # For more info: http://www.elasticsearch.org/guide/en/elasticsearch/reference/current/query-dsl.html timestamp_field: ISODATE filter: #- term: # status: "200" - query: query_string: query: "HOST_FROM: \"10.12.1.39\" AND nginx.status: 502 AND nginx.request_method: GET" #realert which is the minimum time between two alerts for the same rule. realert: minutes: 0 #You can also prevent duplicates based on a certain field by using query_key. #realert: #hours: 8 #query_key: user # The alert is use when a match is found alert: - "telegram" telegram_room_id: "__id"
nginx-access-geo-*, nginx.status 502 10.12.1.39 GET 20 2 .
やってみます。
elasticalert
cd /etc/elastalert/ && python -m elastalert.elastalert --verbose
502 :
INFO:elastalert:Ran status_502 from 2018-01-06 20:26 Asia to 2018-01-06 20:29 Asia: 22 query hits (10 already seen), 1 matches, 1 alerts sent INFO:elastalert:Sleeping for 58.142215 seconds
.
name: Hight-response-time-site-check type: metric_aggregation index: nginxaccessgeoip2-* timestamp_field: ISODATE doc_type: nginxaccess max_threshold: 20 run_every: minutes: 1 buffer_time: minutes: 1 aggregation: minutes: 1 bucket_interval: minutes: 1 metric_agg_key: nginx.upstream_response_time metric_agg_type: avg filter: - query: query_string: query: "HOST_FROM: \"10.9.3.6\" AND nginx.http_host: \"itc-life.ru\" AND nginx.status: 200 AND nginx.request_method: GET" #filter: #- term: #truncated: true ### max_threshold: 0.2 ### alert: - "email" - "telegram" email: - "_" telegram_room_id: "-__"
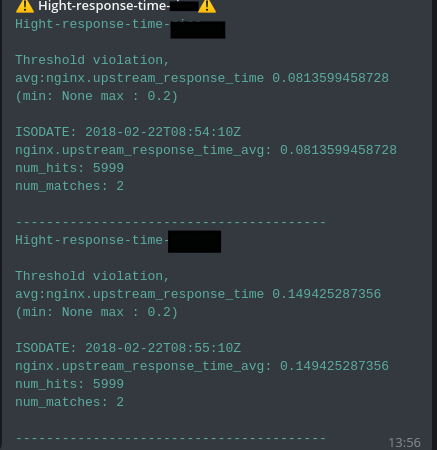
すべてが機能します。
elasticalert :
https://github.com/Yelp/elastalert
.
— docker-compose
https://github.com/galushkoav/ESKG
elasticsearch.
elasticsearch
curl 'http://elasticnode1:9200/_cat/indices?v'
elasticsearch
curl -X DELETE 'http://elasticnode1:9200/nginx-access-geo-2018.01'
wildcard elasticsearch
curl -X DELETE 'http://elasticnode1:9200/nginx-access-geo-*'
elasticsearch
curl -X GET 'http://elasticnode1:9200/nginx-access-geo-2018.01'
elasticsearch. , . eildcard nginx-access-geo-*
curl -XPUT "http://127.0.0.1:9200/_template/nginxaccess_per_index" -d \ ' { "template" : "nginx-access-geo-*", "mappings" : { "_default_" : { "properties" : { "nginx" : { "properties" : { "request_time": {"type": "integer","ignore_malformed": true}, "upstream_response_time": {"type": "integer","ignore_malformed": true}, "remote_addr": {"type": "ip"}, "status": {"type": "integer","ignore_malformed": true}, "body_bytes_sent": {"type": "integer","ignore_malformed": true}, "upstream_response_length": {"type": "integer","ignore_malformed": true}, "request_uri": {"type": "text","fields": {"keyword": {"type": "keyword"} } } } }, "geoip2" : { "properties" : { "location2" : {"type" : "geo_point"} } } } } } } } '
elasticsearch6
curl -H "Content-Type: application/json" -XPUT "http://127.0.0.1:9200/_template/nginxaccess_per_index" -d \ ' { "template" : "nginxaccess-*", "mappings" : { "_doc" : { "properties" : { "nginx" : { "properties" : { "request_time": {"type": "integer","ignore_malformed": true}, "upstream_response_time": {"type": "integer","ignore_malformed": true}, "http_x_forwarded_for": {"type": "ip"}, "remote_addr": {"type": "ip"}, "status": {"type": "integer","ignore_malformed": true}, "body_bytes_sent": {"type": "integer","ignore_malformed": true}, "upstream_response_length": {"type": "integer","ignore_malformed": true}, "request_uri": {"type": "text","fields": {"keyword": {"type": "keyword"} } } } }, "geoip2" : { "properties" : { "location2" : {"type" : "geo_point"} } } } } } } } '
使用したソース
https://www.balabit.com/documents/syslog-ng-ose-latest-guides/en/syslog-ng-ose-guide-admin/html/geoip2-parser.html
https://itc-life.ru/centralizovannyj-sbor-i-analiz-logovo-s-pomoshhyu-syslog-ngtd-agentelasticsearchkibanagrafanaelasticalert/
https://www.balabit.com/documents/syslog-ng-ose-latest-guides/en/syslog-ng-ose-guide-admin/html/ch15s03s02.html
https://github.com/Yelp/elastalert