こんにちは友人!
昨年私はその年の最初のラウンドを作りました。
私たちは実験を続けています。
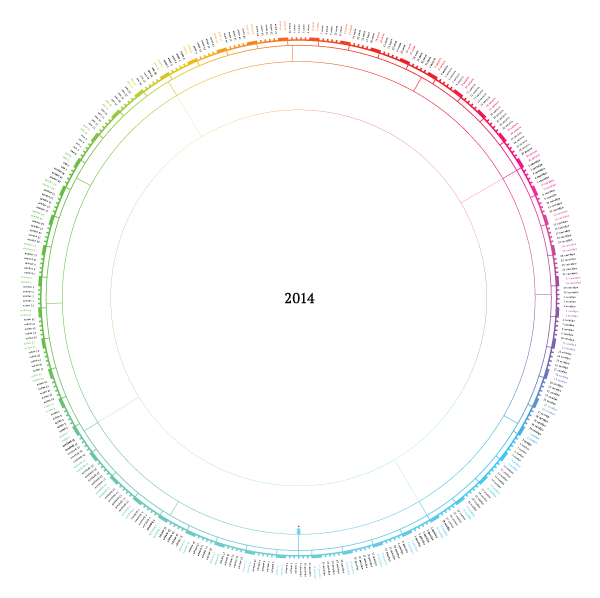
このプロジェクトのアイデアは、1年のすべての日を表示し、過去の楽しい瞬間と将来の予想されるイベントを思い出せるカレンダーを作成することです。
多くの類似物があり、このプロジェクトの特徴は、ミニマリズムと空虚です。所有者の落書きは前面にあるはずです。
• Githubからダウンロード (またはgit clone github.com/illus0r/kruglendar2014.git )
•A1形式で印刷します
•便利な場所(特に良い場所-トイレ)で壁に掛け、次に-ひもにフェルトペンを掛けます。
•何か面白いことが起こりましたか? ラウンドランドは有名です! 年末までに、見るのが楽しみになります。

前のカレンダーと同様に、このカレンダーはCreative Commons Attribution 3.0 Unportedで公開されています。
明けましておめでとうございます!
猫の下で、作成プロセスについて少し。
プロセス
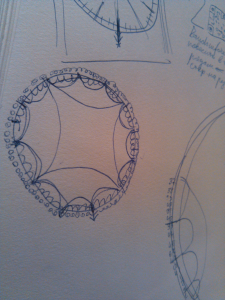
今年は、すべてスケッチから始まりました。 付属の太陰暦で、空想的でフラクタルな何かをすることを考えました。 しかし、彼は最初のミニマルなスケッチに戻りました。

本当に残念なことに、私は仕事の大部分を分かち合うスクリプトを書くことにしました。 そのため、サイズ、厚さ、そしてもちろんフォントで遊ぶことが可能になりました。
最初に円の半径と厚さを手動で設定しましたが、その後、幾何学的な進行によって決定された方がはるかに自然で快適になると判断しました。
私は花について長い間考えていませんでした。 Photoshopで、色選択ウィンドウを開いて、同じ明度のLab配色のモードに切り替えました(色の人間の知覚を考慮し、色の強さは似ています)。
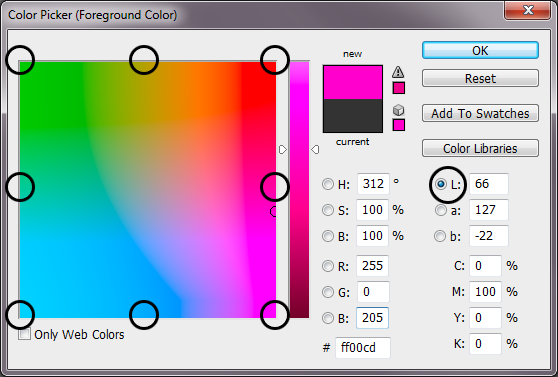
いくつかのポイントがあり、残りは補間によって取得されます。 まあ、私は最も簡単な方法を選択しませんでした、そしてあなたはイラストレーターのマスクでうまくいくことができました。 でも、もっと楽しい!
スクリプト自体
# -*- coding: utf-8 -*- import svgwrite, math, numpy def frange(x, y, jump): while x < y: yield x x += jump if __name__ == '__main__': # Calendar parameters textAngleShift = -(0.26*math.pi*2/365) canvasSize = (500,707) mid = canvasSize[0]/2.0, canvasSize[1]/2.0 dayFontFamily = "PT Sans" dayFontSize = "1.8pt" svgFileName = 'calendar_03.svg' # we will interpolate rainbow gradient through these points rainbowGradient = [[ 0, 0, 0,239,255,255, 0, 0], # Red [254,248,246,194, 0, 0,211,254], # Green [255,193, 0, 0, 0,210,255,255]] # Blue rainbowGradientPoints = [math.pi*2/7*0, math.pi*2/7*1, math.pi*2/7*2, math.pi*2/7*3, math.pi*2/7*4, math.pi*2/7*5, math.pi*2/7*6, math.pi*2/7*7 ] #======================================= # Calendar circle parameters #======================================= k = 3.0 # multiplication koef. delta = 1.9 # first step in progression initRad = canvasSize[0]*0.3684 # initial size radiusProgression = [initRad] for i in range(4): nextValue = initRad-delta*pow(k,i) radiusProgression += [nextValue] R_dates = 1.2*canvasSize[0]*0.312 R_days_end, \ R_days_beg, \ R_weeks_beg, \ R_mounthes_beg, \ R_seasons_beg = radiusProgression #R_weekend_end = R_days_beg + 20; R_weekend_end = R_days_end; # Stroke width stroke_k = 1.8 stroke_thinest = 0.15 dayLineStrokeWidth, \ weekLineStrokeWidth, \ mounthLineStrokeWidth, \ seasonLineStrokeWidth = [0.1*(stroke_k**i) for i in range(4,0,-1)] weekendStrokeWidth = 6.7 #======================================= # Filling mounth arrays #======================================= dayAngle = math.pi*2/365 weekAngle = dayAngle*7 mounthes = [u'',\ u'',\ u'',\ u'',\ u'',\ u'',\ u'',\ u'',\ u'',\ u'',\ u'',\ u''\ ] mounthDays = [31,28,31,30,31,30,31,31,30,31,30,31] # days in each mounth yearDays = ["%d %s"%(i+1, mounthes[index]) \ for index, m in enumerate(mounthDays) \ for i in range(m)] # array with marks for yearDays: # 1 means first day of mounth # 2 means first day of mounth and of season allFirstDates = [ 0 if i!=0 else \ 1 if (index+1)%3!=0 else \ 2 \ for index, m in enumerate(mounthDays) \ for i in range(m)] mounthAngles = [d*dayAngle for d in mounthDays] #======================================= # Making svg and groups #======================================= dwg = svgwrite.Drawing(svgFileName, profile='tiny') textGroup = dwg.g(font_family=dayFontFamily, \ font_size=dayFontSize,\ text_anchor="start" ) dayLineGroup = dwg.g(stroke_width=dayLineStrokeWidth, fill='none') weekLineGroup = dwg.g(stroke_width=weekLineStrokeWidth, fill='none') mounthLineGroup = dwg.g(stroke_width=mounthLineStrokeWidth, fill='none') seasonLineGroup = dwg.g(stroke_width=seasonLineStrokeWidth, fill='none') weekendGroup = dwg.g(stroke_width=weekendStrokeWidth, fill='none') #======================================= # Drawing in defined groups #======================================= for index, angle in enumerate(frange(0,math.pi*2,dayAngle)): # interpolation will help us to find # all necessary segments for every segment of circles colorTuple = (int(numpy.interp(angle, rainbowGradientPoints, \ rainbowGradient[0])), \ int(numpy.interp(angle, rainbowGradientPoints, \ rainbowGradient[1])), \ int(numpy.interp(angle, rainbowGradientPoints, \ rainbowGradient[2]))) color = "rgb%s"%(str(colorTuple)) sinus = math.sin(angle) cosinus = math.cos(angle) # Draw a week segment if (index-5)%7 == 0: weekLineGroup.add (dwg.line( (mid[0]-R_weeks_beg*sinus, \ mid[1]+R_weeks_beg*cosinus), \ (mid[0]-R_days_beg *sinus,mid[1]+R_days_beg *cosinus), \ stroke=color) ) # Draw a weekend sinus_weekend = math.sin(angle-dayAngle) cosinus_weekend = math.cos(angle-dayAngle) weekendGroup.add (dwg.line( (mid[0]-R_days_beg*sinus_weekend, \ mid[1]+R_days_beg*cosinus_weekend), \ (mid[0]-R_weekend_end *sinus_weekend,mid[1]+R_weekend_end *\ cosinus_weekend), \ stroke=color) ) #if (index-) weekLineGroup.add (dwg.line( (mid[0]-R_weeks_beg*sinus, \ mid[1]+R_weeks_beg*cosinus), \ (mid[0]-R_days_beg *sinus,mid[1]+R_days_beg *cosinus), \ stroke=color) ) # Draw a mounth+season segments if allFirstDates[index]!=0: mounthLineGroup.add (dwg.line( (mid[0]-R_mounthes_beg*sinus,mid[1]+\ R_mounthes_beg*cosinus), \ (mid[0]-R_weeks_beg *sinus,mid[1]+R_weeks_beg*cosinus), \ stroke=color) ) # Draw a season segments if allFirstDates[index]==2: seasonLineGroup.add (dwg.line( (mid[0]-R_seasons_beg*sinus,mid[1]+\ R_seasons_beg*cosinus), \ (mid[0]-R_mounthes_beg *sinus,mid[1]+R_mounthes_beg*cosinus), \ stroke=color) ) # Draw a day segments dayLineGroup.add (dwg.line( (mid[0]-R_days_beg*sinus,mid[1]+\ R_days_beg*cosinus), \ (mid[0]-R_days_end *sinus,mid[1]+R_days_end *cosinus), \ stroke=color ) ) # Draw a day name if (index-4)%7 == 0 or (index-3)%7 == 0: fillColor = color #"rgb(255,255,255)" #fontWeight = "bold" weekendMargin = 2.0 else: fillColor = "rgb(0,0,0)" #fontWeight = "normal" weekendMargin = 0 wordGroup = dwg.g(transform="rotate(%f, %f, %f) translate(%f,0)" \ %( math.degrees(angle+dayAngle+textAngleShift)+90, \ mid[0], mid[1], +R_dates+weekendMargin ) \ ) wordGroup.add( dwg.text( '%s'%(yearDays[index]), \ insert=mid, fill=fillColor \ #,style="font-weight: %s;"%(fontWeight) )) textGroup.add(wordGroup) #======================================= # Dray a circle segments #======================================= sinus_end = math.sin(angle+dayAngle) cosinus_end = math.cos(angle+dayAngle) dayLineGroup.add( dwg.line( (mid[0]-R_days_beg*sinus, \ mid[1]+R_days_beg*cosinus), \ (mid[0]-R_days_beg*sinus_end,mid[1]+R_days_beg*cosinus_end), \ stroke=color ) ) weekLineGroup.add( dwg.line((mid[0]-R_weeks_beg*sinus, \ mid[1]+R_weeks_beg*cosinus), \ (mid[0]-R_weeks_beg*sinus_end,mid[1]+R_weeks_beg*cosinus_end), \ stroke=color ) ) mounthLineGroup.add( dwg.line((mid[0]-R_mounthes_beg*sinus, \ mid[1]+R_mounthes_beg*cosinus), \ (mid[0]-R_mounthes_beg*sinus_end,mid[1]+R_mounthes_beg*cosinus_end), \ stroke=color ) ) seasonLineGroup.add( dwg.line((mid[0]-R_seasons_beg*sinus, \ mid[1]+R_seasons_beg*cosinus), \ (mid[0]-R_seasons_beg*sinus_end,mid[1]+R_seasons_beg*cosinus_end), \ stroke=color ) ) #======================================= # Simple circles for quick testing #======================================= #dayLineGroup.add( dwg.circle(center=mid, r=R_days_end, stroke='black' ) ) #dayLineGroup.add( dwg.circle(center=mid, r=R_days_beg, stroke='black' ) ) #weekLineGroup.add( dwg.circle(center=mid, r=R_weeks_beg, stroke='black' ) ) #mounthLineGroup.add( dwg.circle(center=mid, r=R_mounthes_beg, stroke='black' ) ) #seasonLineGroup.add( dwg.circle(center=mid, r=R_seasons_beg, stroke='black') ) dwg.add(dayLineGroup) dwg.add(weekLineGroup) dwg.add(mounthLineGroup) dwg.add(seasonLineGroup) dwg.add(weekendGroup) dwg.add(textGroup) # As I didn't learn how to set document width and height, just draw a rect dwg.add(dwg.rect((0, 0), canvasSize, stroke='gray', fill="none")) dwg.add(dwg.text("2014", insert=(mid[0],mid[1]+4), \ text_anchor="middle", font_family="PT Serif", font_size="10pt")) #======================================= # Finaly, draw it! #======================================= dwg.save()
出力では、 このようなSVGファイルを取得します 。これは、Illustratorの

あら! Kruglendarの準備ができました。 フィードバックを得るために連絡先にグループを作成し、 GithubのReadmeとHabrに関する記事を作成します。
ご清聴ありがとうございました。ご意見をお待ちしております。