値の配列を受け取り、それらを値ごとに1ピクセルの太さの線の形で画像に適用するスクリプトを作成します。 同時に、目的の効果を得るために、絶対配置にdiv式を使用し、CSSを使用して高さを設定します。 個々の値の相対的な変化を決定する最大の高さの値を設定することにより、設計の実装に必要な結果のページに結果の図を配置できます。
<?php // , . // , . //, , , 4 , , , , // . function create_chart($data, $height, $bars='red', $bg='white', $border='black', $grid='#ddd') { // , // , , // : static $idx = 0; $idx++; // 2 , : $height -= 2; // , //, . $scale = $height / (max($data) * 1.05); // $width = count($data); // CSS, //: echo" <style> #chartout{$idx}{ position: relative; height: ",$height + 2,"px; width: ",$width + 2,"px; background-color: {$border}; } #chartin{$idx}{ position: absolute; top: 1px; left: 1px; height: {$height}px; width: {$width}px; background-color: {$bg}; } .bar{$idx}{ position: absolute; bottom: 0; background-color: {$bars}; width: 1px; overflow: hidden; } .grid{$idx}{ position: absolute; left: 0; height: 1px; width: {$width}px; background-color: {$grid}; padding: 0; margin: 0; overflow: hidden; } </style> "; // : echo"<div id='chartout{$idx}'><div id='chartin{$idx}'>"; // , : foreach(range(1,3) as $line) { $lh = round($line * ($height/5)); echo "<div class='grid{$idx}' style='top: {$lh}px'></div>\n"; } // , // : foreach($data as $pos => $val) { $barheight = round($val * $scale); echo "<div class='bar{$idx}' style='left: {$pos}px; height: {$barheight}px;'></div>\n"; } // echo "\n</div></div>\n"; } // 200 . $chardata = array(); $chardata2 = array(); for ($i=0; $i<200; $i++) { $chardata[$i] = rand(1,1000); $chardata2[$i] = rand(1,1000); } // , 100 : create_char($chardata,100); // 50 , : create_char($chardata2,50,"#0c0","black","black","#666"); ?>
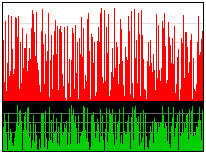
第1チャート:

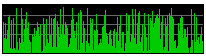
2番目のチャート:
両方: