OVHcloud, the largest European hoster and cloud provider, actively uses the Warp 10 platform. All of their monitoring data flows into one Warp 10 cluster. These are 400,000 servers, 27 data centers, a total of several million metrics per second!
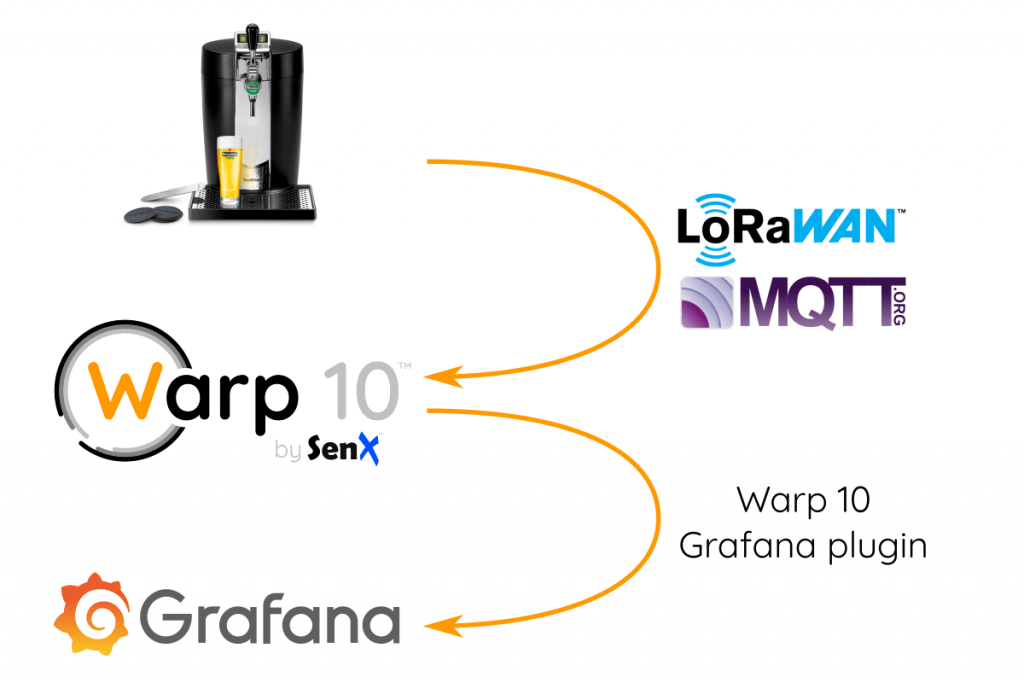
They have many dashboards, and now OVHcloud is the maintainer of the open source plugin Warp 10 Grafana , the development of which we started some time ago. We’ll talk about him. If you want to try it yourself, the data is in the public domain - you can copy WarpScript below.

We already talked about how to connect BeerTender to Warp 10.
Installation
First, install Grafana. Follow the instructions on their website .
We connect to the default
http://localhost:3000/
, go to the default password admin / admin, then change the administrator password.
For the latest version of Grafana, the plugin will have to be installed manually. The method with
grafana-cli
will not work. You just need to clone the plugin repository into the Grafana plugin directory and fix permissions everywhere.
sudo systemctl stop grafana-server.service sudo chown -R grafana:mygroup /var/lib/grafana/ sudo chmod g+rw /var/lib/grafana/plugins git clone git@github.com:ovh/ovh-warp10-datasource.git /var/lib/grafana/plugins/ovh-warp10-datasource sudo chown -R grafana:mygroup /var/lib/grafana/plugins sudo systemctl start grafana-server.service
Configuration
In the Grafana configuration, go to the Datasources section and add a datasource with the type Warp 10. Make sure that it points to the required instance of Warp 10. You can specify the same settings as ours:

It's time to take data from the BeerTender ...
Temperature display
Create a new dashboard, add a panel with the Graph visualization type and enter Queries mode:

Initial temperature (integer values from the sensor)
- In the data source, select Warp 10 (or the default value)
- Turn on WarpScript Editor
- Copy WarpScript below
- In the upper right corner, select "Last 30 days"
- Save the result
"gCA1SVjbDkaxtmTx9ydI4TI2iGc5hFgcbCWnzMRZSt45XW8dZ53Z7VK_if28i0kXwNDLazXHgLrXUKgxLK0RbS79eJmBCpyBlIxw9US7bPfdWH4Fta51.kXN.D4Hsk5OZOwl.vLRBzMpP7F2pAMfclMXSGtCOT6F" 'rt' STORE [ $rt 'beertender.rawtemperature' {} NOW 30 d ] FETCH 0 GET
This script will display the initial values from the ADC sensor. Please note that the WarpScript editor in Grafana is not as powerful as before, there is no more auto-completion here. You can write a script in WarpStudio or VSCode, so you will have syntax highlighting and online documentation, and then copy and paste the result into Grafana.
Auto Spacing
In this example, select the 30-day interval and set the view mode in graphan over the past 30 days. If we select the view mode for the last day or year, WarpScript will always request data every 30 days. The plugin solves this problem: two variables are available for use in WarpScript -
$end
and
$interval
.
[ $rt 'beertender.rawtemperature' {} $end $interval ] FETCH 0
Beer temperature
I took several measurements of water, ice and hot water, comparing with a reference sensor ... The result was the following:
  T (° C) initial value
 18.3 680
 41.5 870
 37.6 841
 10 586
 11 596
 8 559
 1,467
 4,500
 6.5 535
Insert these values into the GTS time series and sort the result by the initial values from the sensor:
NEWGTS 'linearInterpolation' RENAME 680 NaN NaN NaN 18.3 ADDVALUE 870 NaN NaN NaN 41.5 ADDVALUE 841 NaN NaN NaN 37.6 ADDVALUE 586 NaN NaN NaN 10 ADDVALUE 596 NaN NaN NaN 11 ADDVALUE 559 NaN NaN NaN 8 ADDVALUE 467 NaN NaN NaN 1 ADDVALUE 500 NaN NaN NaN 4.5 ADDVALUE 535 NaN NaN NaN 6.5 ADDVALUE SORT

Expected Interpolation
The source data from the sensor comes in the form of integers. The easiest way to interpolate is to first build the curve, and then use the ATTICK function to read the values in degrees from it.
Interpolation in WarpScript is easy. We make a bucket to set the desired period, and then start the interpolation, filling in the missing values.
[ $linearInterpolation bucketizer.last 0 1 0 ] BUCKETIZE 0 GET INTERPOLATE 'truthtableGTS' STORE

Fine. Now you need to write your own mapper in order to replace each value from the sensor with a real physical temperature value, and bring the result into the format used by the graphane.
Warning : Values arrive every 10 seconds. In three months, 270 thousand values will accumulate. Too much for Grafana ... Just keep the maximum value of each hour. In WarpScript, it is BUCKETIZE with the bucketizer bucketizer.max .
You can copy this WarpScript into Grafana:
// raw value interpolation "gCA1SVjbDkaxtmTx9ydI4TI2iGc5hFgcbCWnzMRZSt45XW8dZ53Z7VK_if28i0kXwNDLazXHgLrXUKgxLK0RbS79eJmBCpyBlIxw9US7bPfdWH4Fta51.kXN.D4Hsk5OZOwl.vLRBzMpP7F2pAMfclMXSGtCOT6F" 'rt' STORE NEWGTS 'linearInterpolation' RENAME 680 NaN NaN NaN 18.3 ADDVALUE 870 NaN NaN NaN 41.5 ADDVALUE 841 NaN NaN NaN 37.6 ADDVALUE 586 NaN NaN NaN 10 ADDVALUE 596 NaN NaN NaN 11 ADDVALUE 559 NaN NaN NaN 8 ADDVALUE 467 NaN NaN NaN 1 ADDVALUE 500 NaN NaN NaN 4.5 ADDVALUE 535 NaN NaN NaN 6.5 ADDVALUE SORT 'linearInterpolation' STORE [ $linearInterpolation bucketizer.last 0 1 0 ] BUCKETIZE 0 GET INTERPOLATE 'truthtableGTS' STORE [ $rt 'beertender.rawtemperature' {} NOW $end $interval ] FETCH // subsampling, keep max of every hour [ SWAP bucketizer.max 0 1 h 0 ] BUCKETIZE UNBUCKETIZE // do not try to interpolate missing buckets. // interpolation [ SWAP <% 'l' STORE [ $l 0 GET //same tick NaN NaN NaN //no latitude/longitude/elevation $truthtableGTS $l 7 GET 0 GET ATTICK 4 GET //take the interpolated value ] %> MACROMAPPER 0 0 0 ] MAP 'temperature (°C)' RENAME

5 ° C, normal for beer

BeerTender dashboard, first version
Barrel level
The strain gauge measures the level in the barrel ... But this is a cheap three-wire sensor on a rusty metal stand. It is not possible to obtain accurate information from such equipment. Therefore, it is not surprising that the output is really a noisy result, and absolute values cannot be trusted. For our BeerTender, I found an experimental formula for Grafana to display the current level as a percentage.
Tip: The Warp 10 plugin only retrieves data from GTS. Even if you want to display a single value, you need to present it at one point in the GTS data.
Here is WarpScript, which takes the last data point and turns it into a percentage value, and also creates a time series with one point:
"gCA1SVjbDkaxtmTx9ydI4TI2iGc5hFgcbCWnzMRZSt45XW8dZ53Z7VK_if28i0kXwNDLazXHgLrXUKgxLK0RbS79eJmBCpyBlIxw9US7bPfdWH4Fta51.kXN.D4Hsk5OZOwl.vLRBzMpP7F2pAMfclMXSGtCOT6F" 'rt' STORE //read for beer level [ $rt 'beertender.rawvalue' {} NOW -1 ] FETCH 0 GET VALUES 0 GET 'rawSensorValue' STORE //raw correction: // empty: 30.8e6 // full (and cold): 30.5e6 30.8e6 $rawSensorValue - 0 MAX 2800 / 100 MIN 'beerlevelPercent' STORE $beerlevelPercent NEWGTS 'Barre Level (%25)' RENAME 1 NaN NaN NaN $beerlevelPercent ADDVALUE
Use this WarpScript as a request for a panel with a Gauge visualization type:

Nice indicator
If you are interested, you can look at the source data ... Now we have a token for access to unique statistics on beer consumption!
conclusions
- If monitoring data has recently been under your control, Grafana can easily integrate the Warp 10 data source.
- The Grafana plugin expects a GTS time series or GTS list.
- OVHcloud is the current plugin maintainer. Feel free to contribute!
- Read the documentation for more information.
- If you want to enrich the visualization of data, you can take our ready-made web components .