My name is Vladimir Borodin, I'm the head of the Yandex.Cloud data platform. Today I want to tell you how everything is arranged and works inside the Yandex Managed Databases services, why everything is done just like that and what are the advantages - from the point of view of users - of our various solutions. And of course, you will definitely find out what we plan to finalize in the near future, so that the service becomes better and more convenient for everyone who needs it.
Well, let's go!

Managed Databases (Yandex Managed Databases) is one of the most popular Yandex.Cloud services. More precisely, this is a whole group of services that is now second only to Yandex Compute Cloud virtual machines in popularity.
Yandex Managed Databases makes it possible to quickly get a working database and takes on such tasks:
- Scaling - from the elementary ability to add computing resources or disk space to an increase in the number of replicas and shards.
- Install updates, minor and major.
- Backup and restore.
- Providing fault tolerance.
- Monitoring
- Providing convenient configuration and management tools.
How managed database services are arranged: top view
The service consists of two main parts: Control Plane and Data Plane. Control Plane is, simply put, a database management API that allows you to create, modify, or delete databases. Data Plane is the level of direct data storage.
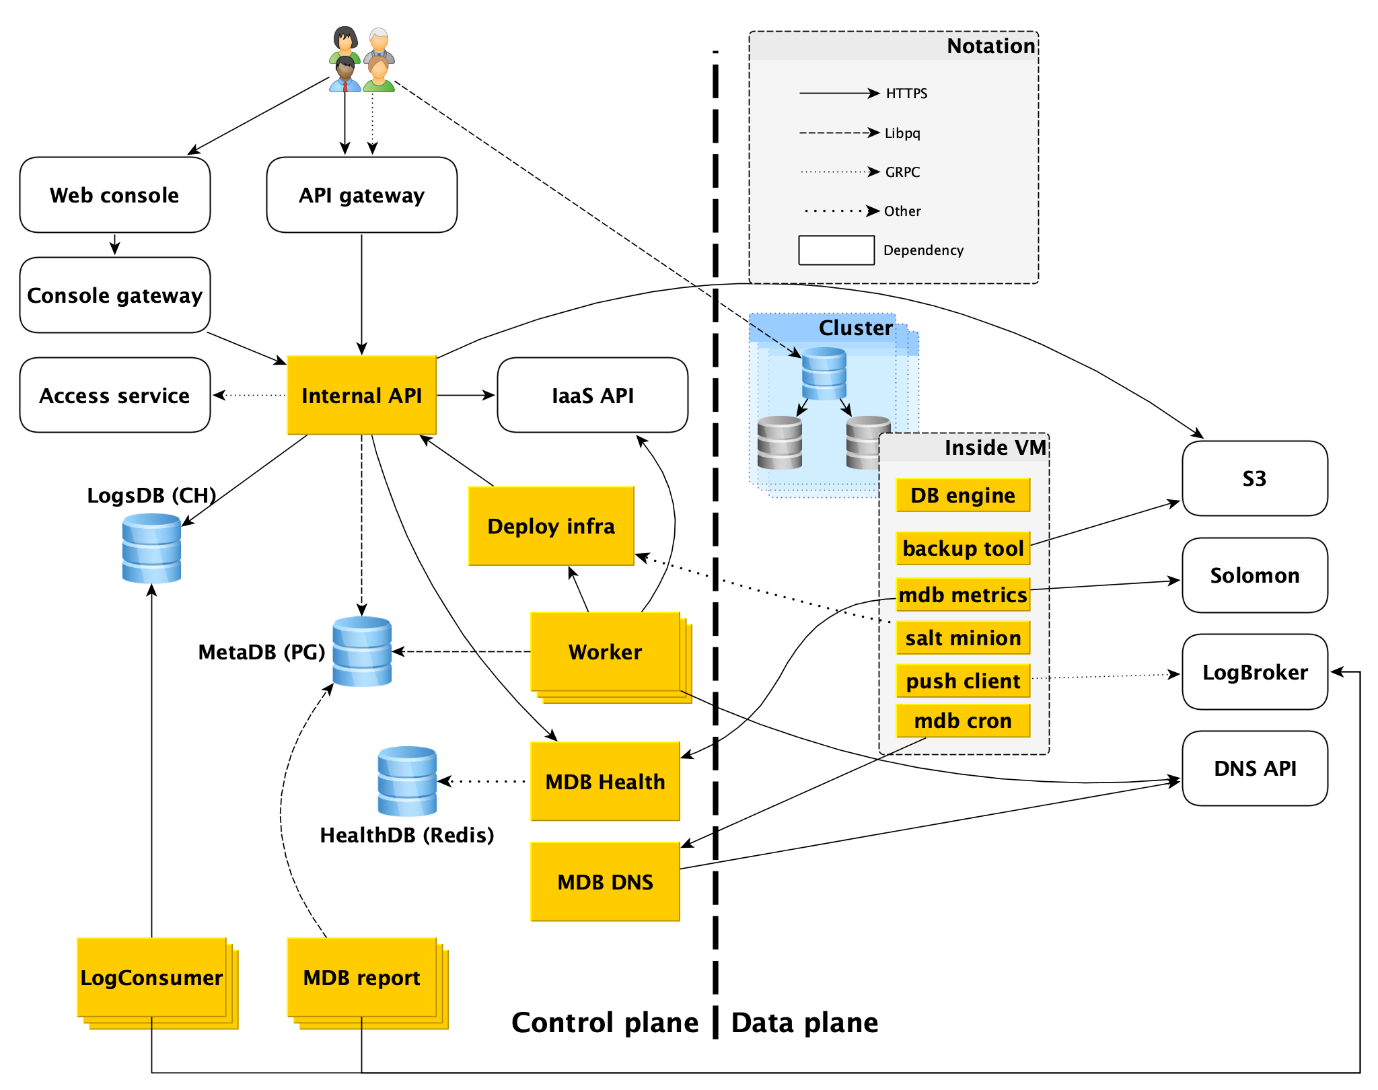
The service users have, in fact, two entry points:
- In Control Plane. In fact, there are many inputs - the Web console, the CLI utility and the gateway API that provides the public API (gRPC and REST). But all of them ultimately go to what we call the Internal API, and therefore we will consider this one entry point into the Control Plane. In fact, this is the point from which the Managed Databases (MDB) service area of responsibility begins.
- In Data Plane. This is a direct connection to a running database through access protocols to the DBMS. If it is, for example, PostgreSQL, then it will be the libpq interface .
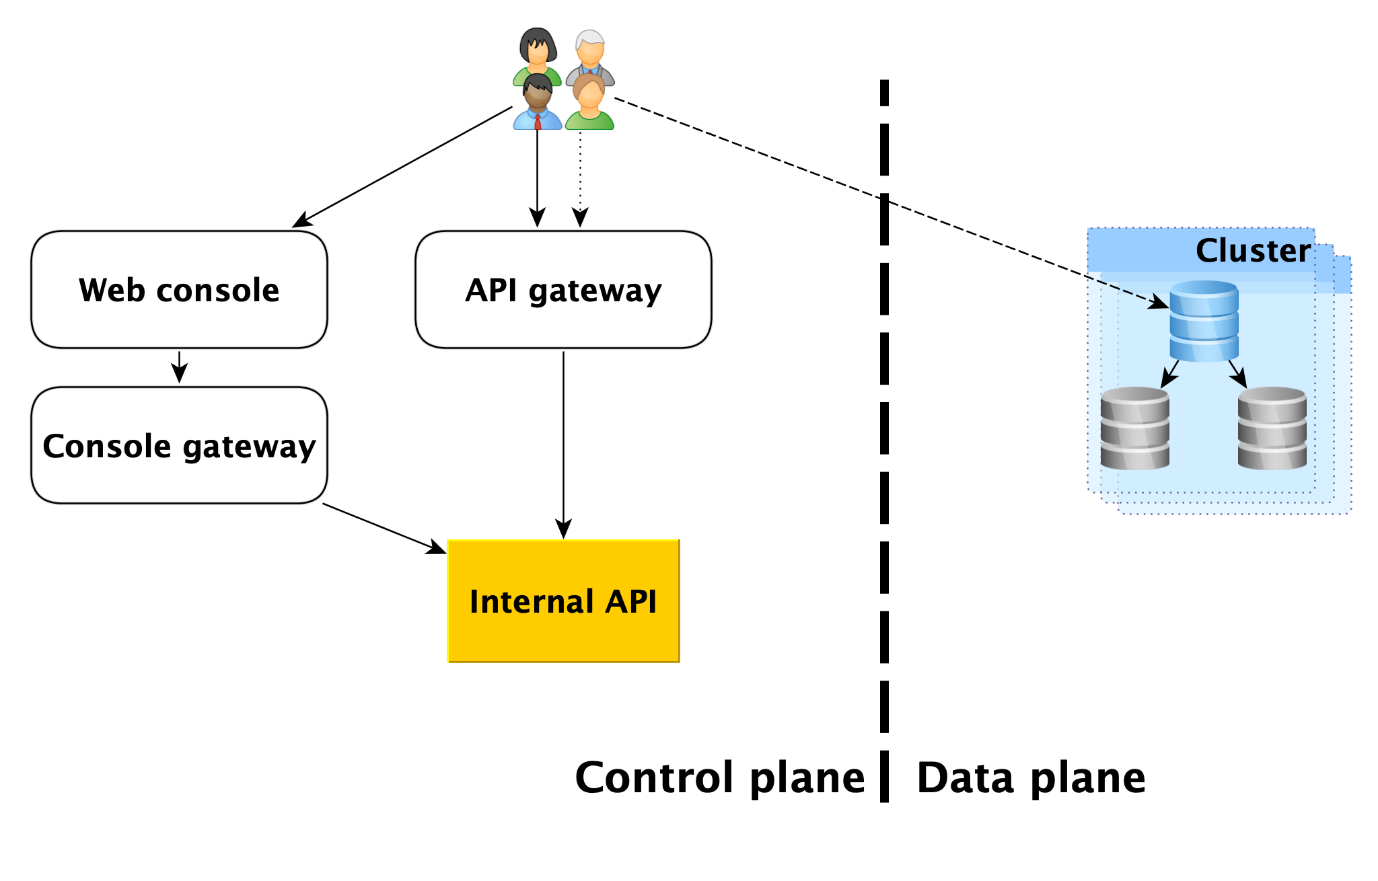
Below we will describe in more detail everything that happens in the Data Plane, and analyze each of the components of the Control Plane.
Data plane
Before looking at the components of the Control Plane, let’s look at what’s happening in the Data Plane.
Inside a virtual machine
MDB runs databases in the same virtual machines that are provided in Yandex Compute Cloud .
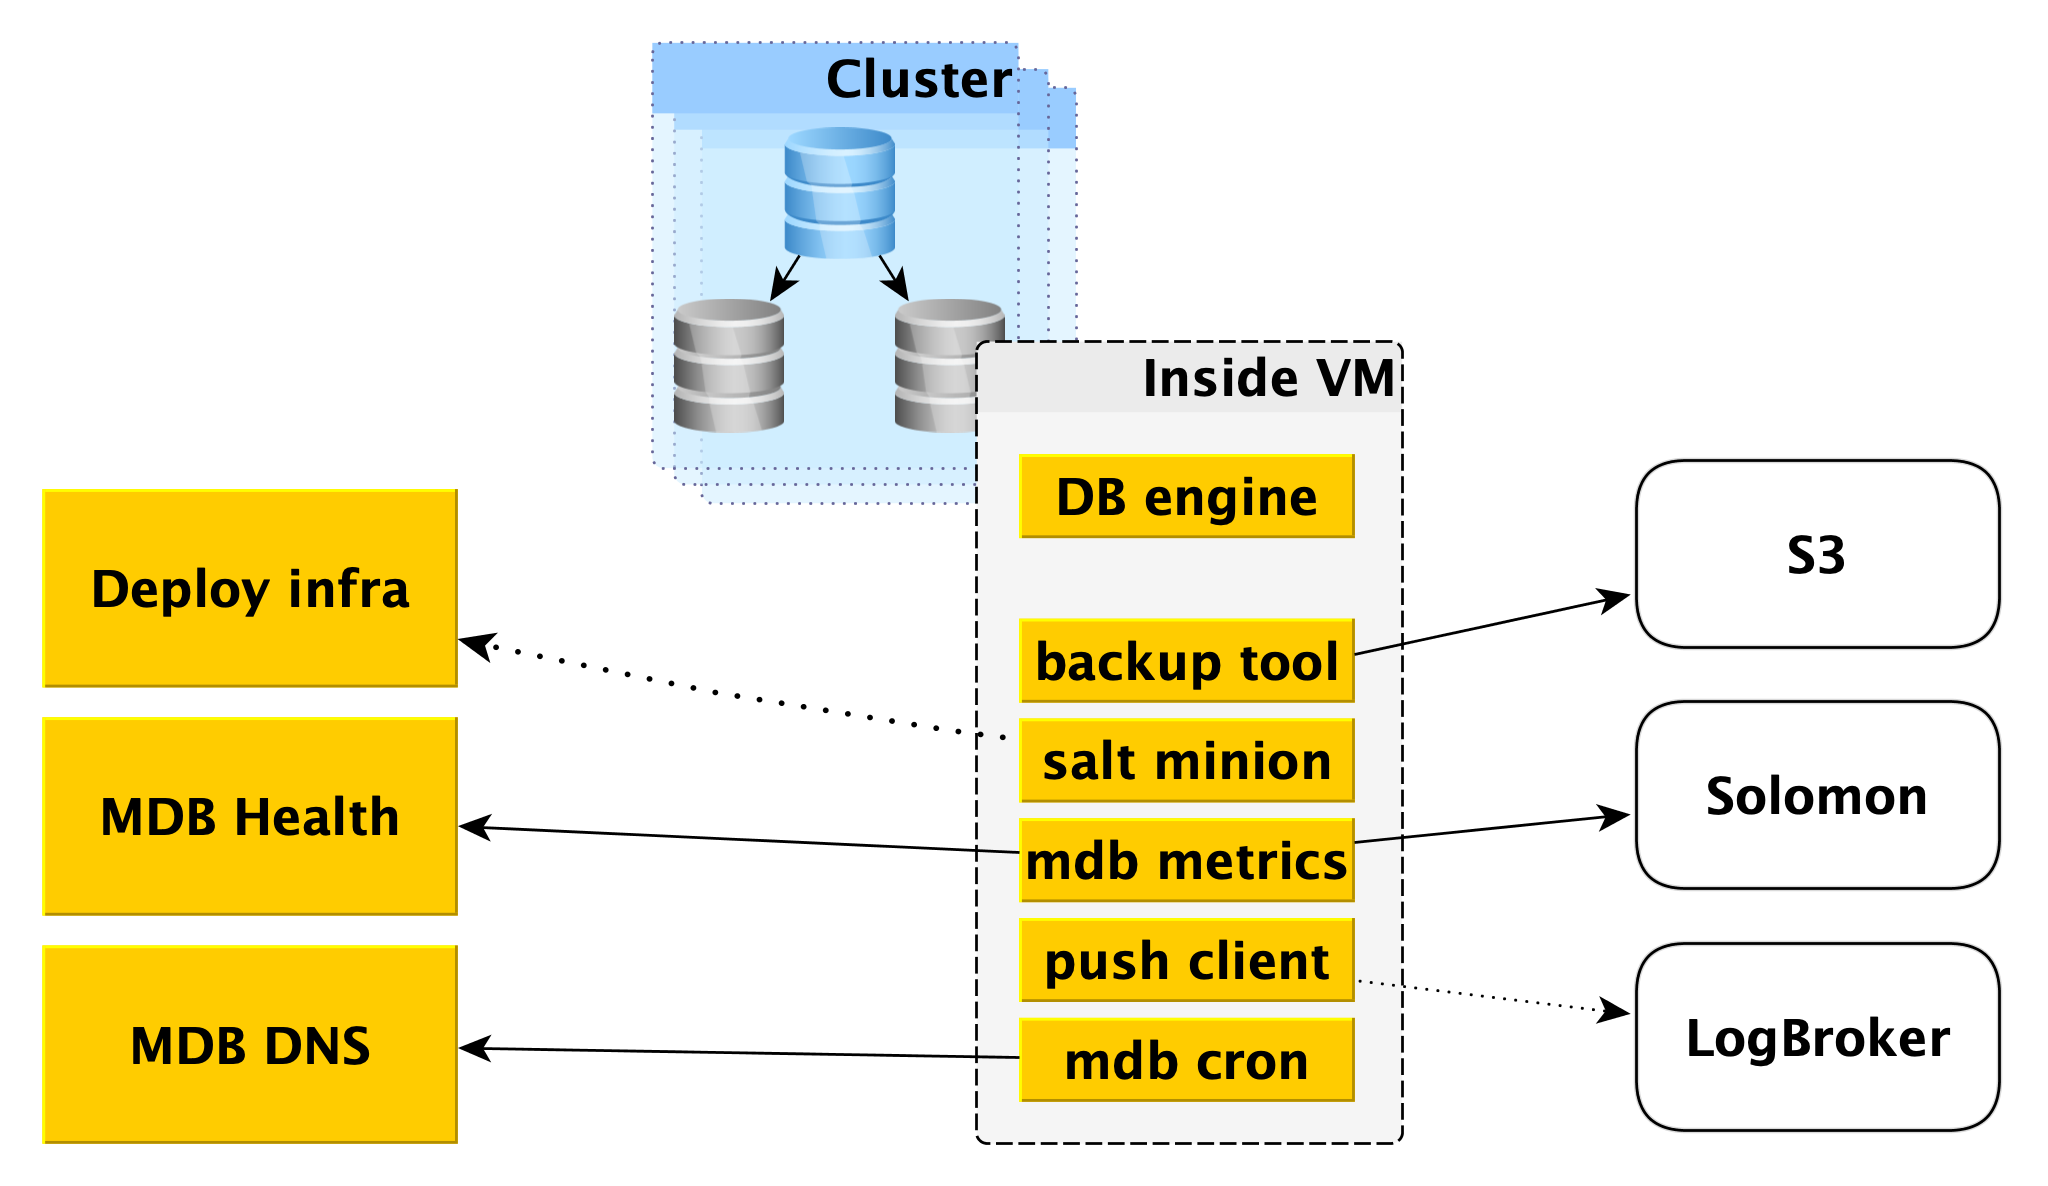
First of all, a database engine, for example, PostgreSQL, is deployed there. In parallel, various auxiliary programs can be launched. For PostgreSQL, this will be Odyssey , the database connection puller.
Also, inside the virtual machine, a certain standard set of services is launched, its own for each DBMS:
- Service for creating backups. For PostgreSQL, it is an open source WAL-G tool . It creates backups and stores them in Yandex Object Storage .
- Salt Minion is a component of the SaltStack system for operations and configuration management. More information about it is given below in the description of the Deploy infrastructure.
- MDB metrics, which is responsible for transferring database metrics to Yandex Monitoring and to our microservice for monitoring the status of MDB Health clusters and hosts.
- Push client, which sends DBMS logs and billing logs to Logbroker service, is a special solution for collecting and delivering data.
- MDB cron - our bike, which differs from the usual cron in the ability to perform periodic tasks with an accuracy of a second.
Network topology
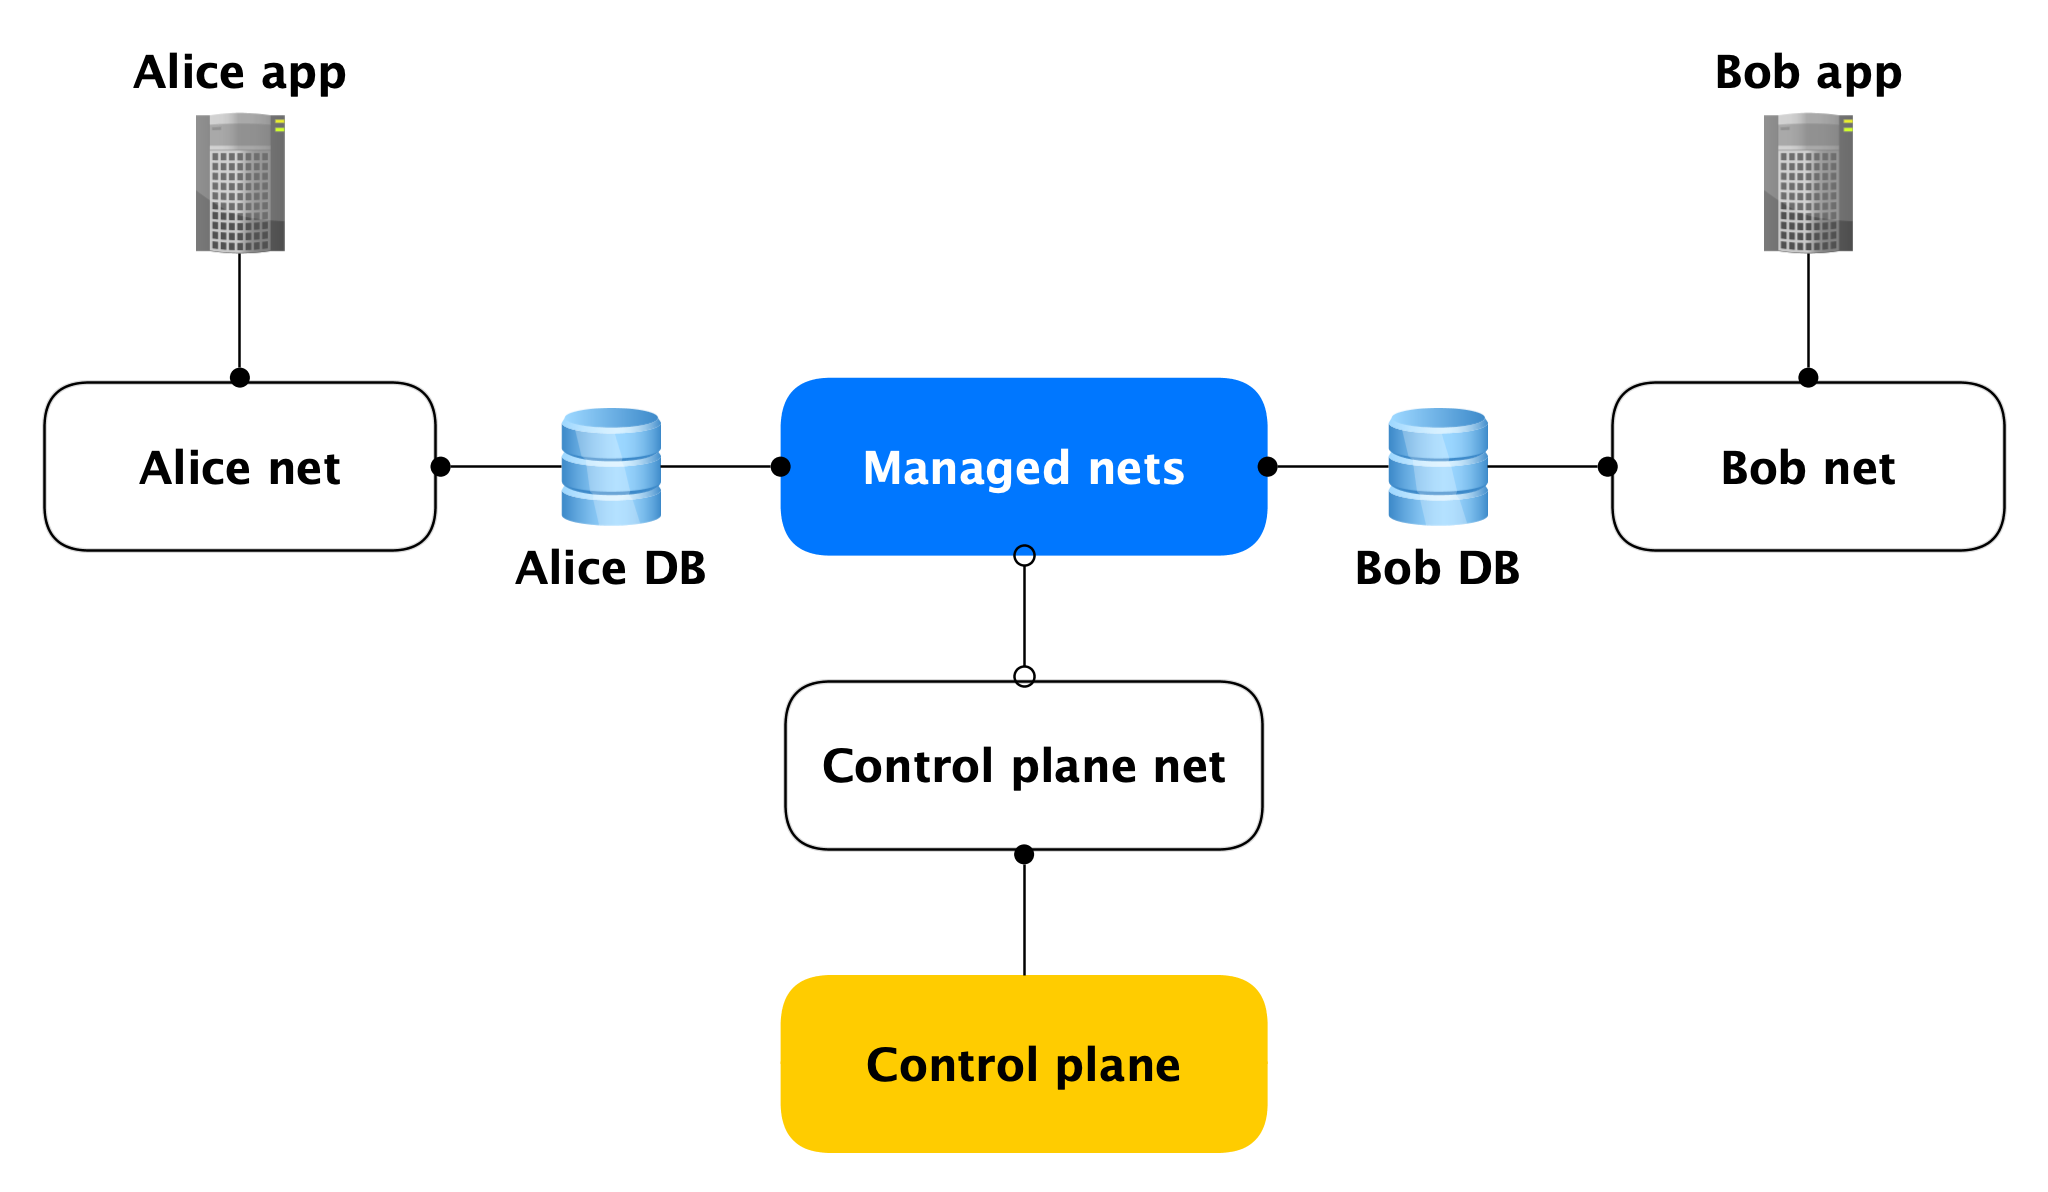
Each Data Plane host has two network interfaces:
- One of them sticks into the user's network. In general, it is needed to service the product load. Through it, replication is chasing.
- The second sticks into one of our managed networks through which hosts go to Control Plane.
Yes, hosts of different clients are stuck into one such managed network, but this is not scary, because on the managed interface (almost) nothing is listening, outgoing network connections in Control Plane are only opened from it. Almost no one, because there are open ports (for example, SSH), but they are closed by a local firewall that only allows connections from specific hosts. Accordingly, if an attacker gains access to a virtual machine with a database, he will not be able to reach other people's databases.
Data Plane Security
Since we are talking about security, it must be said that we originally designed the service in the calculation of an attacker getting root on the cluster virtual machine.
In the end, we put a lot of effort into doing the following:
- Local and large firewall;
- Encryption of all connections and backups;
- All with authentication and authorization;
- AppArmor
- Self-written IDS.
Now consider the components of Control Plane.
Control plane
Internal API
The Internal API is the first entry point into the Control Plane. Let's see how everything works here.
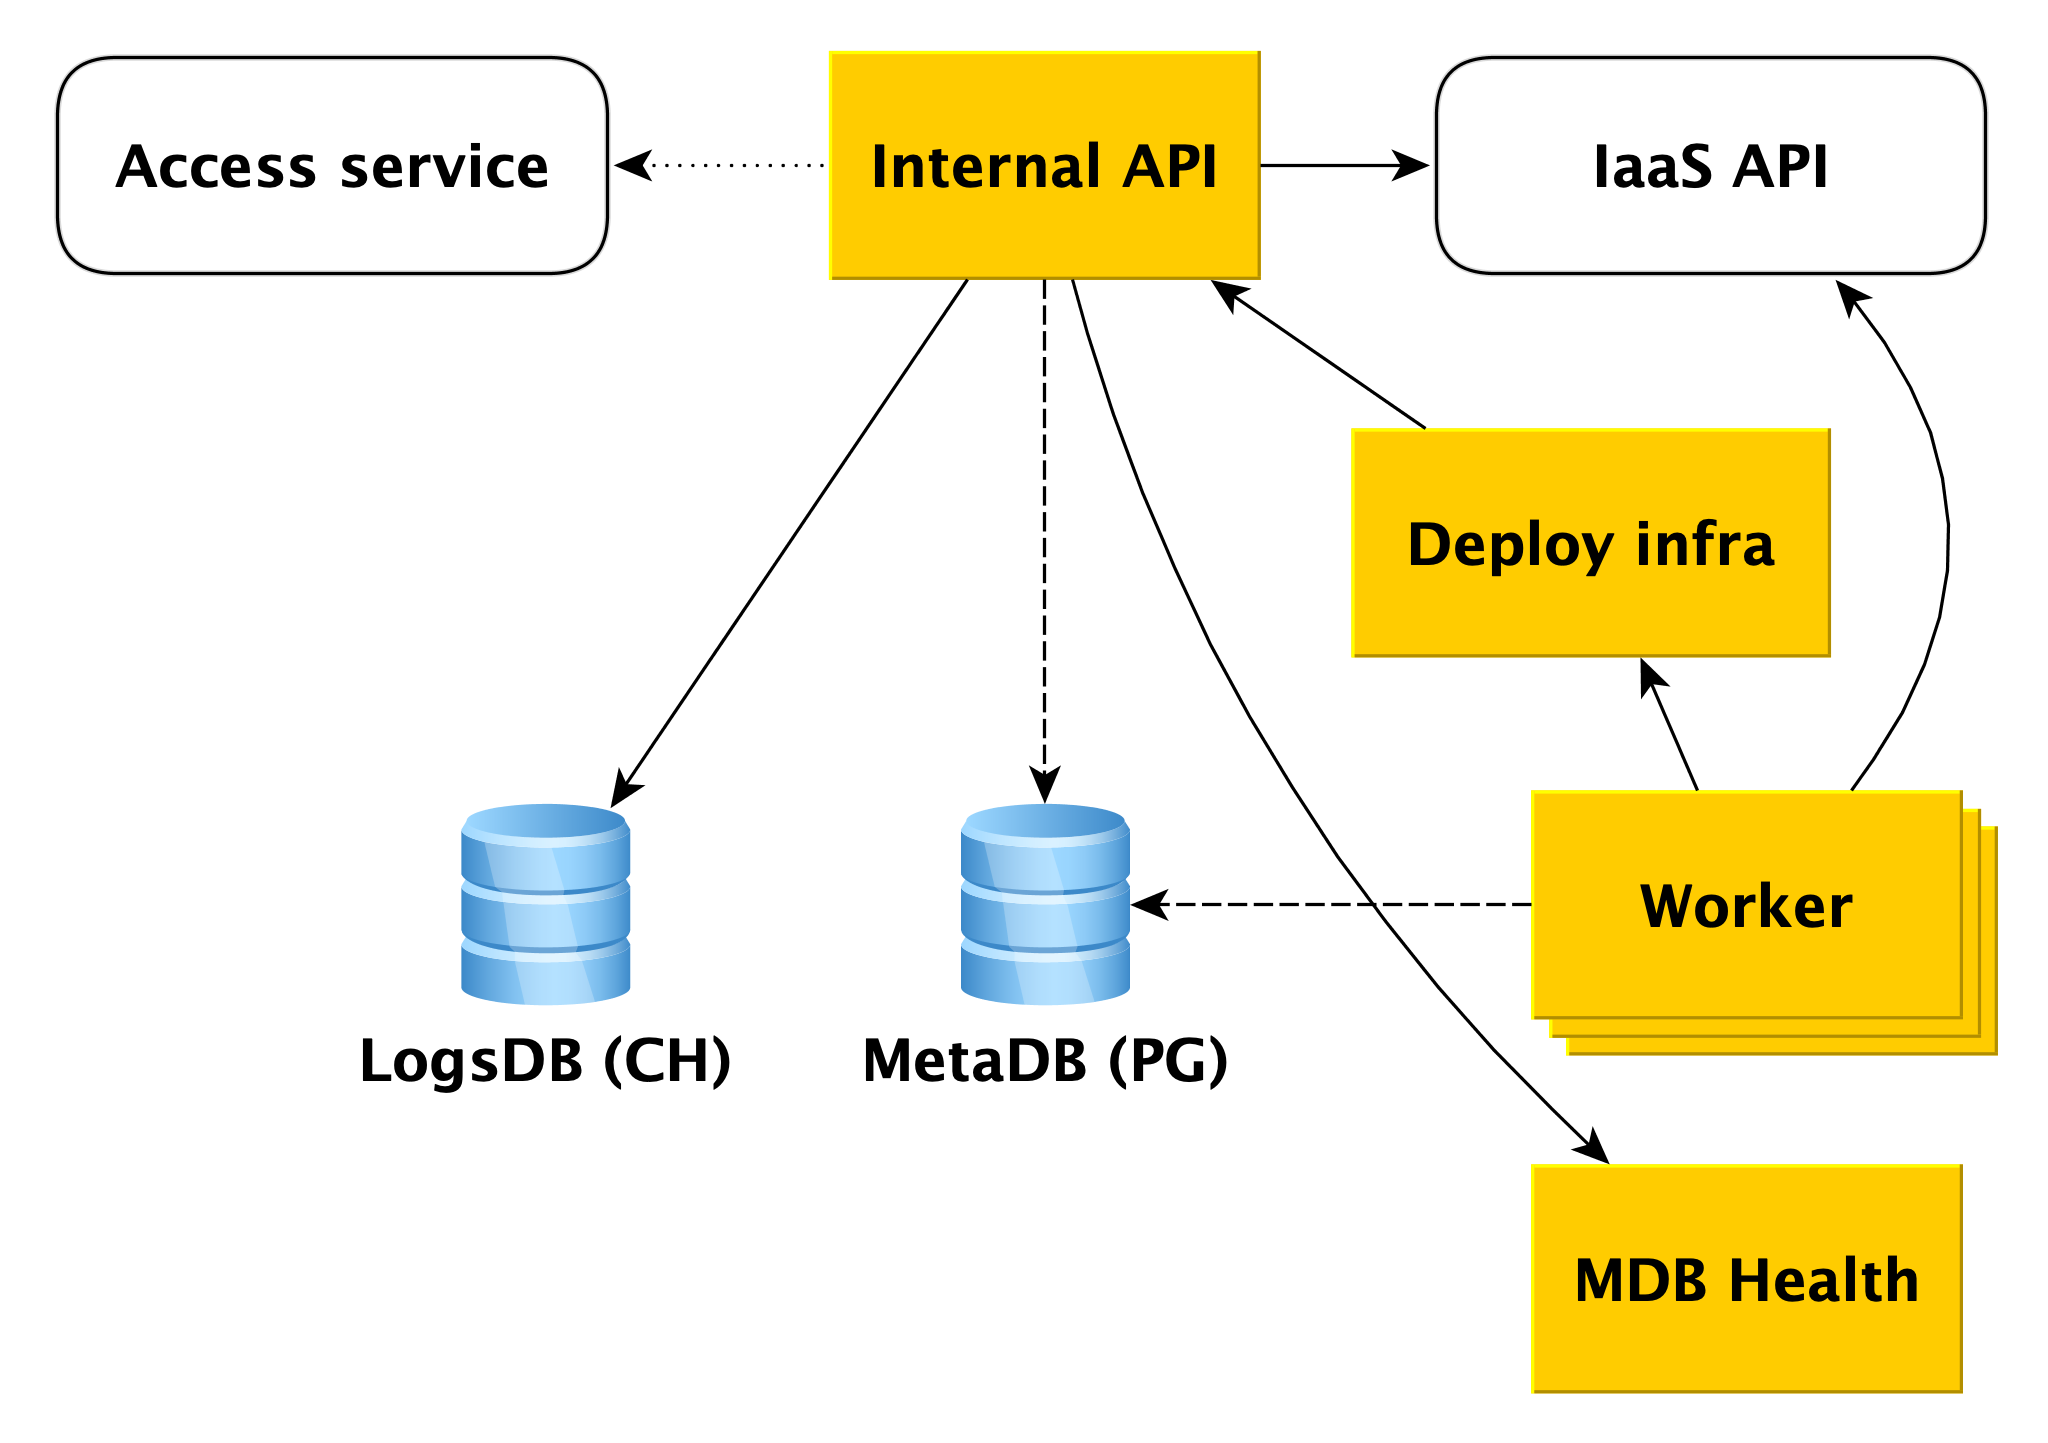
Suppose the Internal API receives a request to create a database cluster.
First of all, the Internal API accesses the cloud service Access service, which is responsible for verifying user authentication and authorization. If the user passes the verification, the Internal API checks the validity of the request itself. For example, a request to create a cluster without specifying its name or with an already taken name will fail the test.
And the Internal API can send requests to the API of other services. If you want to create a cluster in a certain network A, and a specific host in a specific subnet B, the Internal API must make sure that you have rights to both network A and the specified subnet B. At the same time, it will check that subnet B belongs to network A This requires access to the infrastructure API.
If the request is valid, information about the created cluster will be saved in the metabase. We call it MetaDB, it is deployed on PostgreSQL. MetaDB has a table with a queue of operations. The Internal API saves information about the operation and sets the task transactionally. After that, information about the operation is returned to the user.
In general, to handle most of the requests of the Internal API, it is enough to use MetaDB and the API of related services. But there are two more components that the Internal API goes to to answer some queries - LogsDB, where the user cluster logs are located, and MDB Health. About each of them will be described in more detail below.
Worker
Workers are just a set of processes that query the queue of operations in MetaDB, grab them and execute them.
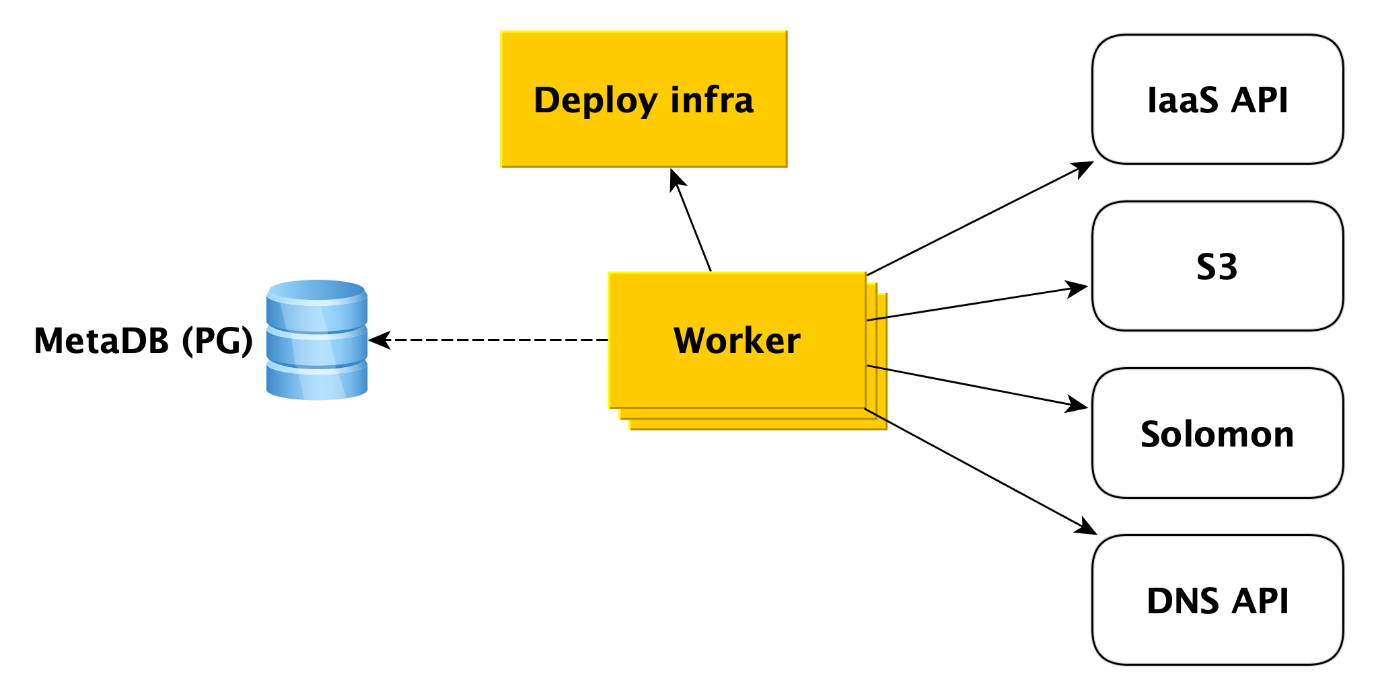
What exactly does a worker do when a cluster is created? First he turns to the infrastructure API for creating virtual machines from our images (they already have all the necessary packages installed and most things are configured, the images are updated once a day). When the virtual machines are created and the network takes off in them, the worker turns to the Deploy infrastructure (we will tell you more about it later) to deploy what the user needs to the virtual machines.
In addition, worker accesses other Cloud services. For example, to Yandex Object Storage to create a bucket in which cluster backups will be saved. To the Yandex Monitoring service, which will collect and visualize database metrics. Worker should create there cluster meta information. To the DNS API, if the user wants to assign public IP addresses to the cluster hosts.
In general, worker works very simply. It receives the task from the metabase queue and accesses the desired service. After completing each step, the worker stores information about the progress of the operation in the metabase. If a failure occurs, the task simply restarts and runs from where it left off. But even restarting it from the very beginning is not a problem, because almost all types of tasks for workers are written idempotently. This is because the worker can perform one or another step of the operation, but there is no information about this in MetaDB.
Deploy Infrastructure
At the very bottom, SaltStack is used, a fairly common open source configuration management system written in Python. The system is very expandable , for which we love it.
The main components of salt are salt master, which stores information about what should be applied and where, and salt minion, an agent that is installed on each host, interacts with the master and can directly apply the salt from the salt master to the host. For the purposes of this article, we have enough of this knowledge, and you can read more in the SaltStack documentation .
One salt master is not fault tolerant and does not scale to thousands of minions, several masters are needed. Interacting with this directly from the worker is inconvenient, and we wrote our bindings on Salt, which we call the Deploy framework.
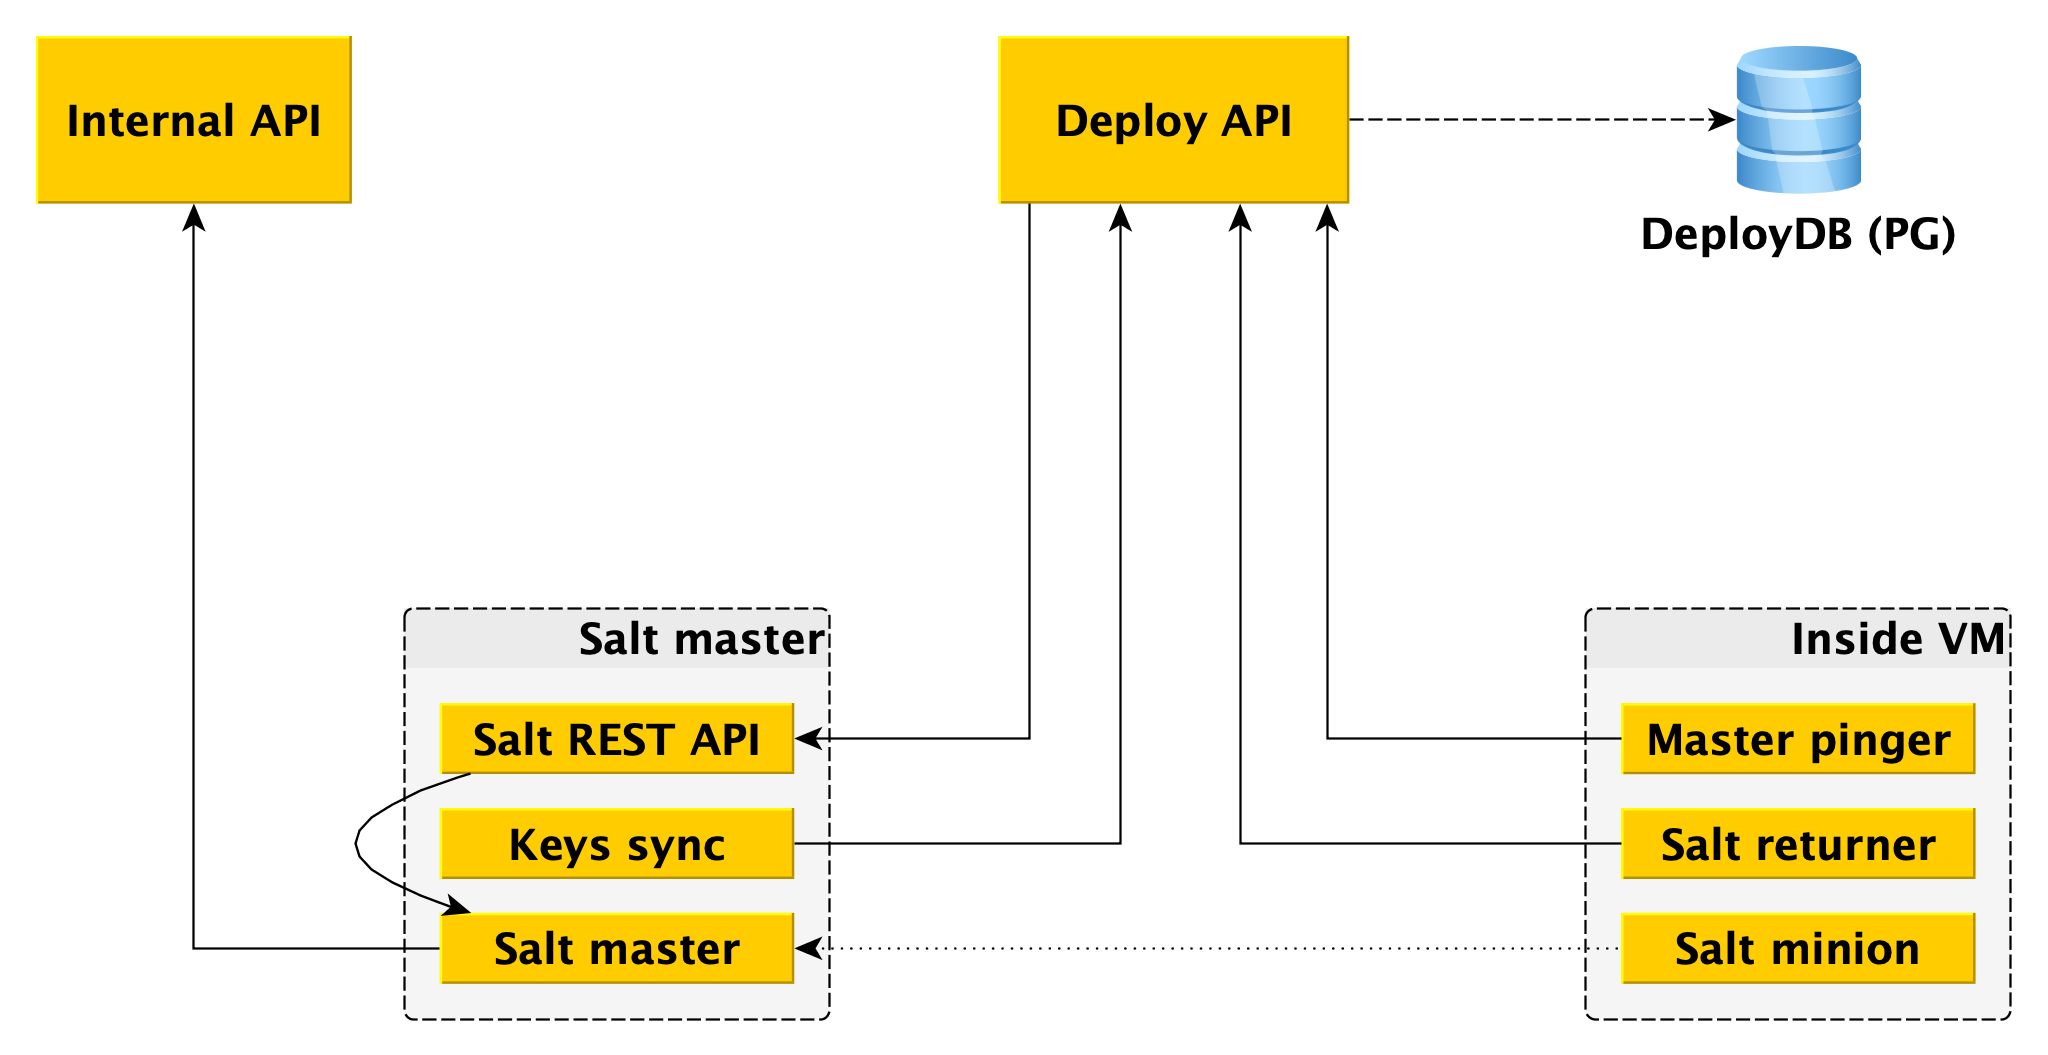
For the worker, the only entry point is the Deploy API, which implements methods such as “Apply the whole state or its individual pieces to such minions” and “Tell the status of such and such roll-out”. Deploy API stores information about all rollouts and its specific steps in DeployDB, where we also use PostgreSQL. Information about all minions and masters and about the belonging of the first to the second are also stored there.
Two additional components are installed on salt masters:
- Salt REST API , with which Deploy API interacts to launch rollouts. The REST API goes to the local salt-master, and he already communicates with minions using ZeroMQ.
- The essence is that it goes to the Deploy API and receives the public keys of all the minions that must be connected to this salt-master. Without a public key on the master, the minion simply cannot connect to the master.
In addition to salt minion, Data Plane also has two components:
- Returner - a module (one of the extensible parts in salt), which brings the result of rolling out not only to the salt-master, but also in the Deploy API. Deploy API initiates deploy by going to the REST API on the wizard, and receives the result through the returner from the minion.
- Master pinger, which periodically polls the Deploy API to which master minions should be connected. If the Deploy API returns a new master address (for example, because the old one is dead or overloaded), pinger reconfigures the minion.
Another place where we use SaltStack extensibility is ext_pillar - the ability to get pillar from somewhere outside (some static information, for example, the configuration of PostgreSQL, users, databases, extensions, etc.). We go to the Internal API from our module to get cluster-specific settings, since they are stored in MetaDB.
Separately, note that pillar also contains confidential information (user passwords, TLS certificates, GPG keys for encrypting backups), and therefore, firstly, all interaction between all components is encrypted (not in any of our databases come without TLS, HTTPS everywhere, the minion and the master also encrypt all traffic). And secondly, all of these secrets are encrypted in MetaDB, and we use the separation of secrets - on the Internal API machines there is a public key that encrypts all secrets before being stored in MetaDB, and the private part is on salt masters and only they can get open secrets to transmit as pillar to a minion (again via an encrypted channel).
MDB Health
When working with databases, it is useful to know their status. For this, we have the MDB Health microservice. It receives host status information from the internal component of the MDB virtual machine MDB and stores it in its own database (in this case, Redis). And when a request about the status of a particular cluster arrives in the Internal API, the Internal API uses data from MetaDB and MDB Health.
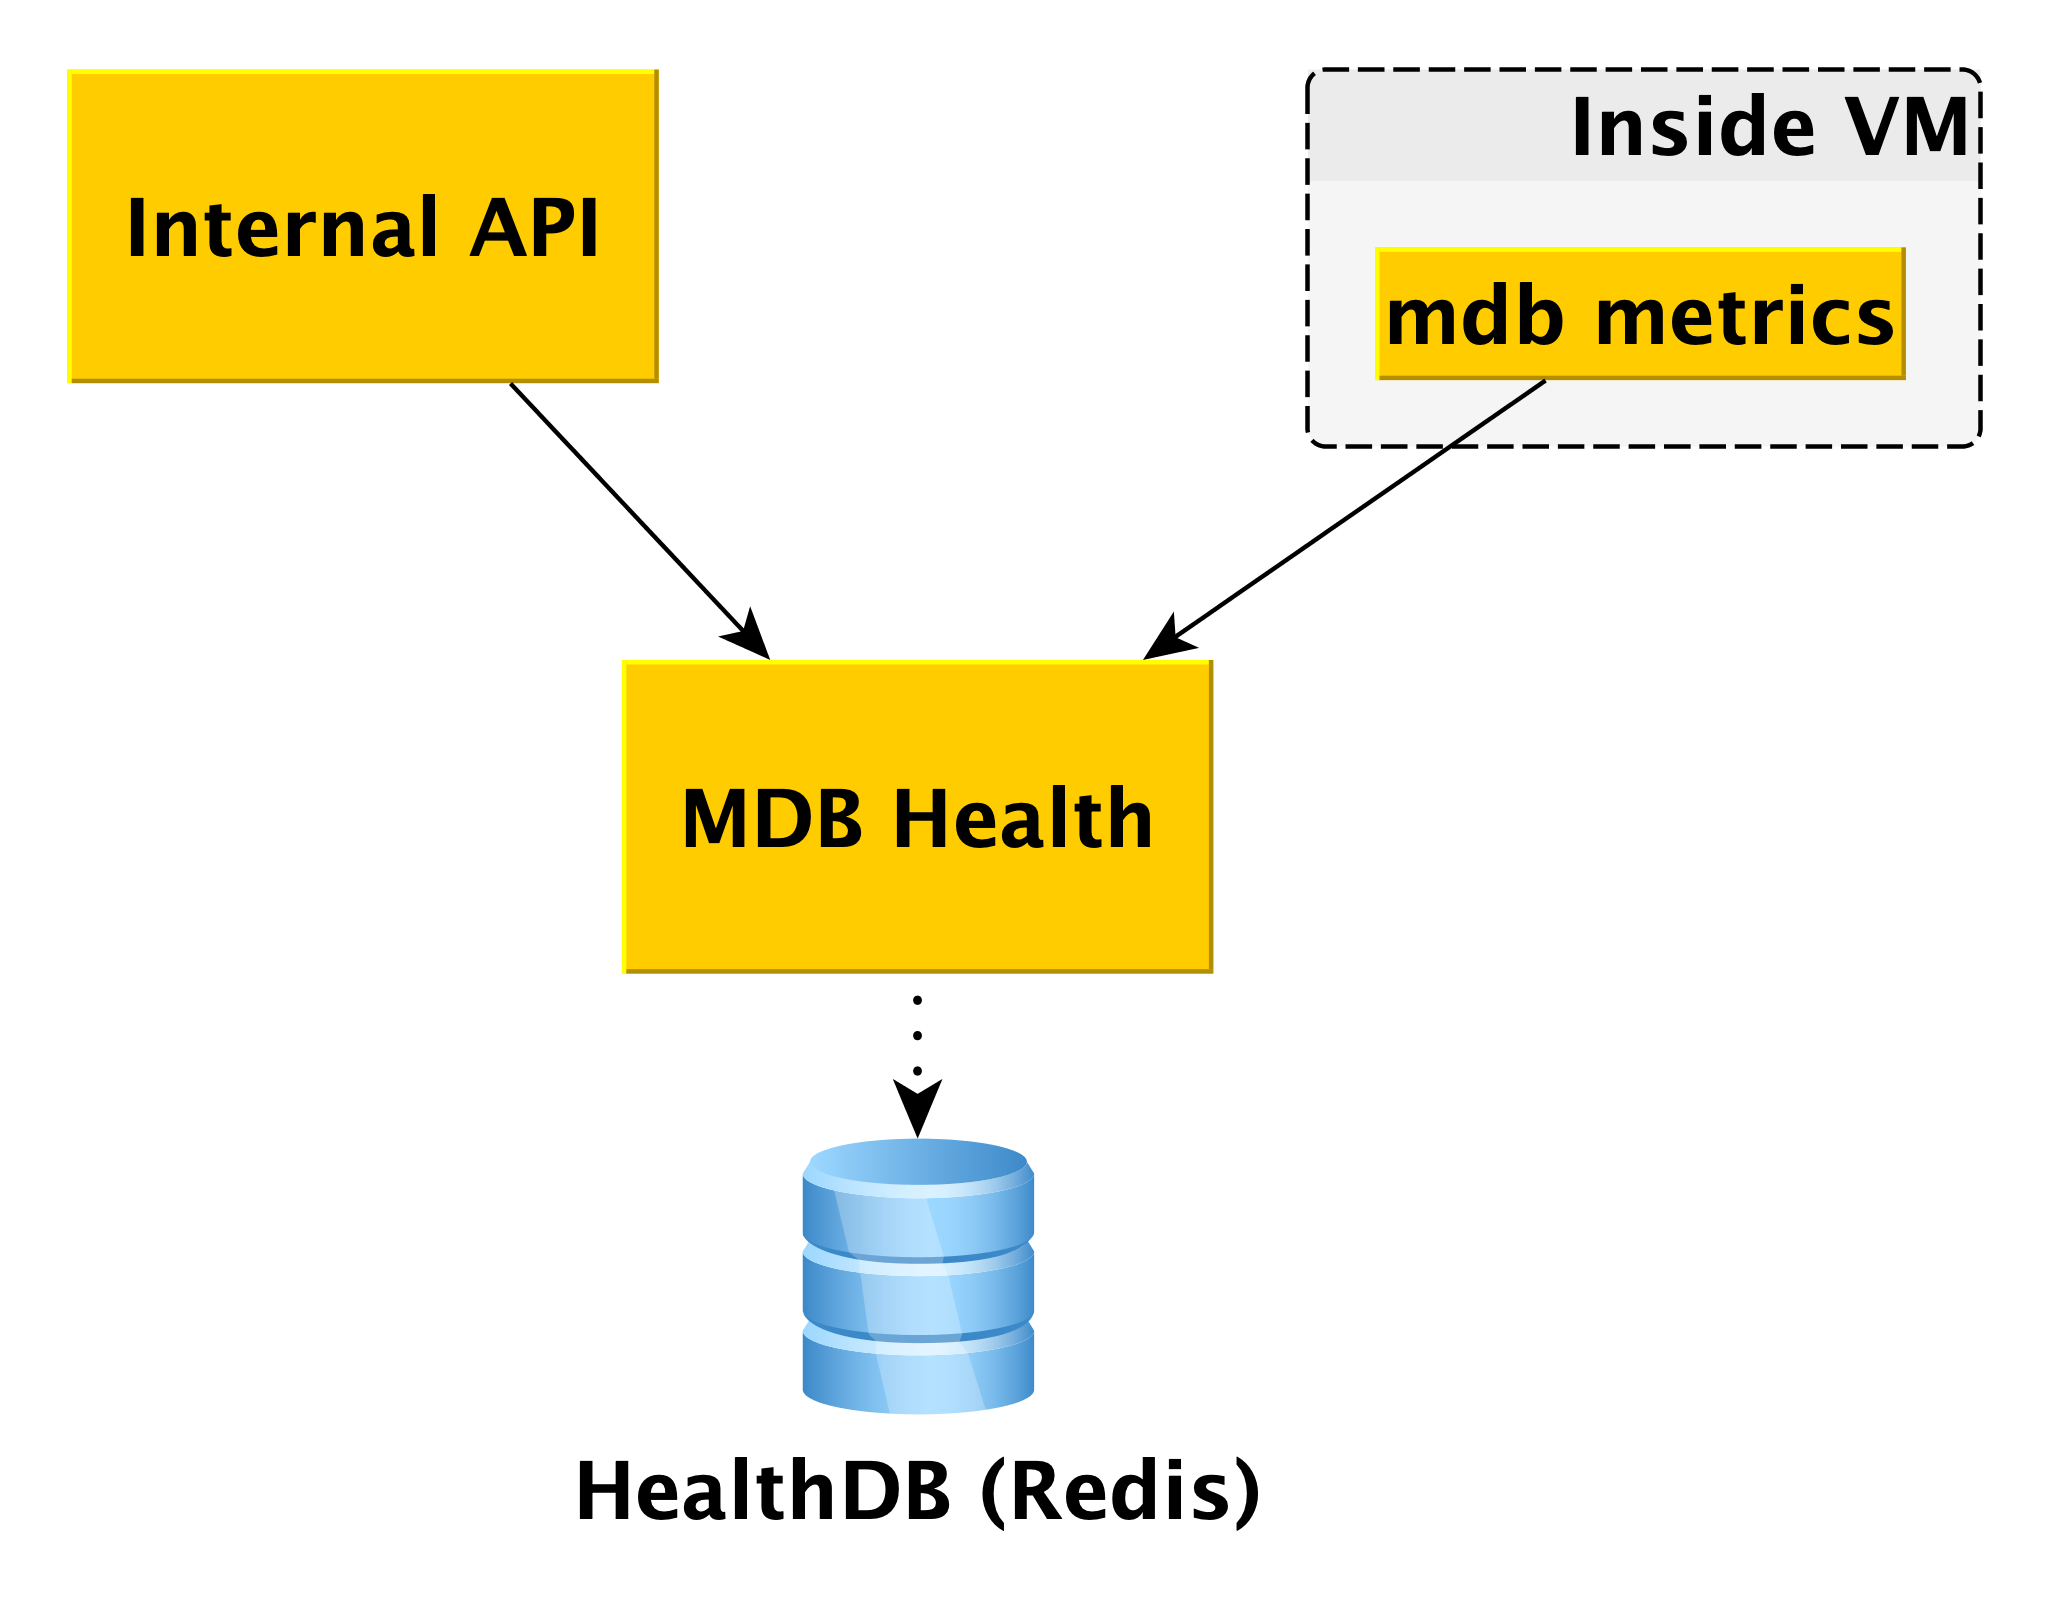
Information on all hosts is processed and presented in an understandable form in the API. In addition to the state of hosts and clusters for some DBMSs, MDB Health additionally returns whether a particular host is a master or a replica.
MDB DNS
The MDB DNS microservice is needed to manage CNAME records. If the driver for connecting to the database does not allow transferring several hosts in the connection string, you can connect to a special CNAME , which always indicates the current master in the cluster. If the master switches, the CNAME changes.
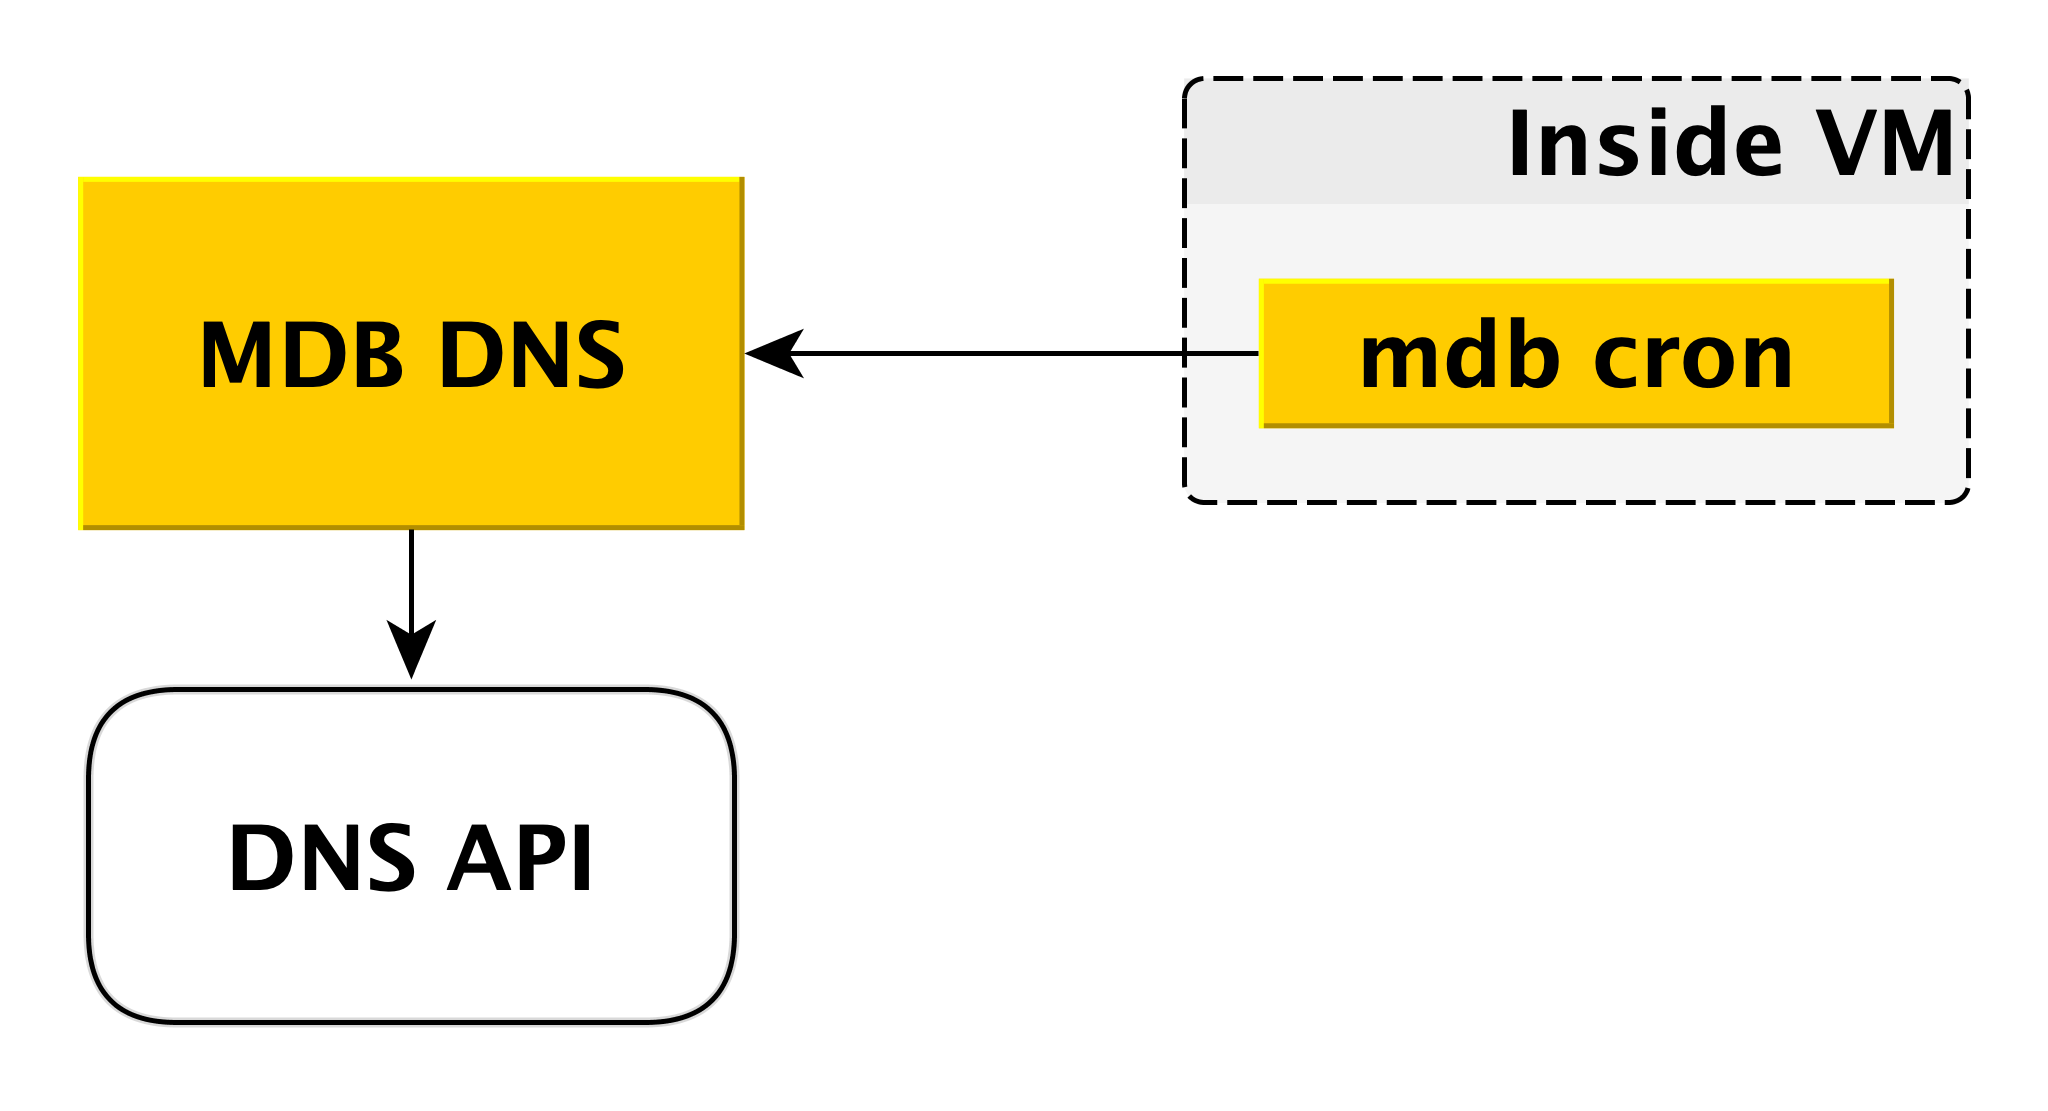
How does this happen? As we said above, inside the virtual machine there is an MDB cron, which periodically sends a heartbeat with the following contents to the MDB DNS: “In this cluster, the CNAME record must point to me.” MDB DNS accepts such messages from all virtual machines and decides whether to change CNAME records. If necessary, it changes the record through the DNS API.
Why did we make a separate service for this? Because the DNS API has access control only at the zone level. A potential attacker, having gained access to a separate virtual machine, could have changed CNAME records of other users. MDB DNS excludes this scenario because it checks for authorization.
Delivery and display of database logs
When the database on the virtual machine writes to the log, the special push client component reads this record and sends the line that has just appeared to Logbroker ( they already wrote about it on Habré). The push client interaction with LogBroker is built with exactly-one semantics: we will definitely send it and it will be obligatory strictly once.
A separate pool of machines - LogConsumers - takes logs from the LogBroker queue and stores them in the LogsDB database. ClickHouse DBMS is used for the log database.
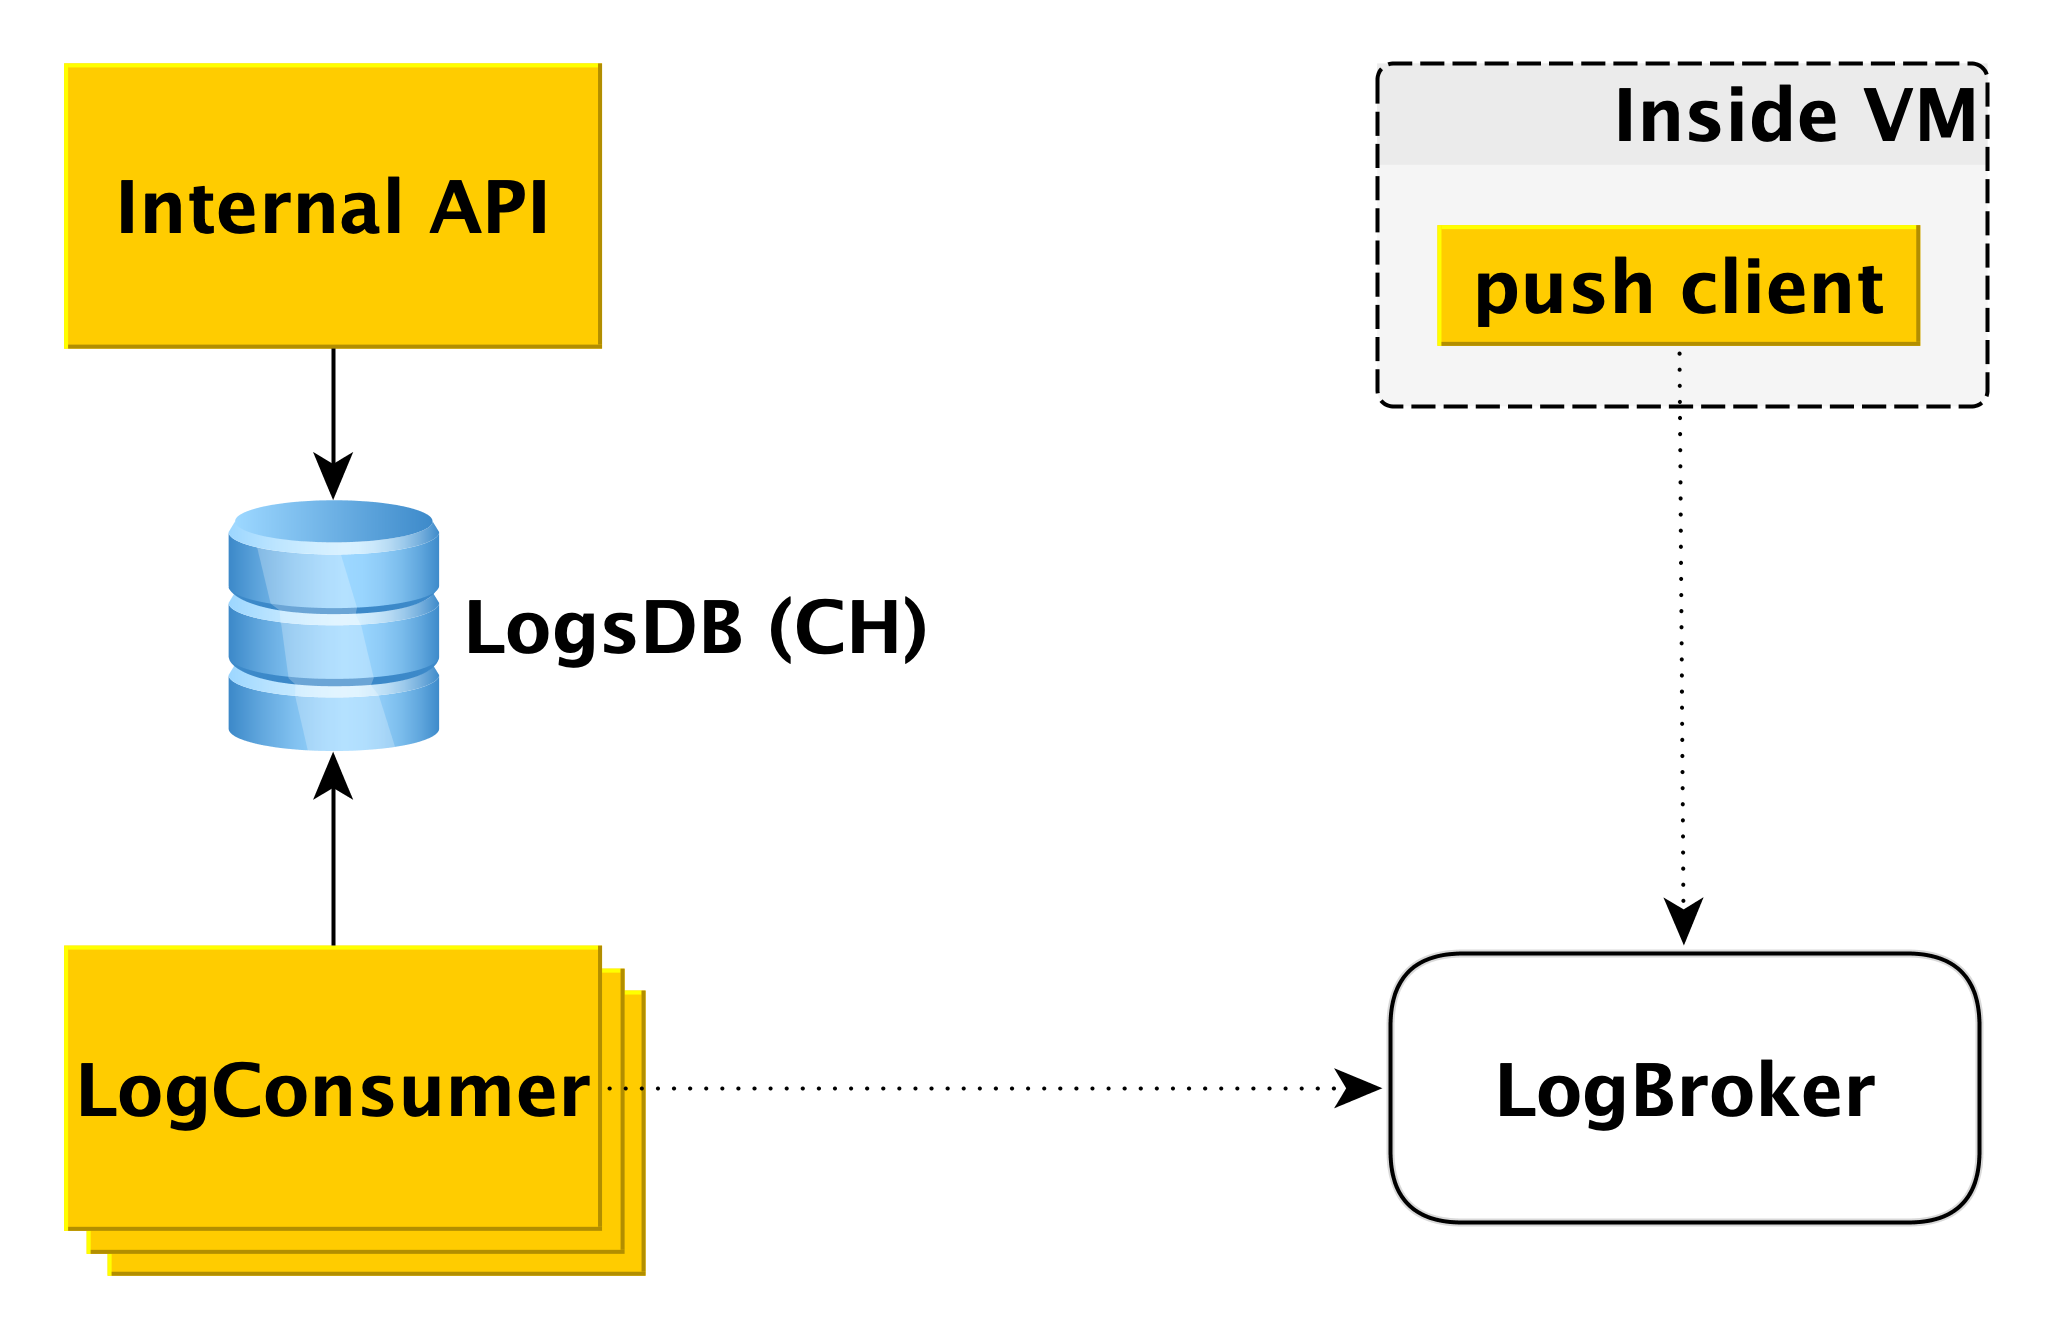
When a request is sent to the Internal API to display logs for a specific time interval for a particular cluster, the Internal API checks the authorization and sends the request to LogsDB. Thus, the log delivery loop is completely independent of the log display loop.
Billing
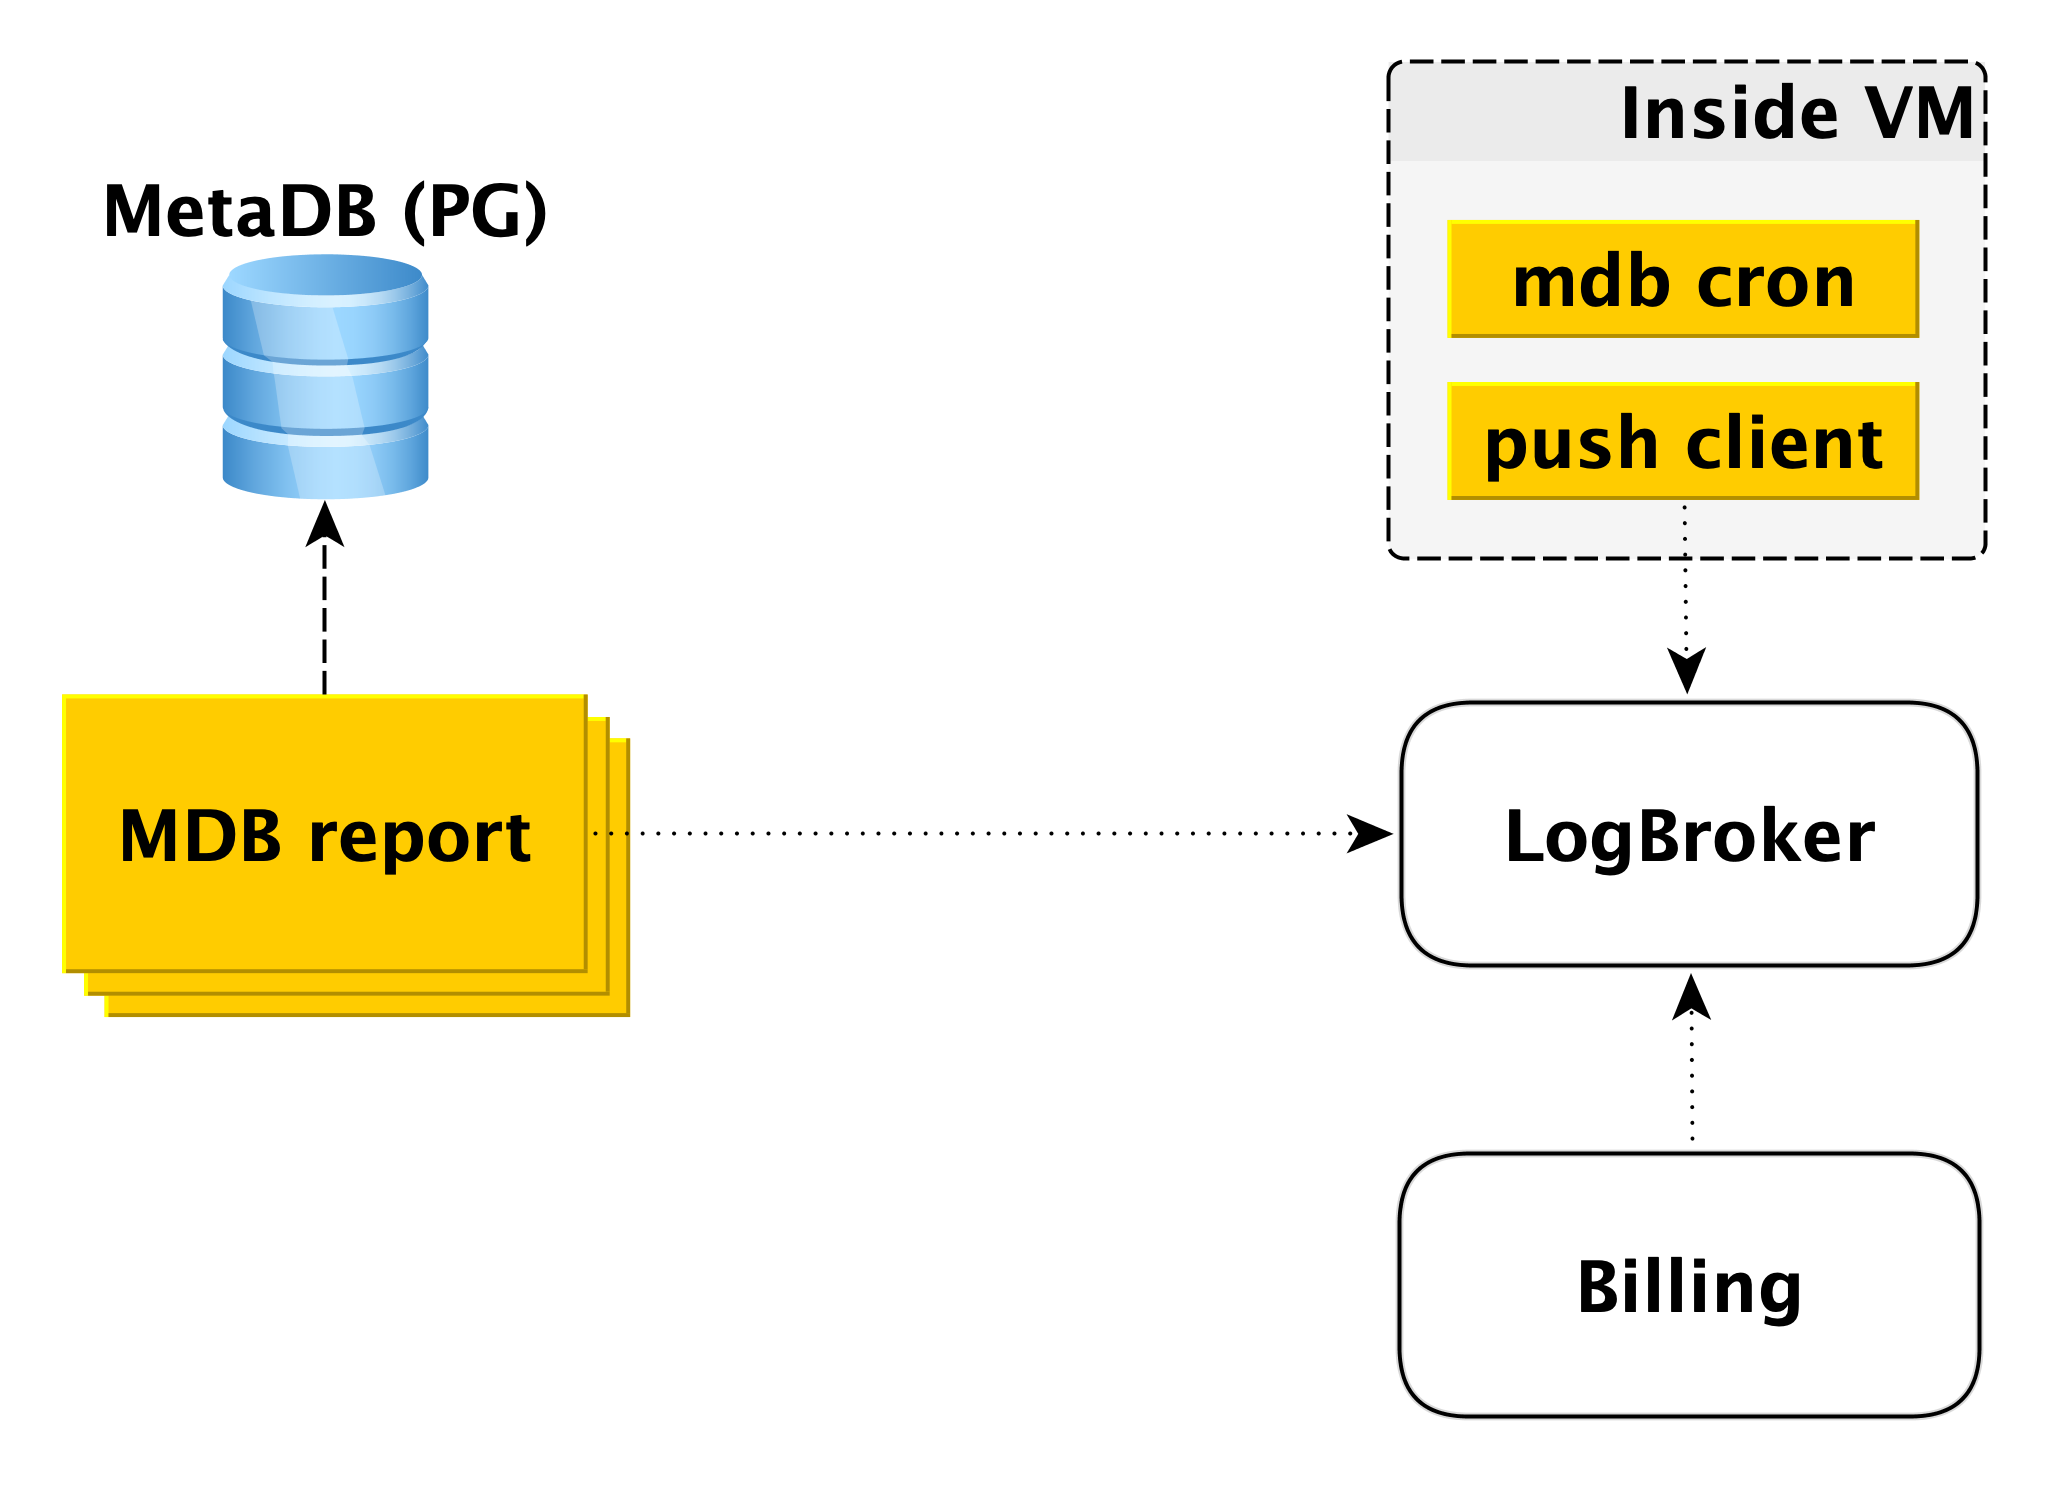
The billing scheme is built in a similar way. Inside the virtual machine, there is a component that checks with a certain periodicity that everything is in order with the database. If all is well, you can carry out billing for this time interval since the last launch. In this case, a record is made in the billing log, and then the push client sends the record to LogBroker. Data from Logbroker is transferred to the billing system and calculations are made there. This is a billing scheme for running clusters.
If the cluster is turned off, the use of computing resources ceases to be charged, however, disk space is charged. In this case, it is impossible to bill from the virtual machine and the second circuit is activated - the offline billing circuit. There is a separate pool of machines that rake the list of shutdown clusters from MetaDB and write a log in the same format in Logbroker.
Offline billing could be used for billing and included clusters too, but then we will billing hosts, even if they are running, but do not work. For example, when you add a host to a cluster, it deploys from the backup and catches up with replication. It’s wrong to bill the user for this, because the host is inactive for this period of time.
Backup
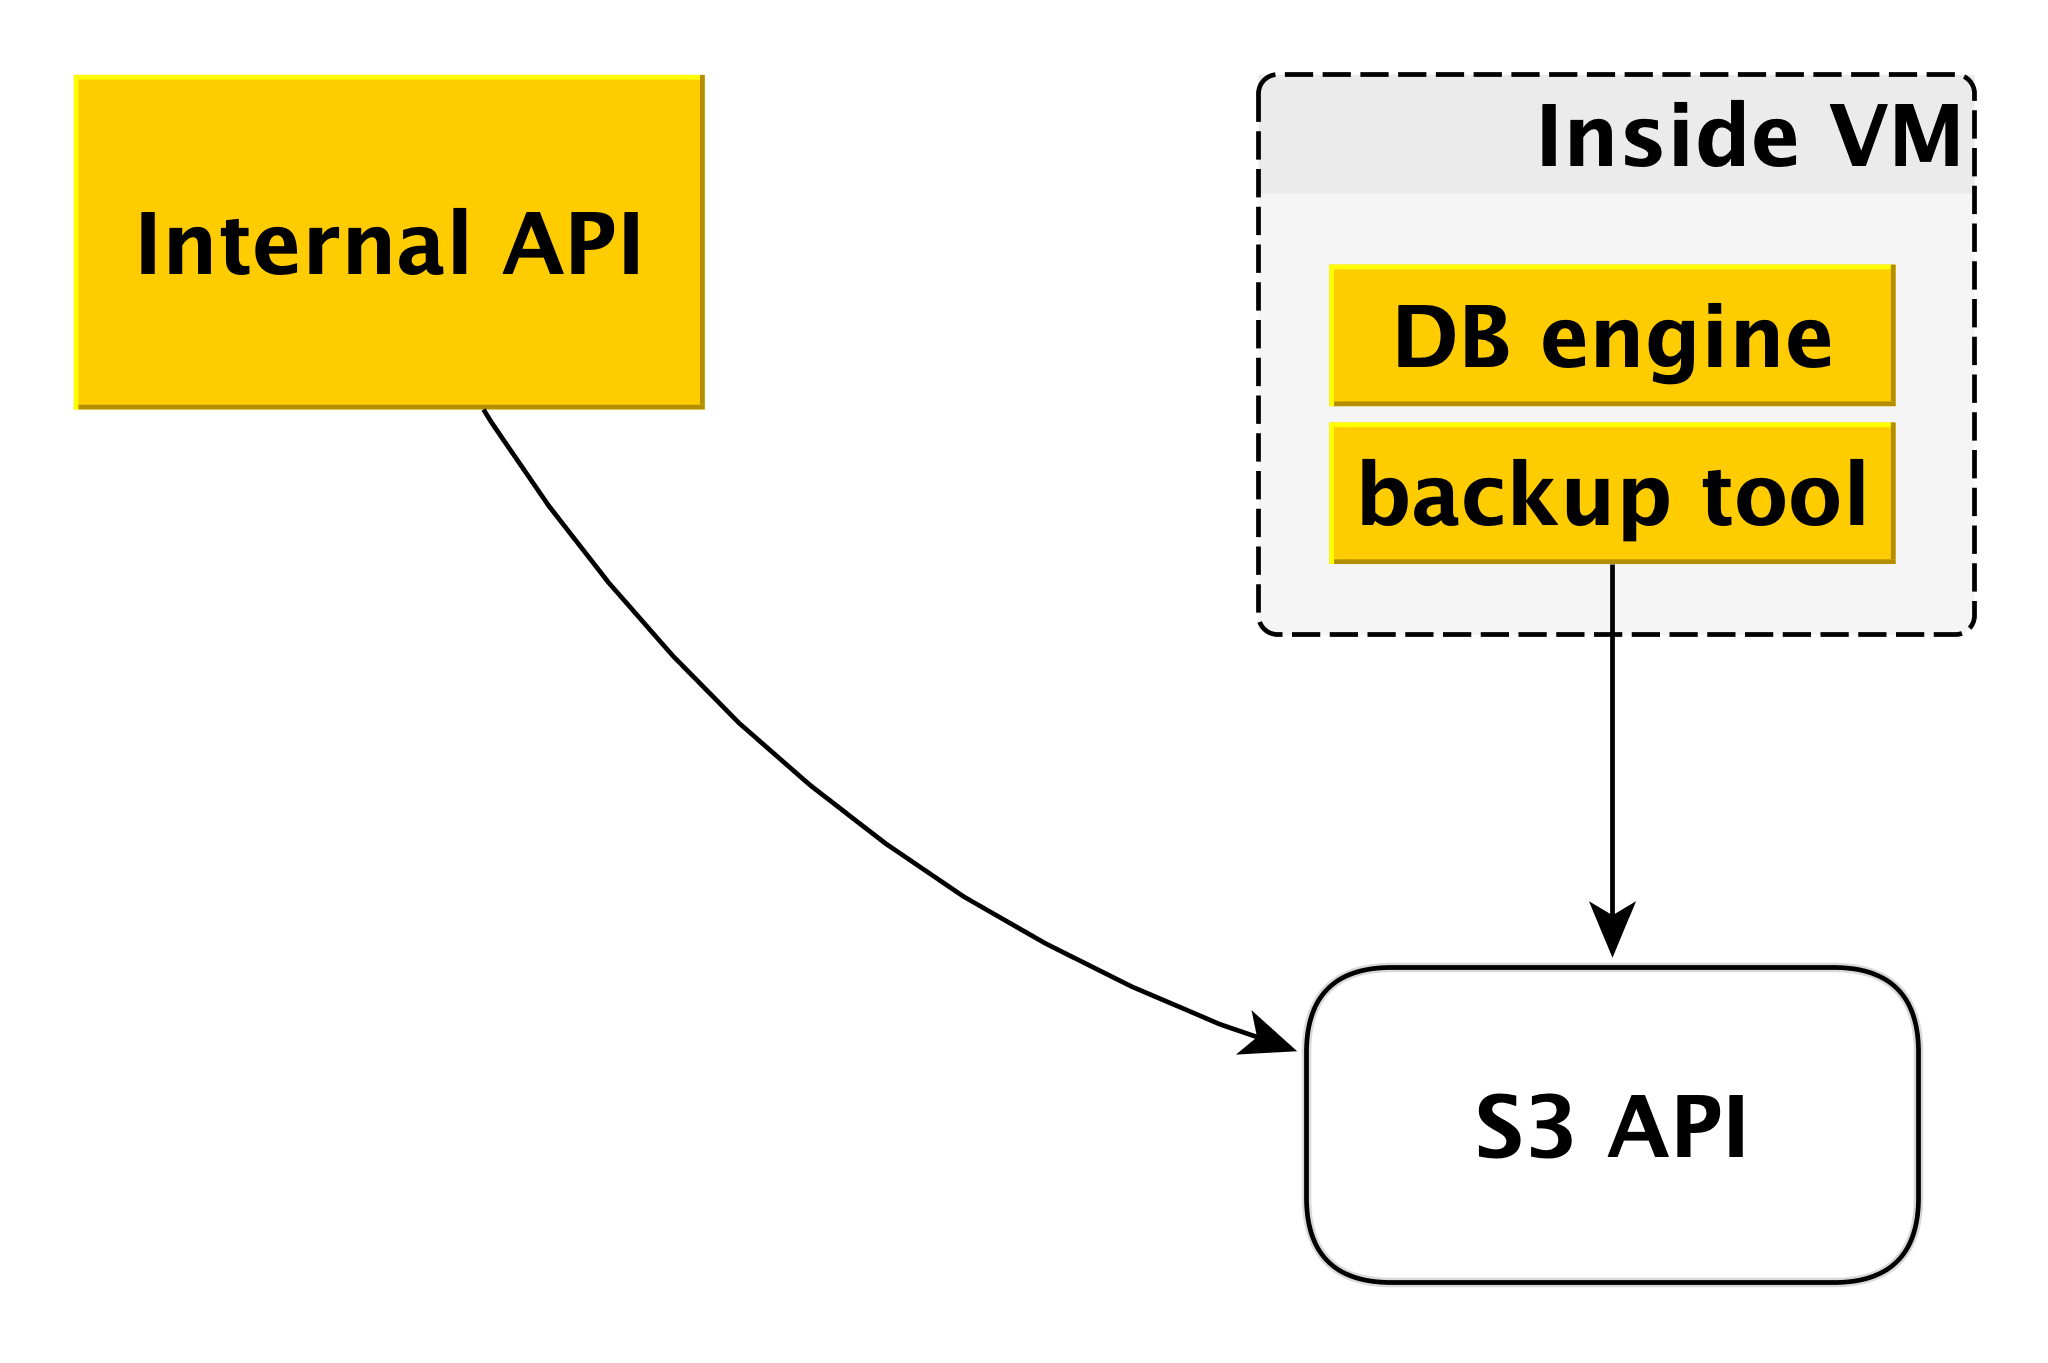
The backup scheme may differ slightly for different DBMSs, but the general principle is always the same.
Each database engine uses its own backup tool. For PostgreSQL and MySQL, this is WAL-G . It creates backups, compresses them, encrypts them and puts them in Yandex Object Storage . At the same time, each cluster is placed in a separate bucket (firstly, for isolation, and secondly, to make it easier to save space for backups) and is encrypted with its own encryption key.
This is how Control Plane and Data Plane work. From all this, the service of Yandex.Cloud managed databases is formed.
Why is everything arranged this way
Of course, at the global level, something could be implemented according to simpler schemes. But we had our own reasons not to follow the path of least resistance.
First of all, we wanted to have a common Control Plane for all types of DBMS. It doesn't matter which one you choose, in the end your request comes to the same Internal API and all the components under it are also common to all DBMSs. This makes life a bit more difficult for us in terms of technology. On the other hand, it’s much easier to introduce new features and capabilities that affect all DBMSs. This is done once, not six.
The second important moment for us - we wanted to ensure the independence of the Data Plane from the Control Plane as much as possible. And today, even if Control Plane is completely unavailable, all databases will continue to work. The service will ensure their reliability and availability.
Thirdly, the development of almost any service is always a compromise. In a general sense, roughly speaking, somewhere more important is the speed of release of releases, and somewhere additional reliability. At the same time, now no one can afford to do one or two releases a year, this is obvious. If you look at Control Plane, here we focus on the speed of development, on the quick introduction of new features, rolling out updates several times a week. And Data Plane is responsible for the safety of your databases, for fault tolerance, so here is a completely different release cycle, measured in weeks. And this flexibility in terms of development also provides us with their mutual independence.
Another example: usually managed database services provide users with only network drives. Yandex.Cloud also offers local drives. The reason is simple: their speed is much higher. With network drives, for example, it is easier to scale the virtual machine up and down. It is easier to make backups in the form of snapshots of network storage. But many users need high speed, so we make backup tools a level higher.
Future plans
And a few words about plans to improve the service for the medium term. These are plans that affect the entire Yandex Managed Databases as a whole, rather than individual DBMSs.
First of all, we want to give more flexibility in setting the frequency of backup creation. There are scenarios when it is necessary that during the day backups are made once every few hours, during the week - once a day, during the month - once a week, during the year - once a month. To do this, we are developing a separate component between the Internal API and Yandex Object Storage .
Another important point, important for both users and us, is the speed of operations. We recently made major changes to the Deploy infrastructure and reduced the execution time of almost all operations to a few seconds. Not covered were only the operations of creating a cluster and adding a host to the cluster. The execution time of the second operation depends on the amount of data. But the first one we will speed up in the near future, because users often want to create and delete clusters in their CI / CD pipelines.
Our list of important cases includes the addition of the function to automatically increase the size of the disk. Now this is done manually, which is not very convenient and not very good.
Finally, we offer users a huge number of graphs showing what is happening with the database. We give access to the logs. At the same time, we see that data is sometimes insufficient. Need other graphics, other slices. Here we also plan to improve.
Our story about the managed database service was long and probably quite tedious. Better than any words and descriptions, only real practice. Therefore, if you want, you can independently evaluate the capabilities of our services: