In my company, I often encounter that you need to raise some kind of service in order to "pick up" it thoroughly. Although PCshniks are quite powerful, PyCharm and Chrome eat up most of the resources, and very little remains on virtual machines with experiments.
Therefore, we got a small rack with a couple of servers for experiments and local Gitlab. But something went wrong and really wanted to play with something new.
Disclaimer
I am far from being a journalist, so please forgive me in advance for possible errors in the text. Although I ran through the text, I could still miss something. Always open for corrections in a personal message.
Among other things, "they don’t argue about tastes" and I do not advertise anything, but just want to share how we solved our problem. Well, of course, all this could be done differently, but I wanted it that way.
Lyrics
At one time, since our customers often had OpenStack, we also successfully deployed it to combine pain and tears testing some products with others.
But the problem is that the office! = DC and we were lucky to rent an office in a place where the light is cut out stably every 2-3 months, moreover, they do it at night until no one sees it. Have you tried raising the OpenStack cluster after a power failure? And in general, the product is clearly not tailored to our needs (although it is very convenient to raise 5-10 nodes or deploy ansible'm whole infrastructure).
It was also very disappointing to eat the resources of a simply working cluster (actually 2-3 servers with 4CPU / 16GbRAM purely for an empty cluster) and the need to keep the controller separate from the compute node so as not to interfere with work (AIO eats up to a simple 35GB RAM - it’s somehow too much for a server in the office).
Of course, everything could be taken out in AWS / DO / Azure / GCE, but if there are 3-4 servers, then why not use them, because anyway the existing equipment will come out cheaper than the "cloud".
Equipment
Actually about iron:
- Floor cabinet KRAULER KRC6832
- 4U HITACHI HA8000 / RS440 (AG) 4x Intel Xeon X7460 (6C / 6T) / 160GB / 4x Memory Raiser / 4x 2.5 "HDD 1TB SATA + 4x 2.5" HDD 0.5TB SATA / LSI RAID 0-1-5-6 / 6xGLAN / 2xPSU 1570W (I don’t know why there are such PSUs, if he never ate more than 500W under full load)
- APC Smart-UPS 3000VA RM 2U UPS
- Mikrotik Cloud Router Switch 125-24G-1S-RM (this is not the core of the office infrastructure - it's just a rack)
- SSD WD Blue 500Gb SATA
Among other things, there are:
- 1U Server Fujitsu RX100S6 Intel Core i3-540 / 16 GB DDR-3 ECC / 2x 3.5 "HDD 147Gb SAS / LSI Raid 0-1 / 2xGlan / PSU 250W (which runs Gitlab CE)
- 1U Nec Express 5800 / R110c server with Intel Xeon X3430 on board and specifications as in item 1 (on which the Gitlab CI runner is spinning).
- A pair of UPSs at 1200VA.
The last 2 servers were successfully occupied after another sudden night power failure led Ceph in OpenStack to become unusable and it was decided to transfer them to independent nodes. However, nothing prevents them from later being transferred to VM.
HITACHI generally 2 pieces, but we loaded everything into one machine and later I will explain why.
I paint in such detail, just to make the decision clear.
Flour of choice
The main problem with OpenStack was that AIO was too voracious and competed with virtual machines, and spread over the hosts ... In short, vanilla OpenStack, no matter how we liked it, but did not fit our needs and capabilities.
It would be logical to assume that it might be worth switching to VMWare ESXi (as many comrades have suggested). But my soul didn’t lie with this product ...
It was necessary that it would be possible to customize well to our needs (somewhere in the intersection is cheap, productive and flexible), as well as to make it convenient for simple developers who do not want to configure anything, but only do "fi-fi-fi-fi" coding and experimenting.
The choice fell on Proxmox VE, because:
- This is debian, albeit on "steroids", which means it will be easier to figure out + customize.
- There are both KVM and simple LXC containers, which are much more economical in terms of resources.
- In a completely free edition, it can expand into a cluster.
- Dofigallion of various storages (lvm thin, Ceph, GlusterFS, NFS, etc.)
- 100% support of the equipment on which we will put.
Configuring Proxmox
The publication further describes how I configured the infrastructure of the server only with Proxmox in almost live mode. Gitlab server migration is not described in any way, because it has nothing to do with this topic.
Network and Router
There is some legacy after OpenStack for slicing the network, in particular the public network and OSPF settings on Mikrotiks. I wanted the following:
- Ensure isolation of the server’s internal network from the public network into which virtual machines will go.
- Use Mikrotik as the primary router, DNS and ntp for the rack.
- Use all 6 server interfaces both for access and for the release of virtual machines "to the light."
I will describe how to do it from scratch:
- We drive all the interfaces into the bridge (we believe that the configuration occurs from the 2nd port):
/interface bridge add name=bridge1 protocol-mode=none /interface bridge port add bridge=bridge1 interface=ether1 trusted=yes add bridge=bridge1 interface=ether2 add bridge=bridge1 interface=ether3 add bridge=bridge1 interface=ether4 add bridge=bridge1 interface=ether5 add bridge=bridge1 interface=ether6 add bridge=bridge1 interface=ether7 add bridge=bridge1 interface=ether8 add bridge=bridge1 interface=ether9 add bridge=bridge1 interface=ether10 add bridge=bridge1 interface=ether11 add bridge=bridge1 interface=ether12 add bridge=bridge1 interface=ether13 add bridge=bridge1 interface=ether14 add bridge=bridge1 interface=ether15 add bridge=bridge1 interface=ether16 add bridge=bridge1 interface=ether17 add bridge=bridge1 interface=ether18 add bridge=bridge1 interface=ether19 add bridge=bridge1 interface=ether20 add bridge=bridge1 interface=ether21 add bridge=bridge1 interface=ether22 add bridge=bridge1 interface=ether23 add bridge=bridge1 interface=ether24 add bridge=bridge1 interface=sfp1
- We configure OSPF Mikrotik over the network 10.20.0.0/24 (then we will forbid us to go to the internal network by firewall rules):
/ip address add address=10.20.0.254/24 interface=bridge1 network=10.20.0.0 /ip route add check-gateway=ping distance=1 gateway=10.20.0.1 /routing ospf network add area=local network=10.20.0.0/24 /routing ospf instance set [ find default=yes ] redistribute-connected=as-type-2 \ redistribute-static=as-type-2 router-id=10.20.0.254
- We configure VLAN100 for a public network + DHCP server:
/interface vlan add interface=bridge1 name=public_rack vlan-id=100 /ip address add address=172.16.0.1/16 interface=public_rack network=172.16.0.0 /ip pool add name=public_rack_dhcp_pool1 ranges=172.16.253.1-172.16.253.254 add name=public_rack_dhcp_pool0 next-pool=public_rack_dhcp_pool1 ranges=\ 172.16.254.1-172.16.254.254 /ip dhcp-server add add-arp=yes address-pool=public_rack_dhcp_pool0 disabled=no interface=\ public_rack lease-time=1h name=public_rack_dhcp /ip dhcp-server network add address=172.16.0.0/16 dns-server=172.16.0.1 domain=domain.lan\ gateway=172.16.0.1 ntp-server=172.16.0.1 /ip dns set allow-remote-requests=yes cache-size=4096KiB max-concurrent-queries=400 \ max-concurrent-tcp-sessions=80 query-server-timeout=10s \ query-total-timeout=1m40s servers=10.20.0.1
- We configure Firewall rules so that access is only to the following router:
/ip firewall filter add action=drop dst-address=10.20.0.0/24 in-interface=public_rack add action=drop dst-address=10.20.0.0/24 src-address=172.16.0.0/24 in-interface=bridge1 add action=accept dst-address=10.20.0.1 in-interface=public_rack
This is not to say that this is a very correct rule, but if one of the experts tells you how to write it correctly, I will be very grateful. In general, we need isolation only on L2, but on L3 I bring more for familiarization.
Server Tuning
The server will be tuned to get maximum performance from current drives. However, we do not forget that everything can happen and at night the light can abruptly disappear for an hour or two while everyone is sleeping.
- We install all drives except the SSD in the basket.
- We connect the SSD via a slide instead of a drive.
- We connect all LAN ports to Mikrotik.
- Configure RAID with writethrough cache:
- 4x 1TB in RAID 10
- 4x 500GB in RAID 10
- We make both arrays bootable.
- Install Proxmox VE 6 on the first array and first interface (take from here ).
- Assign the address 10.20.0.10/24
- When the installation is complete, we reboot.
Since we do not want to buy anything, we should disable everything related to the subscription:
- Delete popup when entering the GUI (valid for versions> = 5.1):
sed -i.bak "s/data.status !== 'Active'/false/g" /usr/share/javascript/proxmox-widget-toolkit/proxmoxlib.js && systemctl restart pveproxy.service
- We switch to the repository for economical people by replacing the line in the file:
# deb https://enterprise.proxmox.com/debian/pve buster pve-enterprise deb http://download.proxmox.com/debian/pve buster pve-no-subscription
This is where we finish the basic setup.
The magic of network interfaces
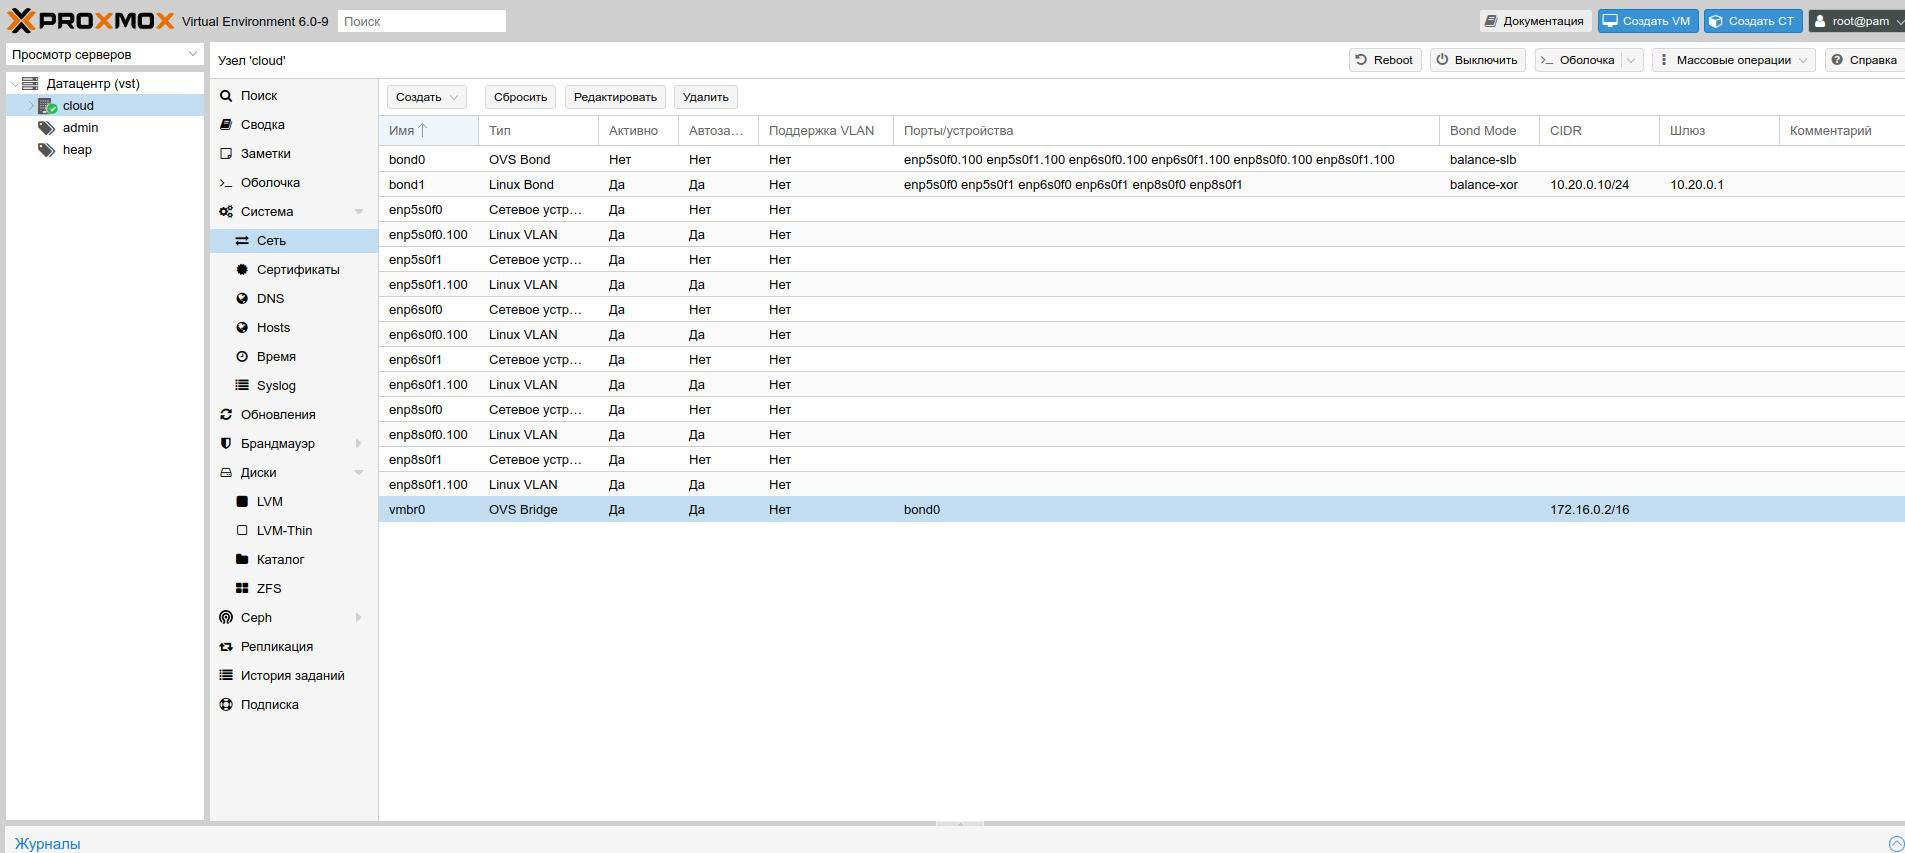
In general, setting up Proxmox Bridge to work is quite simple. But I'm not me, if not I will remove tonsils rectally I’ll do something extravagant. I really wanted OVSBridge to work for OVSBond as well. But the problem is that I also would not want users to assign VLANs every time they create VM / LXC. Therefore, the setup procedure is as follows for all 6 interfaces:
- Install the Open vSwitch package:
apt install openvswitch-switch -y
- We edit the file
/etc/network/interfaces
as follows:
# OVSBond vlan- allow-vmbr0 bond0 iface bond0 inet manual ovs_bonds enp5s0f0.100 enp5s0f1.100 enp6s0f0.100 enp6s0f1.100 enp8s0f0.100 enp8s0f1.100 ovs_type OVSBond ovs_bridge vmbr0 ovs_options vlan_mode=native-untagged bond_mode=balance-slb auto lo iface lo inet loopback iface enp5s0f0 inet manual iface enp5s0f1 inet manual iface enp6s0f0 inet manual iface enp6s0f1 inet manual iface enp8s0f0 inet manual iface enp8s0f1 inet manual # OVSBond vlan- auto enp5s0f0.100 iface enp5s0f0.100 inet manual auto enp5s0f1.100 iface enp5s0f1.100 inet manual auto enp6s0f0.100 iface enp6s0f0.100 inet manual auto enp6s0f1.100 iface enp6s0f1.100 inet manual auto enp8s0f0.100 iface enp8s0f0.100 inet manual auto enp8s0f1.100 iface enp8s0f1.100 inet manual # bond " ". # , Ceph ( ). auto bond1 iface bond1 inet static address 10.20.0.10 netmask 24 bond-slaves enp5s0f0 enp5s0f1 enp6s0f0 enp6s0f1 enp8s0f0 enp8s0f1 bond-miimon 100 bond-mode balance-xor bond-xmit-hash-policy layer2+3 # VLAN100 allow-ovs vmbr0 iface vmbr0 inet static address 172.16.0.2 netmask 16 gateway 172.16.0.1 ovs_type OVSBridge ovs_ports bond0
Configure LVM + lvmcache
First of all, delete the old pve/data
so as not to get confused with the meta section, etc.
lvremove pve/data
Add the second section to our volume group:
pvcreate /dev/sdb vgextend pve /dev/sdb
We create a new section as the Proxmox documentation teaches us + a small hack for optimizing snapshots:
lvcreate -L 2.4T -n data pve lvconvert --type thin-pool -c 64K --poolmetadatasize 15.81G pve/data
Now we need to connect lvmcache, but in order to optimize the SSD resource, I deliberately allocated a 241GB partition on it. This amount is enough for the cache, and the rest of the disk will be a resource for dead blocks. True, this is in theory, because I personally do not fully understand if this works. In any case, the 465GB cache will then be twice as long and more difficult to delete (for example, to replace a disk or expand an array).
vgextend pve /dev/sdc1 lvcreate --type cache-pool -L240G pve /dev/sdc1 lvconvert --type cache --cachepool pve/lvol1 pve/data
UPD: there is one glitch with dm_cache
, because of which you need to do one more magic:
apt install thin-provisioning-tools -y echo "dm_cache" >> /etc/initramfs-tools/modules echo "dm_cache_mq" >> /etc/initramfs-tools/modules echo "dm_persistent_data" >> /etc/initramfs-tools/modules echo "dm_bufio" >> /etc/initramfs-tools/modules update-initramfs -k `uname -r` -u -t update-grub
At first, everything worked, but then for some reason it stopped. Apparently with the update, these modules were deleted.
Final touches
I usually do it before rebooting to be sure that everything is updated and the kernel is the latest:
apt update && apt dist-upgrade -y && apt autoremove -y pveam update
By the way, in the 6th version the kernel is 5.0, and on the way (at the time of publication) it seems like 5.3.7.
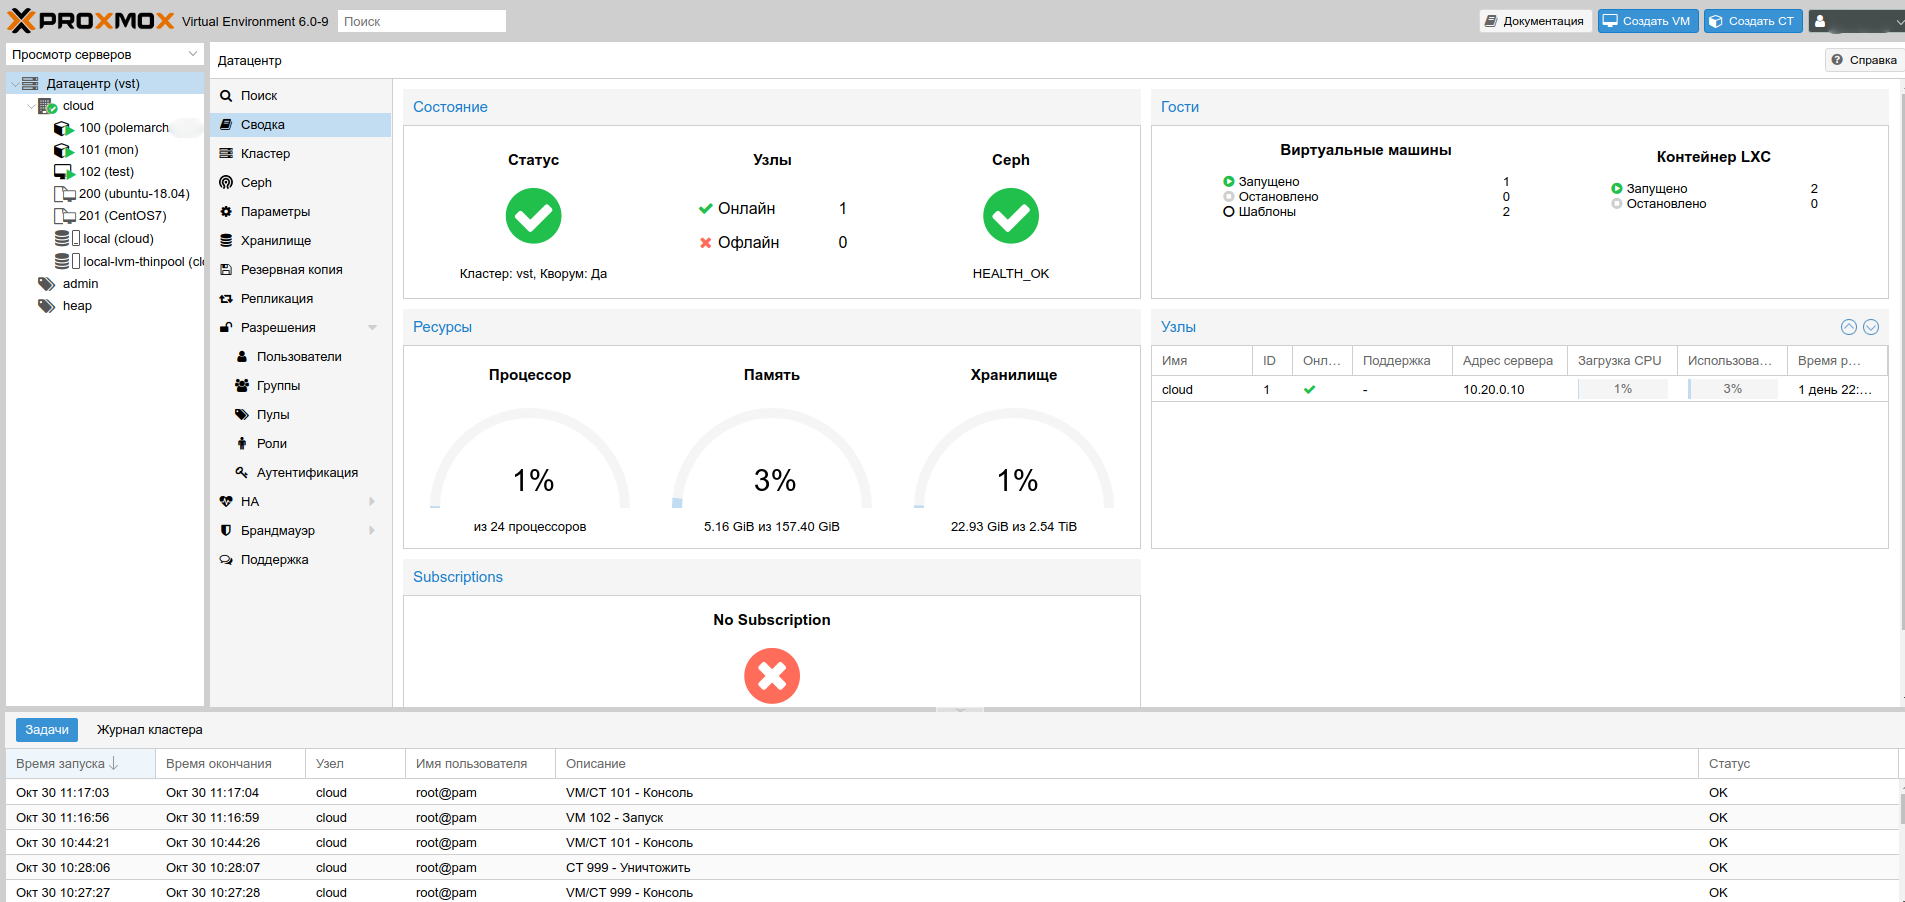
That's it, now we are sending the system to reboot. If we did everything right, then after a reboot, our server will be accessible externally at both addresses. You can also download fresh container templates and enjoy life.
We make beautiful graphics
Well, we are not just admins, but DevOps (what does this even mean?), So we need to know when some of the virtual machines will go wild and do some bad things.
Container with InfluxDB and Grafana
In general, all these actions are easiest to do in the GUI, but I was suddenly attacked by an aggressive form of laziness to take screenshots, so I will describe it with commands.
We look at the templates available to us:
root@cloud:~# pveam available --section system system alpine-3.10-default_20190626_amd64.tar.xz system alpine-3.9-default_20190224_amd64.tar.xz system archlinux-base_20190924-1_amd64.tar.gz system centos-6-default_20191016_amd64.tar.xz system centos-7-default_20190926_amd64.tar.xz system centos-8-default_20191016_amd64.tar.xz system debian-10.0-standard_10.0-1_amd64.tar.gz system debian-8.0-standard_8.11-1_amd64.tar.gz system debian-9.0-standard_9.7-1_amd64.tar.gz system fedora-29-default_20181126_amd64.tar.xz system fedora-30-default_20190718_amd64.tar.xz system gentoo-current-default_20190718_amd64.tar.xz system opensuse-15.0-default_20180907_amd64.tar.xz system opensuse-15.1-default_20190719_amd64.tar.xz system ubuntu-16.04-standard_16.04.5-1_amd64.tar.gz system ubuntu-18.04-standard_18.04.1-1_amd64.tar.gz system ubuntu-19.04-standard_19.04-1_amd64.tar.gz system ubuntu-19.10-standard_19.10-1_amd64.tar.gz
I think for starters you can download ubuntu-18.04-standard_18.04.1-1_amd64.tar.gz
:
root@cloud:~# pveam download local ubuntu-18.04-standard_18.04.1-1_amd64.tar.gz root@cloud:~# pveam list local NAME SIZE local:vztmpl/ubuntu-18.04-standard_18.04.1-1_amd64.tar.gz 203.54MB
Create a container for InfluxDB and Grafana:
root@cloud:~# pct create 999 local:vztmpl/ubuntu-18.04-standard_18.04.1-1_amd64.tar.gz --cores 2 --memory 2048 --password hostpassword --onboot 1 --net0 name=eth0,bridge=vmbr0,gw=172.16.0.1,ip=172.16.1.101/24 --storage local-lvm --hostname monit
We are connected to the terminal of our ssh root@172.16.1.101
by ssh root@172.16.1.101
or through pct console 999
.
Install InfluxDB and Grafana packages:
apt update && apt install curl wget gnupg software-properties-common -y add-apt-repository "deb https://packages.grafana.com/oss/deb stable main" echo "deb https://repos.influxdata.com/ubuntu bionic stable" | tee /etc/apt/sources.list.d/influxdb.list curl -sL https://repos.influxdata.com/influxdb.key | apt-key add - wget -q -O - https://packages.grafana.com/gpg.key | apt-key add - apt update && apt install influxdb grafana -y systemctl daemon-reload systemctl enable grafana-server systemctl start grafana-server systemctl enable influxdb systemctl start influxdb
We configure InfluxDB for work. To do this, we will first need to create a database:
influx > CREATE DATABASE proxmox > quit
Next, we need to configure the UDP port to which Proxmox will send requests:
# , . [[udp]] enabled = true bind-address = "0.0.0.0:8089" database = "proxmox" batch-size = 1000 batch-timeout = "1s"
... and now restart influx: systemctl restart influxdb
Configuring Proxmox and Dashboard
Everything is extremely simple here. On a server with proxmox, you need to create a file with the following contents:
influxdb: influx1 server 172.16.1.101 port 8089
There is no file by default there.
For some unknown reason, the metrics did not go right away, so I had to call systemctl restart pvestatd
on the proxy server.
Now we need to visualize all this. We go to our grafana at the address http://172.16.1.101 {000/ (admin: admin), change the password.
I found graphans in the wilds of the site that you can screw a beautiful dashboard to render Proxmox, but it had a little file fix to take into account all our realities.
- Go to Configuration -> Data Sources -> Add data source , select InfluxDB .
- Check the
default
box. - Fill in the URL :
http://localhost:8086
. - We fill in Database :
proxmox
. - Save.
Now we need to import the Dashboard:
- Go to Create -> Import .
- We insert there:
{ "annotations": { "list": [ { "builtIn": 1, "datasource": "-- Grafana --", "enable": true, "hide": true, "iconColor": "rgba(0, 211, 255, 1)", "name": "Annotations & Alerts", "type": "dashboard" } ] }, "description": "Display data from the Proxmox host and hosted VM's and Containers.", "editable": false, "gnetId": 10048, "graphTooltip": 0, "id": 2, "iteration": 1574232555436, "links": [], "panels": [ { "collapsed": false, "datasource": null, "gridPos": { "h": 1, "w": 24, "x": 0, "y": 0 }, "id": 43, "panels": [], "title": "Summary", "type": "row" }, { "cacheTimeout": null, "colorBackground": false, "colorValue": false, "colors": [ "#299c46", "rgba(237, 129, 40, 0.89)", "#d44a3a" ], "datasource": "InfluxDB", "format": "none", "gauge": { "maxValue": 100, "minValue": 0, "show": false, "thresholdLabels": false, "thresholdMarkers": true }, "gridPos": { "h": 3, "w": 2, "x": 0, "y": 1 }, "id": 58, "interval": null, "links": [], "mappingType": 1, "mappingTypes": [ { "name": "value to text", "value": 1 }, { "name": "range to text", "value": 2 } ], "maxDataPoints": 100, "nullPointMode": "connected", "nullText": null, "options": {}, "postfix": "", "postfixFontSize": "50%", "prefix": "", "prefixFontSize": "50%", "rangeMaps": [ { "from": "null", "text": "N/A", "to": "null" } ], "sparkline": { "fillColor": "rgba(31, 118, 189, 0.18)", "full": false, "lineColor": "rgb(31, 120, 193)", "show": false }, "tableColumn": "", "targets": [ { "groupBy": [], "measurement": "cpustat", "orderByTime": "ASC", "policy": "default", "refId": "A", "resultFormat": "time_series", "select": [ [ { "params": [ "cpus" ], "type": "field" } ] ], "tags": [ { "key": "host", "operator": "=~", "value": "/^$server$/" } ] } ], "thresholds": "", "timeFrom": null, "timeShift": null, "title": "Cores", "type": "singlestat", "valueFontSize": "80%", "valueMaps": [ { "op": "=", "text": "N/A", "value": "null" } ], "valueName": "current" }, { "cacheTimeout": null, "colorBackground": false, "colorValue": false, "colors": [ "#299c46", "rgba(237, 129, 40, 0.89)", "#d44a3a" ], "datasource": "InfluxDB", "format": "bytes", "gauge": { "maxValue": 100, "minValue": 0, "show": false, "thresholdLabels": false, "thresholdMarkers": true }, "gridPos": { "h": 3, "w": 3, "x": 2, "y": 1 }, "id": 60, "interval": null, "links": [], "mappingType": 1, "mappingTypes": [ { "name": "value to text", "value": 1 }, { "name": "range to text", "value": 2 } ], "maxDataPoints": 100, "nullPointMode": "connected", "nullText": null, "options": {}, "postfix": "", "postfixFontSize": "50%", "prefix": "", "prefixFontSize": "50%", "rangeMaps": [ { "from": "null", "text": "N/A", "to": "null" } ], "sparkline": { "fillColor": "rgba(31, 118, 189, 0.18)", "full": false, "lineColor": "rgb(31, 120, 193)", "show": false }, "tableColumn": "", "targets": [ { "groupBy": [], "measurement": "memory", "orderByTime": "ASC", "policy": "default", "refId": "A", "resultFormat": "time_series", "select": [ [ { "params": [ "memtotal" ], "type": "field" } ] ], "tags": [ { "key": "host", "operator": "=~", "value": "/^$server$/" } ] } ], "thresholds": "", "timeFrom": null, "timeShift": null, "title": "Total Memory", "type": "singlestat", "valueFontSize": "80%", "valueMaps": [ { "op": "=", "text": "N/A", "value": "null" } ], "valueName": "current" }, { "cacheTimeout": null, "colorBackground": false, "colorValue": false, "colors": [ "#299c46", "rgba(237, 129, 40, 0.89)", "#d44a3a" ], "datasource": "InfluxDB", "format": "bytes", "gauge": { "maxValue": 100, "minValue": 0, "show": false, "thresholdLabels": false, "thresholdMarkers": true }, "gridPos": { "h": 3, "w": 3, "x": 5, "y": 1 }, "id": 62, "interval": null, "links": [], "mappingType": 1, "mappingTypes": [ { "name": "value to text", "value": 1 }, { "name": "range to text", "value": 2 } ], "maxDataPoints": 100, "nullPointMode": "connected", "nullText": null, "options": {}, "postfix": "", "postfixFontSize": "50%", "prefix": "", "prefixFontSize": "50%", "rangeMaps": [ { "from": "null", "text": "N/A", "to": "null" } ], "sparkline": { "fillColor": "rgba(31, 118, 189, 0.18)", "full": false, "lineColor": "rgb(31, 120, 193)", "show": false }, "tableColumn": "", "targets": [ { "groupBy": [], "measurement": "memory", "orderByTime": "ASC", "policy": "default", "refId": "A", "resultFormat": "time_series", "select": [ [ { "params": [ "swaptotal" ], "type": "field" } ] ], "tags": [ { "key": "host", "operator": "=~", "value": "/^$server$/" } ] } ], "thresholds": "", "timeFrom": null, "timeShift": null, "title": "Total Swap", "type": "singlestat", "valueFontSize": "80%", "valueMaps": [ { "op": "=", "text": "N/A", "value": "null" } ], "valueName": "current" }, { "cacheTimeout": null, "colorBackground": false, "colorValue": false, "colors": [ "#73BF69", "rgba(237, 129, 40, 0.89)", "#d44a3a" ], "datasource": "InfluxDB", "decimals": 2, "description": "", "format": "percentunit", "gauge": { "maxValue": 1, "minValue": 0, "show": true, "thresholdLabels": false, "thresholdMarkers": true }, "gridPos": { "h": 6, "w": 4, "x": 8, "y": 1 }, "id": 2, "interval": null, "links": [], "mappingType": 1, "mappingTypes": [ { "name": "value to text", "value": 1 }, { "name": "range to text", "value": 2 } ], "maxDataPoints": 100, "nullPointMode": "connected", "nullText": null, "options": {}, "postfix": "", "postfixFontSize": "50%", "prefix": "", "prefixFontSize": "50%", "rangeMaps": [ { "from": "null", "text": "N/A", "to": "null" } ], "sparkline": { "fillColor": "rgba(31, 118, 189, 0)", "full": false, "lineColor": "rgb(31, 120, 193)", "show": true }, "tableColumn": "", "targets": [ { "groupBy": [ { "params": [ "$__interval" ], "type": "time" }, { "params": [ "null" ], "type": "fill" } ], "measurement": "cpustat", "orderByTime": "ASC", "policy": "default", "query": "SELECT mean(\"cpu\") FROM \"cpustat\" WHERE (\"host\" =~ /^$server$/) AND $timeFilter GROUP BY time($__interval) fill(null)", "rawQuery": true, "refId": "A", "resultFormat": "time_series", "select": [ [ { "params": [ "cpu" ], "type": "field" }, { "params": [], "type": "mean" } ] ], "tags": [ { "key": "host", "operator": "=~", "value": "/^$server$/" } ] } ], "thresholds": "0.5,0.75", "timeFrom": null, "timeShift": null, "title": "Server CPU", "transparent": true, "type": "singlestat", "valueFontSize": "80%", "valueMaps": [ { "op": "=", "text": "N/A", "value": "null" } ], "valueName": "current" }, { "cacheTimeout": null, "colorBackground": false, "colorValue": false, "colors": [ "#73BF69", "rgba(237, 129, 40, 0.89)", "#d44a3a" ], "datasource": "InfluxDB", "decimals": 2, "description": "", "format": "short", "gauge": { "maxValue": 10, "minValue": 0, "show": true, "thresholdLabels": false, "thresholdMarkers": true }, "gridPos": { "h": 6, "w": 4, "x": 12, "y": 1 }, "id": 9, "interval": null, "links": [], "mappingType": 1, "mappingTypes": [ { "name": "value to text", "value": 1 }, { "name": "range to text", "value": 2 } ], "maxDataPoints": 100, "nullPointMode": "connected", "nullText": null, "options": {}, "postfix": "", "postfixFontSize": "50%", "prefix": "", "prefixFontSize": "50%", "rangeMaps": [ { "from": "null", "text": "N/A", "to": "null" } ], "sparkline": { "fillColor": "rgba(31, 118, 189, 0)", "full": false, "lineColor": "rgb(31, 120, 193)", "show": true }, "tableColumn": "", "targets": [ { "groupBy": [ { "params": [ "$__interval" ], "type": "time" }, { "params": [ "null" ], "type": "fill" } ], "measurement": "cpustat", "orderByTime": "ASC", "policy": "default", "query": "SELECT mean(\"avg1\") FROM \"cpustat\" WHERE (\"host\" =~ /^$server$/) AND $timeFilter GROUP BY time($__interval) fill(null)\n", "rawQuery": true, "refId": "A", "resultFormat": "time_series", "select": [ [ { "params": [ "avg1" ], "type": "field" }, { "params": [], "type": "mean" } ] ], "tags": [ { "key": "host", "operator": "=~", "value": "/^$server$/" } ] } ], "thresholds": "6,8", "timeFrom": null, "timeShift": null, "title": "Load Average (1 Minute)", "transparent": true, "type": "singlestat", "valueFontSize": "80%", "valueMaps": [ { "op": "=", "text": "N/A", "value": "null" } ], "valueName": "current" }, { "cacheTimeout": null, "colorBackground": false, "colorValue": false, "colors": [ "#73BF69", "rgba(237, 129, 40, 0.89)", "#d44a3a" ], "datasource": "InfluxDB", "decimals": 2, "description": "", "format": "percentunit", "gauge": { "maxValue": 1, "minValue": 0, "show": true, "thresholdLabels": false, "thresholdMarkers": true }, "gridPos": { "h": 6, "w": 4, "x": 16, "y": 1 }, "id": 10, "interval": null, "links": [], "mappingType": 1, "mappingTypes": [ { "name": "value to text", "value": 1 }, { "name": "range to text", "value": 2 } ], "maxDataPoints": 100, "nullPointMode": "connected", "nullText": null, "options": {}, "postfix": "", "postfixFontSize": "50%", "prefix": "", "prefixFontSize": "50%", "rangeMaps": [ { "from": "null", "text": "N/A", "to": "null" } ], "sparkline": { "fillColor": "rgba(31, 118, 189, 0)", "full": false, "lineColor": "rgb(31, 120, 193)", "show": true }, "tableColumn": "", "targets": [ { "groupBy": [ { "params": [ "$__interval" ], "type": "time" }, { "params": [ "null" ], "type": "fill" } ], "measurement": "cpustat", "orderByTime": "ASC", "policy": "default", "query": "SELECT mean(\"wait\") FROM \"cpustat\" WHERE (\"host\" =~ /^$server$/) AND $timeFilter GROUP BY time($__interval) fill(null)", "rawQuery": true, "refId": "A", "resultFormat": "time_series", "select": [ [ { "params": [ "wait" ], "type": "field" }, { "params": [], "type": "mean" } ] ], "tags": [ { "key": "host", "operator": "=~", "value": "/^$server$/" } ] } ], "thresholds": "0.5,0.75", "timeFrom": null, "timeShift": null, "title": "I/O Wait", "transparent": true, "type": "singlestat", "valueFontSize": "80%", "valueMaps": [ { "op": "=", "text": "N/A", "value": "null" } ], "valueName": "current" }, { "cacheTimeout": null, "colorBackground": false, "colorValue": false, "colors": [ "#73BF69", "rgba(237, 129, 40, 0.89)", "#d44a3a" ], "datasource": "InfluxDB", "decimals": 2, "description": "", "format": "gbytes", "gauge": { "maxValue": 160, "minValue": 0, "show": true, "thresholdLabels": false, "thresholdMarkers": true }, "gridPos": { "h": 6, "w": 4, "x": 20, "y": 1 }, "id": 11, "interval": null, "links": [], "mappingType": 1, "mappingTypes": [ { "name": "value to text", "value": 1 }, { "name": "range to text", "value": 2 } ], "maxDataPoints": 100, "nullPointMode": "connected", "nullText": null, "options": {}, "postfix": "", "postfixFontSize": "50%", "prefix": "", "prefixFontSize": "50%", "rangeMaps": [ { "from": "null", "text": "N/A", "to": "null" } ], "sparkline": { "fillColor": "rgba(31, 118, 189, 0)", "full": false, "lineColor": "rgb(31, 120, 193)", "show": true }, "tableColumn": "", "targets": [ { "groupBy": [ { "params": [ "$__interval" ], "type": "time" }, { "params": [ "null" ], "type": "fill" } ], "measurement": "memory", "orderByTime": "ASC", "policy": "default", "query": "SELECT mean(\"memused\") / 1073741824 FROM \"memory\" WHERE (\"host\" =~ /^$server$/) AND $timeFilter GROUP BY time($__interval) fill(null)", "rawQuery": true, "refId": "A", "resultFormat": "time_series", "select": [ [ { "params": [ "memused" ], "type": "field" }, { "params": [], "type": "mean" }, { "params": [ "/ 1073741824" ], "type": "math" } ] ], "tags": [ { "key": "host", "operator": "=~", "value": "/^$server$/" } ] } ], "thresholds": "96,140", "timeFrom": null, "timeShift": null, "title": "Used Memory", "transparent": true, "type": "singlestat", "valueFontSize": "80%", "valueMaps": [ { "op": "=", "text": "N/A", "value": "null" } ], "valueName": "current" }, { "bgColor": null, "clockType": "24 hour", "countdownSettings": { "customFormat": null, "endCountdownTime": "2019-04-12T19:20:00.000Z", "endText": "00:00:00" }, "datasource": "InfluxDB", "dateSettings": { "dateFormat": "YYYY-MM-DD", "fontSize": "20px", "fontWeight": "normal", "showDate": true }, "gridPos": { "h": 3, "w": 8, "x": 0, "y": 4 }, "id": 20, "links": [], "mode": "time", "offsetFromUtc": null, "offsetFromUtcMinutes": null, "options": {}, "refreshSettings": { "syncWithDashboard": false }, "targets": [ { "groupBy": [ { "params": [ "$__interval" ], "type": "time" }, { "params": [ "null" ], "type": "fill" } ], "orderByTime": "ASC", "policy": "default", "refId": "A", "resultFormat": "time_series", "select": [ [ { "params": [ "value" ], "type": "field" }, { "params": [], "type": "mean" } ] ], "tags": [] } ], "timeFrom": null, "timeSettings": { "customFormat": "HH:mm:ss", "fontSize": "40px", "fontWeight": "normal" }, "timeShift": null, "timezone": null, "timezoneSettings": { "fontSize": "12px", "fontWeight": "normal", "showTimezone": false, "zoneFormat": "offsetAbbv" }, "title": "Time", "transparent": true, "type": "grafana-clock-panel" }, { "cacheTimeout": null, "colorBackground": false, "colorValue": false, "colors": [ "#299c46", "rgba(237, 129, 40, 0.89)", "#d44a3a" ], "datasource": "InfluxDB", "format": "dateTimeAsIso", "gauge": { "maxValue": 100, "minValue": 0, "show": false, "thresholdLabels": false, "thresholdMarkers": true }, "gridPos": { "h": 6, "w": 6, "x": 0, "y": 7 }, "id": 24, "interval": null, "links": [], "mappingType": 1, "mappingTypes": [ { "name": "value to text", "value": 1 }, { "name": "range to text", "value": 2 } ], "maxDataPoints": 100, "nullPointMode": "connected", "nullText": null, "options": {}, "postfix": "", "postfixFontSize": "50%", "prefix": "", "prefixFontSize": "50%", "rangeMaps": [ { "from": "null", "text": "N/A", "to": "null" } ], "sparkline": { "fillColor": "rgba(31, 118, 189, 0.18)", "full": false, "lineColor": "rgb(31, 120, 193)", "show": false }, "tableColumn": "", "targets": [ { "groupBy": [ { "params": [ "$__interval" ], "type": "time" }, { "params": [ "null" ], "type": "fill" } ], "measurement": "cpustat", "orderByTime": "ASC", "policy": "default", "refId": "A", "resultFormat": "time_series", "select": [ [ { "params": [ "cpu" ], "type": "field" }, { "params": [], "type": "last" } ] ], "tags": [ { "key": "host", "operator": "=~", "value": "/^$server$/" } ] } ], "thresholds": "", "timeFrom": null, "timeShift": null, "title": "Last Update", "transparent": true, "type": "singlestat", "valueFontSize": "100%", "valueMaps": [ { "op": "=", "text": "N/A", "value": "null" } ], "valueName": "last_time" }, { "cacheTimeout": null, "colorBackground": false, "colorValue": false, "colors": [ "#299c46", "rgba(237, 129, 40, 0.89)", "#d44a3a" ], "datasource": "InfluxDB", "decimals": 1, "format": "dtdurations", "gauge": { "maxValue": 100, "minValue": 0, "show": false, "thresholdLabels": false, "thresholdMarkers": true }, "gridPos": { "h": 6, "w": 6, "x": 6, "y": 7 }, "id": 16, "interval": null, "links": [], "mappingType": 1, "mappingTypes": [ { "name": "value to text", "value": 1 }, { "name": "range to text", "value": 2 } ], "maxDataPoints": 100, "nullPointMode": "connected", "nullText": null, "options": {}, "postfix": "", "postfixFontSize": "50%", "prefix": "", "prefixFontSize": "50%", "rangeMaps": [ { "from": "null", "text": "N/A", "to": "null" } ], "sparkline": { "fillColor": "rgba(31, 118, 189, 0.18)", "full": false, "lineColor": "rgb(31, 120, 193)", "show": false }, "tableColumn": "", "targets": [ { "groupBy": [], "measurement": "system", "orderByTime": "ASC", "policy": "default", "refId": "A", "resultFormat": "time_series", "select": [ [ { "params": [ "uptime" ], "type": "field" }, { "params": [], "type": "last" } ] ], "tags": [ { "key": "host", "operator": "=~", "value": "/^$server$/" } ] } ], "thresholds": "", "timeFrom": null, "timeShift": null, "title": "Host Uptime", "transparent": true, "type": "singlestat", "valueFontSize": "80%", "valueMaps": [ { "op": "=", "text": "N/A", "value": "null" } ], "valueName": "current" }, { "columns": [], "datasource": "InfluxDB", "fontSize": "100%", "gridPos": { "h": 6, "w": 6, "x": 12, "y": 7 }, "id": 7, "interval": "", "links": [], "options": {}, "pageSize": null, "scroll": true, "showHeader": true, "sort": { "col": 1, "desc": false }, "styles": [ { "alias": "Time", "colorMode": null, "colors": [ "rgba(245, 54, 54, 0.9)", "rgba(237, 129, 40, 0.89)", "rgba(50, 172, 45, 0.97)" ], "dateFormat": "YYYY-MM-DD HH:mm:ss", "decimals": 2, "mappingType": 1, "pattern": "Time", "thresholds": [], "type": "hidden", "unit": "short" }, { "alias": "Uptime", "colorMode": null, "colors": [ "rgba(245, 54, 54, 0.9)", "rgba(237, 129, 40, 0.89)", "rgba(50, 172, 45, 0.97)" ], "dateFormat": "YYYY-MM-DD HH:mm:ss", "decimals": 1, "mappingType": 1, "pattern": "uptime", "rangeMaps": [ { "from": "", "text": "", "to": "" } ], "thresholds": [], "type": "number", "unit": "dtdurations", "valueMaps": [ { "text": "Offline", "value": "0" } ] }, { "alias": "VM", "colorMode": null, "colors": [ "rgba(245, 54, 54, 0.9)", "rgba(237, 129, 40, 0.89)", "rgba(50, 172, 45, 0.97)" ], "dateFormat": "YYYY-MM-DD HH:mm:ss", "decimals": 2, "mappingType": 1, "pattern": "host", "sanitize": true, "thresholds": [], "type": "string", "unit": "short", "valueMaps": [] } ], "targets": [ { "groupBy": [ { "params": [ "host" ], "type": "tag" } ], "limit": "1", "measurement": "system", "orderByTime": "ASC", "policy": "default", "query": "SELECT last(uptime) AS \"uptime\" FROM \"system\" WHERE (\"object\" = 'qemu') AND (\"nodename\" =~ /^$server$/) AND time > (now() - 10m) AND uptime > 0 GROUP BY \"host\" limit 1", "rawQuery": true, "refId": "A", "resultFormat": "table", "select": [ [ { "params": [ "uptime" ], "type": "field" }, { "params": [ "uptime" ], "type": "alias" } ] ], "tags": [ { "key": "object", "operator": "=", "value": "qemu" } ] } ], "timeFrom": null, "timeShift": null, "title": "Running VMs", "transform": "table", "transparent": true, "type": "table" }, { "columns": [], "datasource": "InfluxDB", "fontSize": "100%", "gridPos": { "h": 5, "w": 6, "x": 18, "y": 7 }, "id": 8, "interval": "", "links": [], "options": {}, "pageSize": null, "scroll": true, "showHeader": true, "sort": { "col": 1, "desc": false }, "styles": [ { "alias": "Time", "colorMode": null, "colors": [ "rgba(245, 54, 54, 0.9)", "rgba(237, 129, 40, 0.89)", "rgba(50, 172, 45, 0.97)" ], "dateFormat": "YYYY-MM-DD HH:mm:ss", "decimals": 2, "mappingType": 1, "pattern": "Time", "thresholds": [], "type": "hidden", "unit": "short" }, { "alias": "Uptime", "colorMode": null, "colors": [ "rgba(245, 54, 54, 0.9)", "rgba(237, 129, 40, 0.89)", "rgba(50, 172, 45, 0.97)" ], "dateFormat": "YYYY-MM-DD HH:mm:ss", "decimals": 1, "mappingType": 1, "pattern": "uptime", "thresholds": [], "type": "number", "unit": "dthms" }, { "alias": "LXC", "colorMode": null, "colors": [ "rgba(245, 54, 54, 0.9)", "rgba(237, 129, 40, 0.89)", "rgba(50, 172, 45, 0.97)" ], "dateFormat": "YYYY-MM-DD HH:mm:ss", "decimals": 2, "mappingType": 1, "pattern": "host", "sanitize": true, "thresholds": [], "type": "string", "unit": "short", "valueMaps": [] } ], "targets": [ { "groupBy": [ { "params": [ "host" ], "type": "tag" } ], "limit": "1", "measurement": "system", "orderByTime": "ASC", "policy": "default", "query": "SELECT last(uptime) AS \"uptime\" FROM \"system\" WHERE (\"object\" = 'lxc') AND (\"nodename\" =~ /^$server$/) AND time > (now() - 10m) AND uptime > 0 GROUP BY \"host\" limit 1", "rawQuery": true, "refId": "A", "resultFormat": "table", "select": [ [ { "params": [ "uptime" ], "type": "field" }, { "params": [ "uptime" ], "type": "alias" } ] ], "tags": [ { "key": "object", "operator": "=", "value": "qemu" } ] } ], "timeFrom": null, "timeShift": null, "title": "Running LXCs", "transform": "table", "transparent": true, "type": "table" }, { "collapsed": false, "datasource": null, "gridPos": { "h": 1, "w": 24, "x": 0, "y": 13 }, "id": 26, "panels": [], "title": "Memory And CPU Usage", "type": "row" }, { "aliasColors": { "I/O Wait": "dark-blue", "Load Average (1 Min)": "dark-red" }, "bars": false, "dashLength": 10, "dashes": false, "datasource": "InfluxDB", "fill": 1, "fillGradient": 0, "gridPos": { "h": 7, "w": 12, "x": 0, "y": 14 }, "id": 22, "interval": "", "legend": { "alignAsTable": false, "avg": true, "current": true, "max": false, "min": false, "rightSide": false, "show": true, "total": false, "values": true }, "lines": true, "linewidth": 2, "links": [], "nullPointMode": "null", "options": { "dataLinks": [] }, "percentage": false, "pointradius": 2, "points": false, "renderer": "flot", "seriesOverrides": [ { "alias": "Load Average (1 Min)", "yaxis": 2 } ], "spaceLength": 10, "stack": false, "steppedLine": false, "targets": [ { "alias": "CPU Usage", "groupBy": [ { "params": [ "1m" ], "type": "time" }, { "params": [ "null" ], "type": "fill" } ], "measurement": "cpustat", "orderByTime": "ASC", "policy": "default", "refId": "A", "resultFormat": "time_series", "select": [ [ { "params": [ "cpu" ], "type": "field" }, { "params": [], "type": "mean" }, { "params": [ "* 100" ], "type": "math" } ] ], "tags": [ { "key": "host", "operator": "=~", "value": "/^$server$/" } ] }, { "alias": "I/O Wait", "groupBy": [ { "params": [ "1m" ], "type": "time" }, { "params": [ "null" ], "type": "fill" } ], "measurement": "cpustat", "orderByTime": "ASC", "policy": "default", "refId": "B", "resultFormat": "time_series", "select": [ [ { "params": [ "wait" ], "type": "field" }, { "params": [], "type": "mean" }, { "params": [ " * 100" ], "type": "math" } ] ], "tags": [ { "key": "host", "operator": "=~", "value": "/^$server$/" } ] }, { "alias": "Load Average (1 Min)", "groupBy": [ { "params": [ "1m" ], "type": "time" }, { "params": [ "null" ], "type": "fill" } ], "measurement": "cpustat", "orderByTime": "ASC", "policy": "default", "refId": "C", "resultFormat": "time_series", "select": [ [ { "params": [ "avg1" ], "type": "field" }, { "params": [], "type": "mean" } ] ], "tags": [ { "key": "host", "operator": "=~", "value": "/^$server$/" } ] } ], "thresholds": [], "timeFrom": null, "timeRegions": [], "timeShift": null, "title": "Host CPU Usage", "tooltip": { "shared": true, "sort": 0, "value_type": "individual" }, "type": "graph", "xaxis": { "buckets": null, "mode": "time", "name": null, "show": true, "values": [] }, "yaxes": [ { "decimals": null, "format": "percent", "label": "Percent", "logBase": 1, "max": null, "min": "0", "show": true }, { "decimals": null, "format": "short", "label": "Load", "logBase": 1, "max": "10", "min": "0", "show": true } ], "yaxis": { "align": false, "alignLevel": null } }, { "aliasColors": {}, "bars": false, "dashLength": 10, "dashes": false, "datasource": "InfluxDB", "fill": 1, "fillGradient": 0, "gridPos": { "h": 7, "w": 12, "x": 12, "y": 14 }, "id": 4, "interval": "", "legend": { "alignAsTable": true, "avg": true, "current": true, "max": true, "min": true, "rightSide": false, "show": true, "total": false, "values": true }, "lines": true, "linewidth": 2, "links": [], "nullPointMode": "null", "options": { "dataLinks": [] }, "percentage": false, "pointradius": 2, "points": false, "renderer": "flot", "seriesOverrides": [], "spaceLength": 10, "stack": false, "steppedLine": false, "targets": [ { "alias": "Memory Use", "groupBy": [ { "params": [ "$__interval" ], "type": "time" }, { "params": [ "null" ], "type": "fill" } ], "measurement": "memory", "orderByTime": "ASC", "policy": "default", "query": "SELECT mean(\"memused\")/mean(\"memtotal\") * 100 FROM \"memory\" WHERE (\"host\" =~ /^$server$/) AND $timeFilter GROUP BY time($__interval) fill(null)", "rawQuery": true, "refId": "A", "resultFormat": "time_series", "select": [ [ { "params": [ "memused" ], "type": "field" }, { "params": [], "type": "mean" } ] ], "tags": [ { "key": "host", "operator": "=~", "value": "/^$server$/" } ] } ], "thresholds": [], "timeFrom": null, "timeRegions": [], "timeShift": null, "title": "Host Memory Usage", "tooltip": { "shared": true, "sort": 0, "value_type": "individual" }, "type": "graph", "xaxis": { "buckets": null, "mode": "time", "name": null, "show": true, "values": [] }, "yaxes": [ { "decimals": null, "format": "percent", "label": null, "logBase": 1, "max": "100", "min": "0", "show": true }, { "format": "short", "label": null, "logBase": 1, "max": null, "min": null, "show": true } ], "yaxis": { "align": false, "alignLevel": null } }, { "aliasColors": {}, "bars": false, "dashLength": 10, "dashes": false, "datasource": "InfluxDB", "decimals": 2, "fill": 1, "fillGradient": 0, "gridPos": { "h": 6, "w": 12, "x": 0, "y": 21 }, "id": 28, "interval": "", "legend": { "alignAsTable": true, "avg": true, "current": true, "hideEmpty": false, "hideZero": true, "max": false, "min": false, "rightSide": true, "show": true, "total": false, "values": true }, "lines": true, "linewidth": 2, "links": [], "nullPointMode": "null", "options": { "dataLinks": [] }, "percentage": false, "pointradius": 2, "points": false, "renderer": "flot", "seriesOverrides": [], "spaceLength": 10, "stack": false, "steppedLine": false, "targets": [ { "alias": "$tag_host", "groupBy": [ { "params": [ "1m" ], "type": "time" }, { "params": [ "host" ], "type": "tag" }, { "params": [ "null" ], "type": "fill" } ], "measurement": "system", "orderByTime": "ASC", "policy": "default", "query": "SELECT last(\"cpu\") FROM \"system\" WHERE (\"object\" = 'qemu') AND $timeFilter GROUP BY time($__interval) fill(null)", "rawQuery": false, "refId": "A", "resultFormat": "time_series", "select": [ [ { "params": [ "cpu" ], "type": "field" }, { "params": [], "type": "last" } ] ], "tags": [ { "key": "object", "operator": "=", "value": "qemu" }, { "condition": "AND", "key": "nodename", "operator": "=~", "value": "/^$server$/" } ] } ], "thresholds": [], "timeFrom": null, "timeRegions": [], "timeShift": null, "title": "VM CPU Usage", "tooltip": { "shared": true, "sort": 0, "value_type": "individual" }, "type": "graph", "xaxis": { "buckets": null, "mode": "time", "name": null, "show": true, "values": [] }, "yaxes": [ { "decimals": 2, "format": "percentunit", "label": "", "logBase": 1, "max": null, "min": null, "show": true }, { "format": "short", "label": null, "logBase": 1, "max": null, "min": null, "show": false } ], "yaxis": { "align": false, "alignLevel": null } }, { "aliasColors": {}, "bars": false, "dashLength": 10, "dashes": false, "datasource": "InfluxDB", "fill": 1, "fillGradient": 0, "gridPos": { "h": 6, "w": 12, "x": 12, "y": 21 }, "id": 31, "interval": "", "legend": { "alignAsTable": true, "avg": true, "current": true, "hideZero": true, "max": false, "min": false, "rightSide": true, "show": true, "total": false, "values": true }, "lines": true, "linewidth": 2, "links": [], "nullPointMode": "null", "options": { "dataLinks": [] }, "percentage": false, "pointradius": 2, "points": false, "renderer": "flot", "seriesOverrides": [], "spaceLength": 10, "stack": false, "steppedLine": false, "targets": [ { "alias": "$tag_host", "groupBy": [ { "params": [ "$__interval" ], "type": "time" }, { "params": [ "host" ], "type": "tag" }, { "params": [ "null" ], "type": "fill" } ], "measurement": "system", "orderByTime": "ASC", "policy": "default", "query": "SELECT (mean(\"mem\")/last(maxmem))*100 FROM \"system\" WHERE (\"object\" = 'qemu') AND (\"nodename\" =~ /^$server$/) AND $timeFilter GROUP BY time($__interval), \"host\" fill(null)", "rawQuery": true, "refId": "A", "resultFormat": "time_series", "select": [ [ { "params": [ "mem" ], "type": "field" }, { "params": [], "type": "mean" } ] ], "tags": [ { "key": "object", "operator": "=", "value": "qemu" } ] } ], "thresholds": [], "timeFrom": null, "timeRegions": [], "timeShift": null, "title": "VMs Memory Usage", "tooltip": { "shared": true, "sort": 0, "value_type": "individual" }, "type": "graph", "xaxis": { "buckets": null, "mode": "time", "name": null, "show": true, "values": [] }, "yaxes": [ { "format": "percent", "label": null, "logBase": 1, "max": null, "min": null, "show": true }, { "format": "short", "label": null, "logBase": 1, "max": null, "min": null, "show": false } ], "yaxis": { "align": false, "alignLevel": null } }, { "aliasColors": {}, "bars": false, "dashLength": 10, "dashes": false, "datasource": "InfluxDB", "decimals": 2, "fill": 1, "fillGradient": 0, "gridPos": { "h": 6, "w": 12, "x": 0, "y": 27 }, "id": 29, "interval": "", "legend": { "alignAsTable": true, "avg": true, "current": true, "hideEmpty": false, "hideZero": true, "max": false, "min": false, "rightSide": true, "show": true, "total": false, "values": true }, "lines": true, "linewidth": 2, "links": [], "nullPointMode": "null", "options": { "dataLinks": [] }, "percentage": false, "pointradius": 2, "points": false, "renderer": "flot", "seriesOverrides": [], "spaceLength": 10, "stack": false, "steppedLine": false, "targets": [ { "alias": "$tag_host", "groupBy": [ { "params": [ "1m" ], "type": "time" }, { "params": [ "host" ], "type": "tag" }, { "params": [ "null" ], "type": "fill" } ], "measurement": "system", "orderByTime": "ASC", "policy": "default", "query": "SELECT last(\"cpu\") FROM \"system\" WHERE (\"object\" = 'lxc' AND \"nodename\" =~ /^$server$/) AND $timeFilter GROUP BY time(1m), \"host\" fill(null)", "rawQuery": true, "refId": "A", "resultFormat": "time_series", "select": [ [ { "params": [ "cpu" ], "type": "field" }, { "params": [], "type": "last" } ] ], "tags": [ { "key": "object", "operator": "=", "value": "lxc" }, { "condition": "AND", "key": "nodename", "operator": "=~", "value": "/^$server$/" } ] } ], "thresholds": [], "timeFrom": null, "timeRegions": [], "timeShift": null, "title": "LXC CPU Usage", "tooltip": { "shared": true, "sort": 0, "value_type": "individual" }, "type": "graph", "xaxis": { "buckets": null, "mode": "time", "name": null, "show": true, "values": [] }, "yaxes": [ { "decimals": 2, "format": "percentunit", "label": "", "logBase": 1, "max": null, "min": null, "show": true }, { "format": "short", "label": null, "logBase": 1, "max": null, "min": null, "show": false } ], "yaxis": { "align": false, "alignLevel": null } }, { "aliasColors": {}, "bars": false, "dashLength": 10, "dashes": false, "datasource": "InfluxDB", "fill": 1, "fillGradient": 0, "gridPos": { "h": 6, "w": 12, "x": 12, "y": 27 }, "id": 32, "interval": "", "legend": { "alignAsTable": true, "avg": true, "current": true, "hideZero": true, "max": false, "min": false, "rightSide": true, "show": true, "total": false, "values": true }, "lines": true, "linewidth": 2, "links": [], "nullPointMode": "null", "options": { "dataLinks": [] }, "percentage": false, "pointradius": 2, "points": false, "renderer": "flot", "seriesOverrides": [], "spaceLength": 10, "stack": false, "steppedLine": false, "targets": [ { "alias": "$tag_host", "groupBy": [ { "params": [ "$__interval" ], "type": "time" }, { "params": [ "host" ], "type": "tag" }, { "params": [ "null" ], "type": "fill" } ], "measurement": "system", "orderByTime": "ASC", "policy": "default", "query": "SELECT (mean(\"mem\")/last(maxmem))*100 FROM \"system\" WHERE (\"object\" = 'lxc') AND (\"nodename\" =~ /^$server$/) AND $timeFilter GROUP BY time($__interval), \"host\" fill(null)", "rawQuery": true, "refId": "A", "resultFormat": "time_series", "select": [ [ { "params": [ "mem" ], "type": "field" }, { "params": [], "type": "mean" } ] ], "tags": [ { "key": "object", "operator": "=", "value": "qemu" } ] } ], "thresholds": [], "timeFrom": null, "timeRegions": [], "timeShift": null, "title": "LXC Memory Usage", "tooltip": { "shared": true, "sort": 0, "value_type": "individual" }, "type": "graph", "xaxis": { "buckets": null, "mode": "time", "name": null, "show": true, "values": [] }, "yaxes": [ { "format": "percent", "label": null, "logBase": 1, "max": null, "min": null, "show": true }, { "format": "short", "label": null, "logBase": 1, "max": null, "min": null, "show": false } ], "yaxis": { "align": false, "alignLevel": null } }, { "collapsed": false, "datasource": null, "gridPos": { "h": 1, "w": 24, "x": 0, "y": 33 }, "id": 34, "panels": [], "title": "Disk I/O", "type": "row" }, { "aliasColors": {}, "bars": false, "dashLength": 10, "dashes": false, "datasource": "InfluxDB", "fill": 1, "fillGradient": 0, "gridPos": { "h": 6, "w": 12, "x": 0, "y": 34 }, "id": 36, "interval": "", "legend": { "alignAsTable": true, "avg": false, "current": true, "hideZero": true, "max": true, "min": false, "rightSide": true, "show": true, "total": false, "values": true }, "lines": true, "linewidth": 1, "links": [], "nullPointMode": "null", "options": { "dataLinks": [] }, "percentage": false, "pointradius": 2, "points": false, "renderer": "flot", "seriesOverrides": [], "spaceLength": 10, "stack": false, "steppedLine": false, "targets": [ { "alias": "$tag_host", "groupBy": [ { "params": [ "1m" ], "type": "time" }, { "params": [ "host" ], "type": "tag" }, { "params": [ "null" ], "type": "fill" } ], "measurement": "system", "orderByTime": "ASC", "policy": "default", "query": "SELECT abs(derivative(mean(\"diskread\"), 1s)) FROM \"system\" WHERE (\"object\" = 'qemu' AND \"nodename\" =~ /^$server$/) AND $timeFilter GROUP BY time(1m), \"host\" fill(null)", "rawQuery": true, "refId": "A", "resultFormat": "time_series", "select": [ [ { "params": [ "diskread" ], "type": "field" }, { "params": [], "type": "mean" }, { "params": [ "1s" ], "type": "derivative" } ] ], "tags": [ { "key": "object", "operator": "=", "value": "qemu" }, { "condition": "AND", "key": "nodename", "operator": "=~", "value": "/^$server$/" } ] } ], "thresholds": [], "timeFrom": null, "timeRegions": [], "timeShift": null, "title": "VMs I/O Read", "tooltip": { "shared": true, "sort": 0, "value_type": "individual" }, "type": "graph", "xaxis": { "buckets": null, "mode": "time", "name": null, "show": true, "values": [] }, "yaxes": [ { "format": "Bps", "label": null, "logBase": 1, "max": null, "min": null, "show": true }, { "format": "short", "label": null, "logBase": 1, "max": null, "min": null, "show": false } ], "yaxis": { "align": false, "alignLevel": null } }, { "aliasColors": {}, "bars": false, "dashLength": 10, "dashes": false, "datasource": "InfluxDB", "fill": 1, "fillGradient": 0, "gridPos": { "h": 6, "w": 12, "x": 12, "y": 34 }, "id": 37, "interval": "", "legend": { "alignAsTable": true, "avg": false, "current": true, "hideZero": true, "max": true, "min": false, "rightSide": true, "show": true, "total": false, "values": true }, "lines": true, "linewidth": 2, "links": [], "nullPointMode": "null", "options": { "dataLinks": [] }, "percentage": false, "pointradius": 2, "points": false, "renderer": "flot", "seriesOverrides": [], "spaceLength": 10, "stack": false, "steppedLine": false, "targets": [ { "alias": "$tag_host", "groupBy": [ { "params": [ "1m" ], "type": "time" }, { "params": [ "host" ], "type": "tag" }, { "params": [ "null" ], "type": "fill" } ], "hide": false, "measurement": "system", "orderByTime": "ASC", "policy": "default", "query": "SELECT abs(derivative(mean(\"diskwrite\"), 1s)) FROM \"system\" WHERE (\"object\" = 'qemu' AND \"nodename\" =~ /^$server$/) AND $timeFilter GROUP BY time(1m), \"host\" fill(null)", "rawQuery": true, "refId": "A", "resultFormat": "time_series", "select": [ [ { "params": [ "diskwrite" ], "type": "field" }, { "params": [], "type": "mean" }, { "params": [ "1s" ], "type": "derivative" } ] ], "tags": [ { "key": "object", "operator": "=", "value": "qemu" }, { "condition": "AND", "key": "nodename", "operator": "=", "value": "dianna" } ] } ], "thresholds": [], "timeFrom": null, "timeRegions": [], "timeShift": null, "title": "VMs I/O Write", "tooltip": { "shared": true, "sort": 0, "value_type": "individual" }, "type": "graph", "xaxis": { "buckets": null, "mode": "time", "name": null, "show": true, "values": [] }, "yaxes": [ { "format": "Bps", "label": null, "logBase": 1, "max": null, "min": null, "show": true }, { "format": "short", "label": null, "logBase": 1, "max": null, "min": null, "show": false } ], "yaxis": { "align": false, "alignLevel": null } }, { "aliasColors": {}, "bars": false, "dashLength": 10, "dashes": false, "datasource": "InfluxDB", "fill": 1, "fillGradient": 0, "gridPos": { "h": 6, "w": 12, "x": 0, "y": 40 }, "id": 38, "interval": "", "legend": { "alignAsTable": true, "avg": false, "current": true, "hideZero": true, "max": true, "min": false, "rightSide": true, "show": true, "total": false, "values": true }, "lines": true, "linewidth": 1, "links": [], "nullPointMode": "null", "options": { "dataLinks": [] }, "percentage": false, "pointradius": 2, "points": false, "renderer": "flot", "seriesOverrides": [], "spaceLength": 10, "stack": false, "steppedLine": false, "targets": [ { "alias": "$tag_host", "groupBy": [ { "params": [ "1m" ], "type": "time" }, { "params": [ "host" ], "type": "tag" }, { "params": [ "null" ], "type": "fill" } ], "measurement": "system", "orderByTime": "ASC", "policy": "default", "query": "SELECT abs(derivative(mean(\"diskread\"), 1s)) FROM \"system\" WHERE (\"object\" = 'lxc' AND \"nodename\" =~ /^$server$/) AND $timeFilter GROUP BY time(1m), \"host\" fill(null)", "rawQuery": true, "refId": "A", "resultFormat": "time_series", "select": [ [ { "params": [ "diskread" ], "type": "field" }, { "params": [], "type": "mean" }, { "params": [ "1s" ], "type": "derivative" } ] ], "tags": [ { "key": "object", "operator": "=", "value": "lxc" }, { "condition": "AND", "key": "nodename", "operator": "=~", "value": "/^$server$/" } ] } ], "thresholds": [], "timeFrom": null, "timeRegions": [], "timeShift": null, "title": "LXCs I/O Read", "tooltip": { "shared": true, "sort": 0, "value_type": "individual" }, "type": "graph", "xaxis": { "buckets": null, "mode": "time", "name": null, "show": true, "values": [] }, "yaxes": [ { "decimals": null, "format": "Bps", "label": null, "logBase": 1, "max": null, "min": null, "show": true }, { "format": "short", "label": null, "logBase": 1, "max": null, "min": "0", "show": false } ], "yaxis": { "align": false, "alignLevel": 0 } }, { "aliasColors": {}, "bars": false, "dashLength": 10, "dashes": false, "datasource": "InfluxDB", "fill": 1, "fillGradient": 0, "gridPos": { "h": 6, "w": 12, "x": 12, "y": 40 }, "id": 39, "interval": "", "legend": { "alignAsTable": true, "avg": false, "current": true, "hideZero": true, "max": true, "min": false, "rightSide": true, "show": true, "total": false, "values": true }, "lines": true, "linewidth": 2, "links": [], "nullPointMode": "null", "options": { "dataLinks": [] }, "percentage": false, "pointradius": 2, "points": false, "renderer": "flot", "seriesOverrides": [], "spaceLength": 10, "stack": false, "steppedLine": false, "targets": [ { "alias": "$tag_host", "groupBy": [ { "params": [ "1m" ], "type": "time" }, { "params": [ "host" ], "type": "tag" }, { "params": [ "null" ], "type": "fill" } ], "measurement": "system", "orderByTime": "ASC", "policy": "default", "query": "SELECT abs(derivative(mean(\"diskwrite\"), 1s)) FROM \"system\" WHERE (\"object\" = 'lxc' AND \"nodename\" =~ /^$server$/) AND $timeFilter GROUP BY time(1m), \"host\" fill(null)", "rawQuery": true, "refId": "A", "resultFormat": "time_series", "select": [ [ { "params": [ "diskwrite" ], "type": "field" }, { "params": [], "type": "mean" }, { "params": [ "1s" ], "type": "derivative" } ] ], "tags": [ { "key": "object", "operator": "=", "value": "lxc" }, { "condition": "AND", "key": "nodename", "operator": "=", "value": "dianna" } ] } ], "thresholds": [], "timeFrom": null, "timeRegions": [], "timeShift": null, "title": "LXCs I/O Write", "tooltip": { "shared": true, "sort": 0, "value_type": "individual" }, "type": "graph", "xaxis": { "buckets": null, "mode": "time", "name": null, "show": true, "values": [] }, "yaxes": [ { "format": "Bps", "label": null, "logBase": 1, "max": null, "min": null, "show": true }, { "format": "short", "label": null, "logBase": 1, "max": null, "min": null, "show": false } ], "yaxis": { "align": false, "alignLevel": null } }, { "collapsed": false, "datasource": null, "gridPos": { "h": 1, "w": 24, "x": 0, "y": 46 }, "id": 41, "panels": [], "title": "Network Traffic", "type": "row" }, { "aliasColors": {}, "bars": false, "dashLength": 10, "dashes": false, "datasource": "InfluxDB", "fill": 1, "fillGradient": 0, "gridPos": { "h": 6, "w": 12, "x": 0, "y": 47 }, "id": 45, "interval": "", "legend": { "avg": true, "current": true, "max": false, "min": false, "show": true, "total": false, "values": true }, "lines": true, "linewidth": 1, "links": [], "nullPointMode": "null", "options": { "dataLinks": [] }, "percentage": false, "pointradius": 2, "points": false, "renderer": "flot", "seriesOverrides": [], "spaceLength": 10, "stack": false, "steppedLine": false, "targets": [ { "alias": "Rx-$tag_instance", "groupBy": [ { "params": [ "$__interval" ], "type": "time" }, { "params": [ "null" ], "type": "fill" } ], "measurement": "nics", "orderByTime": "ASC", "policy": "default", "query": "SELECT abs(derivative(mean(\"receive\"), 10s)) AS \"Rx\" FROM \"nics\" WHERE (\"host\" =~ /^$server$/ AND \"instance\" =~ /bond[01]/) AND $timeFilter GROUP BY time($__interval), \"instance\" fill(null)", "rawQuery": true, "refId": "A", "resultFormat": "time_series", "select": [ [ { "params": [ "receive" ], "type": "field" }, { "params": [], "type": "mean" }, { "params": [ "10s" ], "type": "non_negative_derivative" }, { "params": [ "Rx" ], "type": "alias" } ] ], "tags": [ { "key": "host", "operator": "=~", "value": "/^$server$/" }, { "condition": "AND", "key": "instance", "operator": "=", "value": "enp2s0" } ] }, { "alias": "Tx-$tag_instance", "groupBy": [ { "params": [ "$__interval" ], "type": "time" }, { "params": [ "null" ], "type": "fill" } ], "measurement": "nics", "orderByTime": "ASC", "policy": "default", "query": "SELECT abs(derivative(mean(\"transmit\"), 10s)) FROM \"nics\" WHERE (\"host\" =~ /^$server$/ AND \"instance\" =~ /bond[01]/) AND $timeFilter GROUP BY time($__interval), \"instance\" fill(null)", "rawQuery": true, "refId": "B", "resultFormat": "time_series", "select": [ [ { "params": [ "transmit" ], "type": "field" }, { "params": [], "type": "mean" }, { "params": [ "10s" ], "type": "non_negative_derivative" } ] ], "tags": [ { "key": "host", "operator": "=~", "value": "/^$server$/" }, { "condition": "AND", "key": "instance", "operator": "=", "value": "enp2s0" } ] } ], "thresholds": [], "timeFrom": null, "timeRegions": [], "timeShift": null, "title": "bonds rx-tx", "tooltip": { "shared": true, "sort": 0, "value_type": "individual" }, "type": "graph", "xaxis": { "buckets": null, "mode": "time", "name": null, "show": true, "values": [] }, "yaxes": [ { "format": "bps", "label": null, "logBase": 1, "max": null, "min": null, "show": true }, { "format": "short", "label": null, "logBase": 1, "max": null, "min": null, "show": false } ], "yaxis": { "align": false, "alignLevel": null } }, { "aliasColors": {}, "bars": false, "dashLength": 10, "dashes": false, "datasource": "InfluxDB", "fill": 1, "fillGradient": 0, "gridPos": { "h": 6, "w": 12, "x": 12, "y": 47 }, "id": 46, "interval": "", "legend": { "avg": true, "current": true, "max": false, "min": false, "show": true, "total": false, "values": true }, "lines": true, "linewidth": 1, "links": [], "nullPointMode": "null", "options": { "dataLinks": [] }, "percentage": false, "pointradius": 2, "points": false, "renderer": "flot", "seriesOverrides": [], "spaceLength": 10, "stack": false, "steppedLine": false, "targets": [ { "alias": "Rx", "groupBy": [ { "params": [ "$__interval" ], "type": "time" }, { "params": [ "null" ], "type": "fill" } ], "measurement": "nics", "orderByTime": "ASC", "policy": "default", "query": "SELECT abs(derivative(mean(\"receive\"), 10s)) FROM \"nics\" WHERE (\"host\" =~ /^$server$/ AND \"instance\" = 'vmbr0') AND $timeFilter GROUP BY time($__interval) fill(null)", "rawQuery": true, "refId": "A", "resultFormat": "time_series", "select": [ [ { "params": [ "receive" ], "type": "field" }, { "params": [], "type": "mean" }, { "params": [ "10s" ], "type": "non_negative_derivative" } ] ], "tags": [ { "key": "host", "operator": "=~", "value": "/^$server$/" }, { "condition": "AND", "key": "instance", "operator": "=", "value": "vmbr0" } ] }, { "alias": "Tx", "groupBy": [ { "params": [ "$__interval" ], "type": "time" }, { "params": [ "null" ], "type": "fill" } ], "measurement": "nics", "orderByTime": "ASC", "policy": "default", "query": "SELECT abs(derivative(mean(\"transmit\"), 10s)) FROM \"nics\" WHERE (\"host\" =~ /^$server$/ AND \"instance\" = 'vmbr0') AND $timeFilter GROUP BY time($__interval) fill(null)", "rawQuery": true, "refId": "B", "resultFormat": "time_series", "select": [ [ { "params": [ "transmit" ], "type": "field" }, { "params": [], "type": "mean" }, { "params": [ "10s" ], "type": "non_negative_derivative" } ] ], "tags": [ { "key": "host", "operator": "=~", "value": "/^$server$/" }, { "condition": "AND", "key": "instance", "operator": "=", "value": "vmbr0" } ] } ], "thresholds": [], "timeFrom": null, "timeRegions": [], "timeShift": null, "title": "vmbr0", "tooltip": { "shared": true, "sort": 0, "value_type": "individual" }, "type": "graph", "xaxis": { "buckets": null, "mode": "time", "name": null, "show": true, "values": [] }, "yaxes": [ { "format": "bps", "label": null, "logBase": 1, "max": null, "min": null, "show": true }, { "format": "short", "label": null, "logBase": 1, "max": null, "min": null, "show": false } ], "yaxis": { "align": false, "alignLevel": null } }, { "aliasColors": {}, "bars": false, "dashLength": 10, "dashes": false, "datasource": "InfluxDB", "fill": 1, "fillGradient": 0, "gridPos": { "h": 6, "w": 12, "x": 0, "y": 53 }, "id": 47, "interval": "", "legend": { "alignAsTable": true, "avg": true, "current": true, "hideEmpty": false, "hideZero": true, "max": false, "min": false, "rightSide": true, "show": true, "total": false, "values": true }, "lines": true, "linewidth": 1, "links": [], "nullPointMode": "null", "options": { "dataLinks": [] }, "percentage": false, "pointradius": 2, "points": false, "renderer": "flot", "seriesOverrides": [], "spaceLength": 10, "stack": false, "steppedLine": false, "targets": [ { "alias": "$tag_host", "groupBy": [ { "params": [ "$__interval" ], "type": "time" }, { "params": [ "host" ], "type": "tag" }, { "params": [ "null" ], "type": "fill" } ], "measurement": "system", "orderByTime": "ASC", "policy": "default", "query": "SELECT abs(derivative(mean(\"netin\"), 10s)) FROM \"system\" WHERE (\"nodename\" =~ /^$server$/ AND \"object\" = 'qemu') AND $timeFilter GROUP BY time($__interval), \"host\" fill(null)", "rawQuery": true, "refId": "A", "resultFormat": "time_series", "select": [ [ { "params": [ "netin" ], "type": "field" }, { "params": [], "type": "mean" }, { "params": [ "10s" ], "type": "non_negative_derivative" } ] ], "tags": [ { "key": "nodename", "operator": "=~", "value": "/^$server$/" }, { "condition": "AND", "key": "object", "operator": "=", "value": "qemu" } ] } ], "thresholds": [], "timeFrom": null, "timeRegions": [], "timeShift": null, "title": "VMs Traffic In", "tooltip": { "shared": true, "sort": 0, "value_type": "individual" }, "type": "graph", "xaxis": { "buckets": null, "mode": "time", "name": null, "show": true, "values": [] }, "yaxes": [ { "format": "bps", "label": null, "logBase": 1, "max": null, "min": null, "show": true }, { "format": "short", "label": null, "logBase": 1, "max": null, "min": null, "show": false } ], "yaxis": { "align": false, "alignLevel": null } }, { "aliasColors": {}, "bars": false, "dashLength": 10, "dashes": false, "datasource": "InfluxDB", "fill": 1, "fillGradient": 0, "gridPos": { "h": 6, "w": 12, "x": 12, "y": 53 }, "id": 49, "interval": "", "legend": { "alignAsTable": true, "avg": true, "current": true, "hideEmpty": false, "hideZero": true, "max": false, "min": false, "rightSide": true, "show": true, "total": false, "values": true }, "lines": true, "linewidth": 1, "links": [], "nullPointMode": "null", "options": { "dataLinks": [] }, "percentage": false, "pointradius": 2, "points": false, "renderer": "flot", "seriesOverrides": [], "spaceLength": 10, "stack": false, "steppedLine": false, "targets": [ { "alias": "$tag_host", "groupBy": [ { "params": [ "$__interval" ], "type": "time" }, { "params": [ "host" ], "type": "tag" }, { "params": [ "null" ], "type": "fill" } ], "measurement": "system", "orderByTime": "ASC", "policy": "default", "query": "SELECT abs(derivative(mean(\"netout\"), 10s)) FROM \"system\" WHERE (\"nodename\" =~ /^$server$/ AND \"object\" = 'qemu') AND $timeFilter GROUP BY time($__interval), \"host\" fill(null)", "rawQuery": true, "refId": "A", "resultFormat": "time_series", "select": [ [ { "params": [ "netout" ], "type": "field" }, { "params": [], "type": "mean" }, { "params": [ "10s" ], "type": "non_negative_derivative" } ] ], "tags": [ { "key": "nodename", "operator": "=~", "value": "/^$server$/" }, { "condition": "AND", "key": "object", "operator": "=", "value": "qemu" } ] } ], "thresholds": [], "timeFrom": null, "timeRegions": [], "timeShift": null, "title": "VMs Traffic Out", "tooltip": { "shared": true, "sort": 0, "value_type": "individual" }, "type": "graph", "xaxis": { "buckets": null, "mode": "time", "name": null, "show": true, "values": [] }, "yaxes": [ { "format": "bps", "label": null, "logBase": 1, "max": null, "min": null, "show": true }, { "format": "short", "label": null, "logBase": 1, "max": null, "min": null, "show": false } ], "yaxis": { "align": false, "alignLevel": null } }, { "aliasColors": {}, "bars": false, "dashLength": 10, "dashes": false, "datasource": "InfluxDB", "fill": 1, "fillGradient": 0, "gridPos": { "h": 6, "w": 12, "x": 0, "y": 59 }, "id": 48, "interval": "", "legend": { "alignAsTable": true, "avg": true, "current": true, "hideEmpty": false, "hideZero": true, "max": false, "min": false, "rightSide": true, "show": true, "total": false, "values": true }, "lines": true, "linewidth": 1, "links": [], "nullPointMode": "null", "options": { "dataLinks": [] }, "percentage": false, "pointradius": 2, "points": false, "renderer": "flot", "seriesOverrides": [], "spaceLength": 10, "stack": false, "steppedLine": false, "targets": [ { "alias": "$tag_host", "groupBy": [ { "params": [ "$__interval" ], "type": "time" }, { "params": [ "host" ], "type": "tag" }, { "params": [ "null" ], "type": "fill" } ], "measurement": "system", "orderByTime": "ASC", "policy": "default", "query": "SELECT abs(derivative(mean(\"netin\"), 10s)) FROM \"system\" WHERE (\"nodename\" =~ /^$server$/ AND \"object\" = 'lxc') AND $timeFilter GROUP BY time($__interval), \"host\" fill(null)", "rawQuery": true, "refId": "A", "resultFormat": "time_series", "select": [ [ { "params": [ "netin" ], "type": "field" }, { "params": [], "type": "mean" }, { "params": [ "10s" ], "type": "non_negative_derivative" } ] ], "tags": [ { "key": "nodename", "operator": "=~", "value": "/^$server$/" }, { "condition": "AND", "key": "object", "operator": "=", "value": "lxc" } ] } ], "thresholds": [], "timeFrom": null, "timeRegions": [], "timeShift": null, "title": "LCXs Traffic In", "tooltip": { "shared": true, "sort": 0, "value_type": "individual" }, "type": "graph", "xaxis": { "buckets": null, "mode": "time", "name": null, "show": true, "values": [] }, "yaxes": [ { "format": "bps", "label": null, "logBase": 1, "max": null, "min": null, "show": true }, { "format": "short", "label": null, "logBase": 1, "max": null, "min": null, "show": false } ], "yaxis": { "align": false, "alignLevel": null } }, { "aliasColors": {}, "bars": false, "dashLength": 10, "dashes": false, "datasource": "InfluxDB", "fill": 1, "fillGradient": 0, "gridPos": { "h": 6, "w": 12, "x": 12, "y": 59 }, "id": 50, "interval": "", "legend": { "alignAsTable": true, "avg": true, "current": true, "hideEmpty": false, "hideZero": true, "max": false, "min": false, "rightSide": true, "show": true, "total": false, "values": true }, "lines": true, "linewidth": 1, "links": [], "nullPointMode": "null", "options": { "dataLinks": [] }, "percentage": false, "pointradius": 2, "points": false, "renderer": "flot", "seriesOverrides": [], "spaceLength": 10, "stack": false, "steppedLine": false, "targets": [ { "alias": "$tag_host", "groupBy": [ { "params": [ "$__interval" ], "type": "time" }, { "params": [ "host" ], "type": "tag" }, { "params": [ "null" ], "type": "fill" } ], "measurement": "system", "orderByTime": "ASC", "policy": "default", "query": "SELECT abs(derivative(mean(\"netout\"), 10s)) FROM \"system\" WHERE (\"nodename\" =~ /^$server$/ AND \"object\" = 'lxc') AND $timeFilter GROUP BY time($__interval), \"host\" fill(null)", "rawQuery": true, "refId": "A", "resultFormat": "time_series", "select": [ [ { "params": [ "netout" ], "type": "field" }, { "params": [], "type": "mean" }, { "params": [ "10s" ], "type": "non_negative_derivative" } ] ], "tags": [ { "key": "nodename", "operator": "=~", "value": "/^$server$/" }, { "condition": "AND", "key": "object", "operator": "=", "value": "lxc" } ] } ], "thresholds": [], "timeFrom": null, "timeRegions": [], "timeShift": null, "title": "LXCs Traffic Out", "tooltip": { "shared": true, "sort": 0, "value_type": "individual" }, "type": "graph", "xaxis": { "buckets": null, "mode": "time", "name": null, "show": true, "values": [] }, "yaxes": [ { "format": "bps", "label": null, "logBase": 1, "max": null, "min": null, "show": true }, { "format": "short", "label": null, "logBase": 1, "max": null, "min": null, "show": false } ], "yaxis": { "align": false, "alignLevel": null } }, { "collapsed": false, "datasource": null, "gridPos": { "h": 1, "w": 24, "x": 0, "y": 65 }, "id": 52, "panels": [], "title": "Storage Pools", "type": "row" }, { "cacheTimeout": null, "colorBackground": false, "colorValue": false, "colors": [ "#299c46", "rgba(237, 129, 40, 0.89)", "#d44a3a" ], "datasource": "InfluxDB", "format": "percentunit", "gauge": { "maxValue": 1, "minValue": 0, "show": true, "thresholdLabels": false, "thresholdMarkers": true }, "gridPos": { "h": 7, "w": 4, "x": 6, "y": 66 }, "id": 54, "interval": null, "links": [], "mappingType": 1, "mappingTypes": [ { "name": "value to text", "value": 1 }, { "name": "range to text", "value": 2 } ], "maxDataPoints": 100, "nullPointMode": "connected", "nullText": null, "options": {}, "pluginVersion": "6.1.3", "postfix": "", "postfixFontSize": "50%", "prefix": "", "prefixFontSize": "50%", "rangeMaps": [ { "from": "null", "text": "N/A", "to": "null" } ], "sparkline": { "fillColor": "rgba(31, 118, 189, 0.18)", "full": false, "lineColor": "rgb(31, 120, 193)", "show": false }, "tableColumn": "", "targets": [ { "groupBy": [ { "params": [ "$__interval" ], "type": "time" }, { "params": [ "null" ], "type": "fill" } ], "orderByTime": "ASC", "policy": "default", "query": "SELECT last(\"used\") / last(\"total\") FROM \"system\" WHERE (\"host\" = 'local-lvm' AND \"nodename\" =~ /^$server$/) AND $timeFilter GROUP BY time($__interval) fill(null)", "rawQuery": true, "refId": "A", "resultFormat": "time_series", "select": [ [ { "params": [ "value" ], "type": "field" }, { "params": [], "type": "mean" } ] ], "tags": [] } ], "thresholds": "0.75,0.875", "timeFrom": null, "timeShift": null, "title": "local-lvm Usage", "transparent": true, "type": "singlestat", "valueFontSize": "80%", "valueMaps": [ { "op": "=", "text": "N/A", "value": "null" } ], "valueName": "current" }, { "cacheTimeout": null, "colorBackground": false, "colorValue": false, "colors": [ "#299c46", "rgba(237, 129, 40, 0.89)", "#d44a3a" ], "datasource": "InfluxDB", "format": "percentunit", "gauge": { "maxValue": 1, "minValue": 0, "show": true, "thresholdLabels": false, "thresholdMarkers": true }, "gridPos": { "h": 7, "w": 4, "x": 10, "y": 66 }, "id": 63, "interval": null, "links": [], "mappingType": 1, "mappingTypes": [ { "name": "value to text", "value": 1 }, { "name": "range to text", "value": 2 } ], "maxDataPoints": 100, "nullPointMode": "connected", "nullText": null, "options": {}, "pluginVersion": "6.1.3", "postfix": "", "postfixFontSize": "50%", "prefix": "", "prefixFontSize": "50%", "rangeMaps": [ { "from": "null", "text": "N/A", "to": "null" } ], "sparkline": { "fillColor": "rgba(31, 118, 189, 0.18)", "full": false, "lineColor": "rgb(31, 120, 193)", "show": false }, "tableColumn": "", "targets": [ { "groupBy": [ { "params": [ "$__interval" ], "type": "time" }, { "params": [ "null" ], "type": "fill" } ], "orderByTime": "ASC", "policy": "default", "query": "SELECT last(\"used\") / last(\"total\") FROM \"system\" WHERE (\"host\" = 'local-lvm-test' AND \"nodename\" =~ /^$server$/) AND $timeFilter GROUP BY time($__interval) fill(null)", "rawQuery": true, "refId": "A", "resultFormat": "time_series", "select": [ [ { "params": [ "value" ], "type": "field" }, { "params": [], "type": "mean" } ] ], "tags": [] } ], "thresholds": "0.75,0.875", "timeFrom": null, "timeShift": null, "title": "local-lvm-test Usage", "transparent": true, "type": "singlestat", "valueFontSize": "80%", "valueMaps": [ { "op": "=", "text": "N/A", "value": "null" } ], "valueName": "current" }, { "cacheTimeout": null, "colorBackground": false, "colorValue": false, "colors": [ "#299c46", "rgba(237, 129, 40, 0.89)", "#d44a3a" ], "datasource": "InfluxDB", "format": "percentunit", "gauge": { "maxValue": 1, "minValue": 0, "show": true, "thresholdLabels": false, "thresholdMarkers": true }, "gridPos": { "h": 7, "w": 4, "x": 15, "y": 66 }, "id": 55, "interval": null, "links": [], "mappingType": 1, "mappingTypes": [ { "name": "value to text", "value": 1 }, { "name": "range to text", "value": 2 } ], "maxDataPoints": 100, "nullPointMode": "connected", "nullText": null, "options": {}, "pluginVersion": "6.1.3", "postfix": "", "postfixFontSize": "50%", "prefix": "", "prefixFontSize": "50%", "rangeMaps": [ { "from": "null", "text": "N/A", "to": "null" } ], "sparkline": { "fillColor": "rgba(31, 118, 189, 0.18)", "full": false, "lineColor": "rgb(31, 120, 193)", "show": false }, "tableColumn": "", "targets": [ { "groupBy": [ { "params": [ "$__interval" ], "type": "time" }, { "params": [ "null" ], "type": "fill" } ], "orderByTime": "ASC", "policy": "default", "query": "SELECT last(\"used\") / last(\"total\") FROM \"system\" WHERE (\"host\" = 'local' AND \"nodename\" =~ /^$server$/) AND $timeFilter GROUP BY time($__interval) fill(null)", "rawQuery": true, "refId": "A", "resultFormat": "time_series", "select": [ [ { "params": [ "value" ], "type": "field" }, { "params": [], "type": "mean" } ] ], "tags": [] } ], "thresholds": "0.75,0.875", "timeFrom": null, "timeShift": null, "title": "local Usage", "transparent": true, "type": "singlestat", "valueFontSize": "80%", "valueMaps": [ { "op": "=", "text": "N/A", "value": "null" } ], "valueName": "current" } ], "refresh": "10s", "schemaVersion": 20, "style": "dark", "tags": [ "ProxMox", "Storage", "Hypervisor" ], "templating": { "list": [ { "allValue": null, "current": { "text": "cloud", "value": "cloud" }, "datasource": "InfluxDB", "definition": "SHOW TAG VALUES FROM system WITH KEY=host WHERE object='nodes'", "hide": 0, "includeAll": false, "label": "Server", "multi": true, "name": "server", "options": [], "query": "SHOW TAG VALUES FROM system WITH KEY=host WHERE object='nodes'", "refresh": 1, "regex": "", "skipUrlSync": false, "sort": 5, "tagValuesQuery": "", "tags": [], "tagsQuery": "", "type": "query", "useTags": false } ] }, "time": { "from": "now-24h", "to": "now" }, "timepicker": { "refresh_intervals": [ "5s", "10s", "30s", "1m", "5m", "15m", "30m", "1h", "2h", "1d" ], "time_options": [ "5m", "15m", "1h", "6h", "12h", "24h", "2d", "7d", "30d" ] }, "timezone": "", "title": "Proxmox", "uid": "kxQQuHRZk", "version": 29 }
- Import .
- . , Dashboard' Gitlab. , , Prometheus , Datastore Grafana , external, datastore.
The jamb came out with screenshots from fresh Grafana, so I'm sorry for the quality.