You have spent an infinite amount of time optimizing the Unity UI. But in order to cause inhibition, a small modification of the tiny attribute of the almost invisible UI Canvas element is enough. And when that happens, even profiling Unity UI will not save you from lowering FPS. Are you ready for a long bug fix?
This is exactly what happened in my last project ...
I worked hard to optimize several UI panels in the port of our game on Oculus Quest . Basically, the task was to reduce the overdraw level to acceptable values so that the GPU could cope with the most important thing - real 3D rendering.
So I worked on optimizing Unity UI for at least a month, and over time I made pretty damn good progress.
At some point, the UI became so optimized that it barely affected the GPU timings. The dimming techniques of the opaque UI that I implemented compensated for most of the redraws caused by layering the UI (elements drawn on top of other elements).
So, I got a highly optimized hybrid UI system, which essentially overlapped the 3D elements drawn under it. It has become very easy to discard the rendering of these overlapped fragments.
However, the work was still far from complete ...
When I plugged in the Unity UI Profiler , one thing caught my attention.
I saw that an overloaded CPU spends more than 1 ms in each frame on rendering the UI. This is a lot of time for a platform that gives you a budget of 13 ms for the entire game: physics, logic, 3D rendering, input, VR and network code.
And after all there were cases when the UI “killed” the CPU performance even more.
Unity UI: costly build batches
And this says one thing: the UI can be optimized for the GPU, but this does not necessarily mean optimization for the CPU .
In fact, when rendering Unity UI, the CPU and GPU tasks are very different. Not surprisingly, I recommend approaching CPU and GPU optimization differently, and this was discussed in my previous post about Unity UI optimization .
Further profiling of the Unity UI revealed an obvious problem: the UI was constantly recreated in every new frame, i.e. Canvas (Canvas Rebuild) was rebuilt in each frame .
Constant load on the CPU for 1 ms ... oh-oh.
But why is Unity doing this to me? I thought Unity caches all of the Canvas interfaces ...
Actually yes, it is. Unity effectively caches Canvas so that they are collected only once.
However, the problem arises when you change the properties of any of the UI elements in the Canvas - color, position, and so on.
That is, all the animations we love, for example, the effects of buttons when you hover, kill productivity, and you probably don't know that.
When a UI property change occurs, Unity runs the famous Canvas Rebuild, which ruins the game’s performance .
The Canvas Rebuild of the interface forces the Unity engine to iteratively traverse all the elements of this Canvas UI to generate an optimized list of draw calls (many vertices, colors, materials, etc.). And the Canvas Rebuild takes longer than the Seat Panda takes to accelerate from zero to 60 mph .
Realizing that we are constantly suffering from Canvas Rebuild, it would be logical to ask a question ...
Why do we suffer from Canvas Rebuilds and what can be done about it?
To answer this simple question, I had to spend more than 5 hours studying the topic and working with the Unity UI Profiler .
Let's get it right.
1. Profiling Unity UI: all is well, for now ...
Imagine that we have a simple UI.
This UI does nothing, it just appears on the screen and annoys the player trying to see something through it.
As a set of 350+ images in the Grid Layout Group, it looks like this:
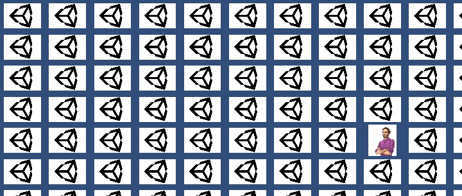
Unity UI Profiling Example
And everything is in order, even despite 350-odd images. In the standard case, the UI will render in just two draw calls, because there are only two unique images in it that are not in the sprite atlas.
In fact, in the profiler, I can see that there is practically no load on the part of the CPU. Most of the time spent on the UI is less than 0.01 ms , which is pretty damn good.
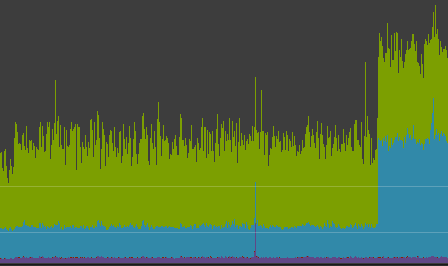
Unity UI Profiling: A Mysterious Surge
(… Most part of time)
Wait, where did this surge in CPU resources come from at the end of the graph?
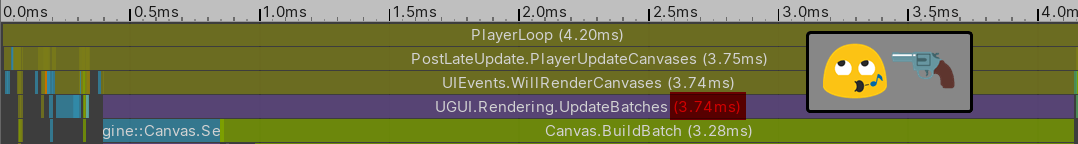
2. Unity UI Profiling: Sudden Canvas Rebuild!
What happened at the end of the Unity Profile? Very strange, in just a second, the CPU overhead on the Unity UI was more than double that.
I want to play a game
Find the two differences in the examples below (you may have to open the images in a separate window to see better) .

Unity UI Profiling: Low-Cost Canvas

Unity UI Profiling: Canvas Rebuild
I give you five seconds to figure it out.
5, 4 ... okay, here is a tip to simplify the task:

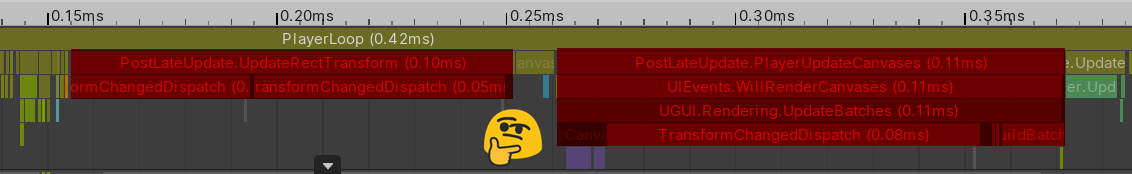
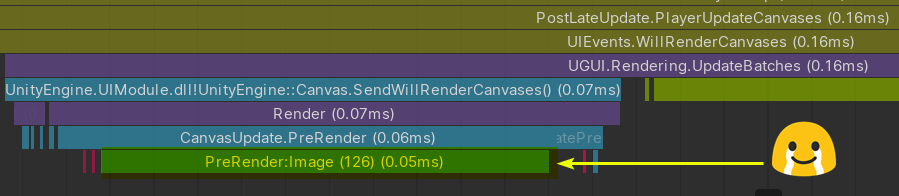
Unity UI Profiling: Overhead Canvas Rebuild
Wow!
PostLateUpdate.UpdateRectTransform
and
UGUI.Rendering.UpdateBatches
strongly want to become the main stars of this show.
What do these areas do?
The first,
UpdateRectTransform
, makes it clear that the transform of some object has changed, and therefore Unity has to perform expensive logic to reflect visual changes. We do not know if it was a position, rotation, scale or any other of the properties of
RectTransform
.
Hell, we don’t even know if it was just one attribute, or all at once. Was it a single object or several? And which ones? That’s the problem: we don’t know .
The second expensive piece,
UpdateBatches
, is related to the need to rebuild the entire Canvas geometry. This process is called Canvas Rebuild . Rebuilding Canvas means that Unity goes around the entire Canvas hierarchy to generate a list of draw calls. The vertices, indices, colors, and uv of all elements are calculated, and then a passing pass is performed to combine the maximum possible number of draw calls to reduce the excessive load on the CPU, which transfers it to the graphics driver.
Now we seem to know what is happening and are on the right track. But how to avoid this Canvas overhaul? What causes them?
We need more specific information ...
Summarize
- Changing an attribute in a UI element marks the element itself as dirty
- The UI element can be completely dirty, but it can also be partially: dirty tops, dirty layout, dirty materials. It’s easier to recover from partially dirty states
- Once any Canvas elements are marked as dirty, Unity rebuilds it completely
- Canvas rebuilds are expensive for the CPU, so the most important thing to avoid is
3. Looking for a pest: a politically incorrect way of brute force
We still need to answer the following question:
What causes these Canvas Rebuild?
It turns out that there is no quick way to find out, especially with a large Canvas hierarchy.
But first, I'll show you a brute force method to find the reason for Canvas Rebuild .

1. Let Unity UI Profiler Continue Recording
We’ll filter out the metrics so that we can focus on the most important: rendering, scripts and UI.
Track the initial mark to understand the costs of the current scheme, which should include the costly Canvas Rebuild.
2. Deactivate Game Objects from the UI and compare readings
Select the group of game objects and deactivate them.
Compare performance metrics.
If the readings have not improved much, then continue to deactivate game objects until you see a significant improvement.

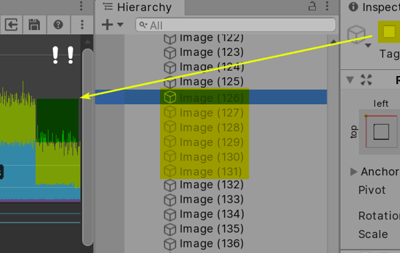
3. Find what changes its properties
We were able to select the object that calls the Canvas Rebuild. But what exactly becomes their cause?
Perhaps its scale changes through the script? Or is his position changing by animation?
It will be convenient to right-click on the RectTransform and select " Find References in Scene "
When you find out what causes the Canvas rebuild, do something about it, for example, turn off animations or transformations.
Ruben, but how do I use this method with a huge hierarchy of UI? Don't tell me bullshit
I said that the process will be neither quick nor interesting, but the players will be grateful to you.
That is the point. Firstly, the existence of a huge hierarchy is not an ideal situation. It is such massive and deep hierarchies that make Canvas Rebuild so expensive for the CPU.
But large and nested UI hierarchies can (and will) arise, so expect the Canvas Rebuild to hit the most important thing most: the gameplay.
Although the brute force method helps find the source of Canvas overhaul, it does not scale well in the long run.
Having become more professional in optimizing UI, I created a tool that gives all the answers I need so that the project meets the expectations of the players ...
Profiling Canvas Rebuild
4. Bonus: Enhancing Unity Profiler UI Optimization Features
I hope you already understand how frequent and disturbing Canvas Rebuild can be.
These perestroika, which infected my game, took away as much as 10% of the entire CPU budget!
As we have seen, there is a brute force method for finding Canvas Rebuild sources. Perhaps you can deal with them using the strategies listed in my post about optimizing Unity UI .
But such an error-prone process would never satisfy a real guru. You can spend several days struggling with Canvas Rebuild, but at the most unexpected moment they will return to disappear as soon as you plug in the Unity UI Profiler.
If you are developing a game for VR, this becomes critical. We do not want Canvas to be rebuilt in the UI of world space. If you cannot get rid of perestroika, then your players most likely will not stand it.
Alright, I get the idea of getting rid of Canvas Rebuilds. But Unity Profiler provides almost no information on them! What can you advise?
Glad you asked. It turns out that we can convince Unity Profiler to provide us with useful information about what hinders UI performance .
We can extend the functionality of Unity UI Profiler . To do this, you need to modify the publicly available Unity UI source code. Once you get to the source code, you will need to find the code functions in which the Canvas Rebuilds occur . Then we need API magic with the BeginSample and EndSample profiler .
If you are running Unity 2019.1 or earlier, the source code for Unity UI is in the Bitbucket repository . There is also a guide for downloading, installing and modifying.
What do I advise? Use a newer version of Unity, not lower than 2019.2.0. Newer versions of Unity come by default with the source UI , as the UI system is now part of the package manager. This is the most hassle-free way.
Here is a list of pieces of code that I discovered during my research where I can add Profiling API calls:
- CanvasUpdateRegistry.cs : PerformUpdate Function
- Graphic.cs : SetAllDirty function
- Graphic.cs : other functions like SetVerticesDirty , SetMaterialDirty , etc ...
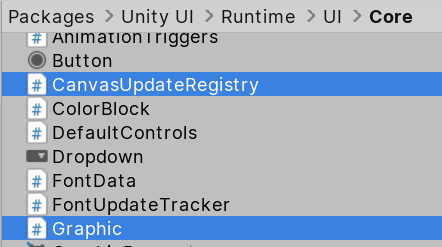
Unity UI: Profiling Source
Is it helpful? Yes.
Convenient for the artist / designer? Not.
It was the poet who wrote the small open source Unity Extension that extends the capabilities of the Unity Profiler .
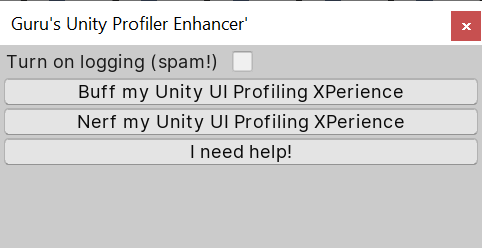
This free tool will allow us to quickly switch between different profiling modes to ensure maximum game performance.
What is the best thing about this Unity Profiler expander? It works outside the editor, essentially relieving you of all the headache when profiling UI for Android and other platforms.
Here it is, all its power is controlled by just two buttons:
- Buff my Unity Profiler
- Nerf my Unity Profiler .
You can get this tool here .