Continuous Profiling in Go
pprof is the main profiling tool in Go. The profiler is included in the Go standard library and a lot has been written about it over the years. To connect pprof to an existing application, you just need to add one line of code:
import _ “net/http/pprof”
In the default HTTP server - net/http.DefaultServeMux
- handlers that send profiling results will be registered along the path /debug/pprof/
.
curl -o cpu-profile.pb.gz http://<server-addr>/debug/pprof/profile
(for more details see https://godoc.org/net/http/pprof )
But from experience, it is not always so simple and in practice using pprof in battle, there are pitfalls.
To begin with, we do not want the profiler handlers to stick out on the Internet. Profiling is cheap, in terms of overhead, but not free, and the profile itself contains information about the internal structure of the application, which is often not advisable to open to outsiders. You have to make sure that the /debug
path is not accessible to unauthorized users. Access can be limited on the proxy server side or the pprof server can be moved to a separate port, access to which will be open only through the privileged host.
But what if the application does not involve HTTP access at all - for example, is it an offline queue processor?
Depending on the state of the infrastructure in the company, a “sudden” HTTP server inside the application process may raise questions from the operations department;) The server additionally limits the possibilities for horizontal scaling, because it will not work just to run multiple instances of the application on the same host - the processes will conflict, trying to open the same TCP port for the pprof server.
It is “simple” to solve by isolating each application process in the container (or by launching the pprof server on a unique port, or UNIX socket). You will not surprise anyone anymore with a service horizontally scaled into hundreds of instances, “spread out” across several data centers. In a very dynamic infrastructure, containers with the application can periodically appear and disappear. And we still need to somehow contact the profiler. And that means that regardless of the selected scaling method, search mechanisms for a specific application instance and the corresponding pprof server port are needed.
Depending on the characteristics of the company, the very availability of the ability to access something that is not related to the main production activity of the service may raise questions from the security department;) I worked in a company where, for objective reasons, access to anything is on the side Production was exclusively in the operations department. The only way to run the profiler on a running application was to open the task in the operation bug tracker, with a description of which curl command, in which DC, which server you want to run on, what result to expect and what to do with it.
Or imagine a situation: a working morning. You opened Slack and found out that in the evening, in one of the production service processes “something went wrong”, “somewhere, something“ shut down ”,“ memory started to flow ”,“ CPU graphics crawled up ”or the app just started to panic. The duty operating teams (or OOM Killer) did not dig deep and simply restarted the application or rolled back the latest release of the previous day.
After the fact, it’s not easy to understand such situations. It’s great if you can reproduce the problem in a test environment (or in an isolated part of the production that you have access to). You can collect the necessary data with all the tools that are at hand, and then figure out which component the problem is.
But if there is no obvious way to reproduce the problem, are we left only with yesterday's logs and metrics? In such situations it’s always a shame that you can’t rewind time to the moment when the problem was visible in the production and quickly collect all the necessary profiles, so that later, in a quiet mode, do analysis.
But if pprof is relatively cheap, why not collect profiling data automatically, at some intervals, and store them somewhere separate from the production, where you can give access to all those interested?
In 2010, Google published the Google-Wide Profiling: A Continuous Profiling Infrastructure for Data Centers document, which describes an approach to continuous profiling of company systems. And after some years, the company launched a continuous profiling service - Stackdriver Profiler - available to everyone.
The principle of operation is simple: instead of a pprof server, a stackdriver agent is connected to the application, which, using the runtime/pprof
API directly, periodically collects different types of profiling from the application and sends profiles to the cloud. All that the developer needs, using the Stackdriver control panel, select the desired application instance in the desired AZ and you can, after the fact, analyze the application at any time in the past.
Other SaaS providers provide similar functionality. But, your company’s security rules may prohibit exporting data beyond its own infrastructure. And the services that allow you to deploy a continuous profiling system on your own servers, I have not seen.
All the difficulties and ideas described above are far from new and specific not only to Go. With them, in one form or another, developers are faced with in almost all the companies where I worked.
At some point, I was curious to try to build an analogue of the Stackdriver Profiler for an arbitrary Go-service that could solve the problems described. As a hobby project, in my free time, I work on profefe ( https://github.com/profefe/profefe ) - an open service of continuous profiling. The project is still at the stage of experiments and periodic discussions, but is already suitable for testing.
The tasks that I set for the project:
- The service will be deployed on the company's internal infrastructure.
- The service will be used as an internal tool of the company. You can trust suppliers and consumers of data: at the early stages, you can omit the authorization of write / read requests and not try to protect yourself from malicious use in advance.
- The service should not have any special expectations from the company's infrastructure: everything can live in the cloud or in its own DCs; profiled applications can be run inside containers ("everything is controlled by the Kubernetes") or can run on bare metal.
- The service should be easy to operate (it seems to a certain extent, Prometheus is a good example).
- It should be understood that the selected architecture may not satisfy the conditions in which the service will be used. Most likely, you will need the ability to expand / replace system components to scale "on the spot."
- In accordance with (4), we must try to minimize the required external dependencies. For example, a service should somehow look for instances of profiled applications, but, at least in the initial stages, I want to do without an explicit service discovery.
- The service will store and catalog profiles of Go-applications. We expect that one pprof file occupies 100KB — 2MB ( heap profiles are usually much larger than CPU profiles ). From one profiled instance, it makes no sense to send more than N profiles per minute (one Stackdriver agent sends, on average, 2 profiles per minute). It’s worth immediately calculating that a single application can have from several to several hundred instances.
- Through the service, users will search for different types of profiles (cpu, heap, mutex, etc.) of the application or a specific instance of the application for a certain period of time.
- From the service, the user will request a separate pprof profile from the search results.
Now profefe consists of two components:
profefe-collector is a service collector with a simple RESTful API.
The collector's task is to get the pprof-file and some meta-data and save them in the permanent storage. The API also allows customers to search profiles by meta-data in a certain time window or read a specific profile (or a group of profiles of the same type) from the store.
agent - an optional library that should be connected to the application instead of the pprof server. Inside the application, in a separate goroutine, the agent periodically starts the profiling process (using runtime/pprof
), and sends the received pprof profiles, along with meta data to the collector.
Meta data is an arbitrary key-value set that describes an application or its individual instance. For example: service name, version, data center and host where the application is running.

Profefe Component Interaction Diagram
I mentioned above that the agent is an optional component. If it is not possible to connect it to an existing application, but the net/http/pprof
server is already connected in the application, profiles can be removed using any external tools and send pprof files to the collector via the HTTP API.
For example, on hosts, you can configure a cron task that will periodically collect profiles from running instances and send them to profefe for storage;)
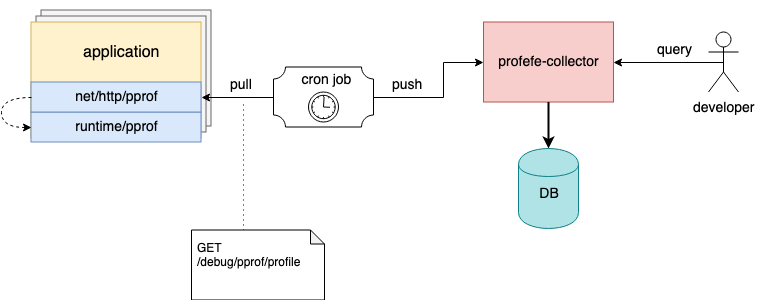
Cron task collects and sends application profiles to profefe collector
You can read more about profefe API in the documentation on GitHub .
Plans
So far, the only way to interact with the profefe collector is the HTTP API. One of the tasks for the future is to assemble a separate UI service through which it will be possible to visually show the stored data: search results, a general overview of cluster performance, etc.
Collecting and storing profiling data is not bad, but "without use, data is useless." The team where I work has a set of experimental tools for collecting basic statistics on several pprof profiles from the service. This helps a lot in analyzing the consequences of updating the key dependencies of the application or the results of a large refactoring ( unfortunately, performance in production does not always meet expectations based on the launch of isolated benchmarks and profiling in a test environment ). I want to add similar functionality to compare and analyze stored profiles in the profefe API.
Despite the main focus of profefe, the continuous profiling of Go services, the pprof profile format is not at all tied to Go. For Java, JavaScript, Python, etc. there are libraries that allow you to get profiling data in this format. Perhaps profefe may become a useful service for applications written in other languages.
Among other things, the repository has a number of open questions described in the project tracker on GitHub .
Conclusion
In the last few years, a popular idea has been entrenched among developers: to achieve the “ observability ” of a service, three components are needed: metrics, logs, and “ three pillars of observability ”. It seems to me that visibility is the ability to effectively answer questions about the health of the system and its components. Metrics and tracing make it possible to understand the system as a whole. Logs cover the deliberately described parts of the system. Profiling is another signal to achieve visibility, allowing you to understand the system at the micro level. Continuous profiling over a period of time also helps to understand how the individual components and the environment influenced and affect the operability and productivity of the entire system.
All Articles