The structure of the Data Science project aerial view
How to know for sure what is inside the kolobok?
Maybe you swallow it, and inside it is a river? © Tanya Zadorozhnaya
What is Data Science today, it seems, not only children, but also pets know. Ask any cat, and he will say: statistics, Python, R, BigData, machine learning, visualization and many other words, depending on qualifications. But not all cats, as well as those who want to become a Data Science specialist, know exactly how the Data Science project is structured, what stages it consists of and how each of them affects the final result, how resource-intensive each of the project stages is. To answer these questions, the methodology is usually used. However, most of the training courses on Data Science do not say anything about the methodology, but simply more or less consistently reveal the essence of the technologies mentioned above, and every beginner of Data Scientist gets to know the structure of the project from his own experience (and rake). But personally, I like to go to the forest with a map and a compass, and I like to pre-imagine the route plan that you are moving. After some searches, I managed to find a good methodology from IBM, a well-known manufacturer of guides and methods for managing anything.
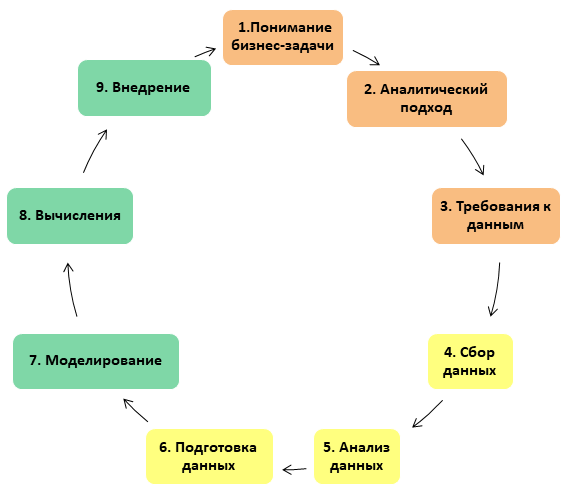
So, in a Data Science project, there are 3 blocks of 3 stages in each, a total of 9 stages. In short, the project consists of working with business requirements, data and the model itself.
Work with business requirements
At this step, we do not know anything about what data we have. We must delve into the statement of the problem, understand what result is required to get from the project, learn all about the participants and stakeholders. Further, in accordance with a specific task, we must decide by what method the problem will be solved. The result of this step will be data requirements: ok, the task is clear, the method has been chosen, now we’ll think about what we may need for a successful solution?
Work with data
At the second step, we begin to search for data to solve the problem: we find out which sources are available to us, and form a sample with which we will continue to work. After the data are collected, it is necessary to conduct a series of studies in order to better understand how the sample is organized: to investigate the central position and variability, to identify correlations between features, to build distribution graphs. After this stage, you can begin to prepare the data. As a rule, this stage is the most labor-intensive and can take up to 90% of the total project time, but the success of the entire project depends on how well it is completed.
Development and implementation
Finally, the third step. Once the data is ready, you can proceed with the actual development and implementation. We program the model, set it on the training sample, check it on the test one, if the result is satisfactory, then demonstrate it to the customer, implement it, assemble the feedback and ... you can start all over again.
The whole process is presented in the form of a vicious circle: in a good way, a DS-project can never be considered finalized (approximately, like a repair, which, as you know, cannot be completed, but can only be stopped):
Let's go into more detail on each of the stages.
1. Understanding the business challenge
This stage is the foundation for all subsequent work: without it you cannot build anything. It is necessary to clearly define the purpose of the study: what is the problem? Why should the problem be resolved? Who is affected by the problem? What are the alternatives? And most importantly: by what metrics will the success of the project be evaluated?
In other words, it is necessary to clearly identify the goal of the customer. For example, a business owner asks: can we reduce the cost of a certain activity? Need to clarify: is the goal to increase the effectiveness of this activity? Or increase business revenue?
Once the goal is defined, you can proceed to the next step.
2. The analytical approach
Now you need to choose an analytical approach to solve a business problem. The choice of approach depends on what type of answer you need to get in the end: if the answer should be yes / no, a naive Bayesian classifier is suitable. If you need an answer in the form of a numerical sign, then regression models are suitable. Decision trees can deal with both numerical and categorical data. If the question is to determine the probabilities of certain outcomes, it is necessary to use a predictive model. If links need to be identified, a descriptive approach is used.
3. Data Requirements
When the purpose of the study is clearly defined and the approach is chosen, that is, we clearly understand what kind of answer to the question we are looking for, it is necessary to determine what data will allow us to give the desired answer. We must prepare data requirements: content, formats and sources that will be used in the next stage of the project.
4. Data collection
At this stage, we collect data from available sources: make sure that the sources are available, reliable and can be used to obtain the required data in the required quality. After the initial data collection is completed, it is necessary to understand whether we received the data that we wanted. At this stage, you can revise the data requirements and make decisions about the need for additional data (that is, there is a possibility that you will have to return to stage 3). Lacunae can be identified in the data and a plan can be drawn up on how to close them or find a replacement.
5. Data Analysis
Data analysis includes all sampling design work. At this stage, it is necessary to obtain an answer to the question: are the collected data representative of the task?
Here we need descriptive statistics. It applies to all variables that will be used in the selected model: the central position (mean, median, mode) is examined, outliers are searched for and variability is estimated (as a rule, this is the magnitude, variance and standard deviation). Histograms of the distribution of variables are also constructed. Histograms are a good tool to understand how data values are distributed and what kind of preparation is needed so that the variable is most useful when building a model. Other visualization tools, such as mustache boxes, may also be useful.
Next, a pairwise comparison is performed: correlations between the variables are calculated to determine which of them are related and how much. If there are significant correlations between the variables, some of them may be discarded as redundant.
6. Data preparation
Together with the collection and analysis of data, data preparation is one of the most resource-intensive activities of the project: these phases can take 70, or even 90% of the project time. At this stage, we process the data in such a way that it is convenient to work with it: delete duplicates, process missing or incorrect data, check and, if necessary, correct formatting errors.
Also at this stage we are constructing a set of factors that machine learning will work with at the next stages: we extract and select features that will potentially help solve a business problem. Errors at this stage may turn out to be critical for the entire project, therefore it is worth paying special attention to it: an excessive number of attributes can lead to the model being retrained, and insufficient if the model is under-trained.
7. Building a model
The choice of model, as you can see, is carried out at the very beginning of the work and depends on the business task. Thus, when the model type is defined and there is a training sample, the analyst develops the model and checks how it works on the set of features created in step 6.
8. Application of the model
Application of the model is closely linked with the actual construction of the model: calculations alternate with tuning the model. At this stage, we must answer the question of whether the constructed model meets the business task.
The calculation of the model has two phases: diagnostic measurements are performed that help to understand whether the model is working as intended. If a predictive model is used, a decision tree can be used to understand that the output of the model matches the original plan. In the second phase, the statistical significance of the hypothesis is checked. It is necessary to make sure that the data in the model are correctly used and interpreted and the result obtained is beyond the statistical error.
9. Implementation
If the model gives us a satisfactory answer to the question, this answer should begin to be beneficial. When the model is developed, and the analyst is sure of the result of his work, it is necessary to introduce the customer to the developed tool. It makes sense to attract not only the owner of the product, but also other interested parties: marketing, developers, system administrators: everyone who can somehow influence the further use of the project results. Next, you need to move on to implementation. Implementation can occur in stages, for example, for a limited group of users or in a test environment. It is also necessary to establish a feedback system in order to track how successfully the developed model copes with the task. After some time, this feedback will be useful in order to improve the model. New data sources, new stakeholders may also appear, not to mention the fact that the business task itself can be specified. Thus, there is no limit to perfection: even an embedded model can never be considered ideal.
All Articles