How to turn traffic into sales using site user data
It is important for business not only to attract new customers, but also to retain them, return to the site and motivate to make repeat purchases. My four-year experience as a web analyst has shown that many business owners do not interact with current customers simply because they do not know how to do this. Today I will tell you how to return customers again and again using RFM analysis.
Segmentation and targeting - alpha and omega marketing. You can disagree with this statement and shoot endlessly at the sparrows from the cannon. It is wiser and more efficient to analyze user behavior, break the audience into segments and offer each group a personalized solution. Let's look at a specific technique and learn how to apply RFM analysis to segment the customer base.
So, RFM is a customer analysis based on three indicators: prescription, frequency and value of purchases. During this analysis, the data is segmented in accordance with the following indicators:
According to these indicators, the customer base is segmented, and then individual communication can be conducted with each of these groups. This approach leads to an increase in the total number of purchases, as customers return.
First of all, it is necessary for B2C companies with a client base of more than 10,000 contacts. This is a conditional restriction, the base may be smaller, in this case the number of clusters into which the audience is divided will simply be reduced. In B2B companies, RFM analysis is not very popular, but it can also be used by marketers and business owners.
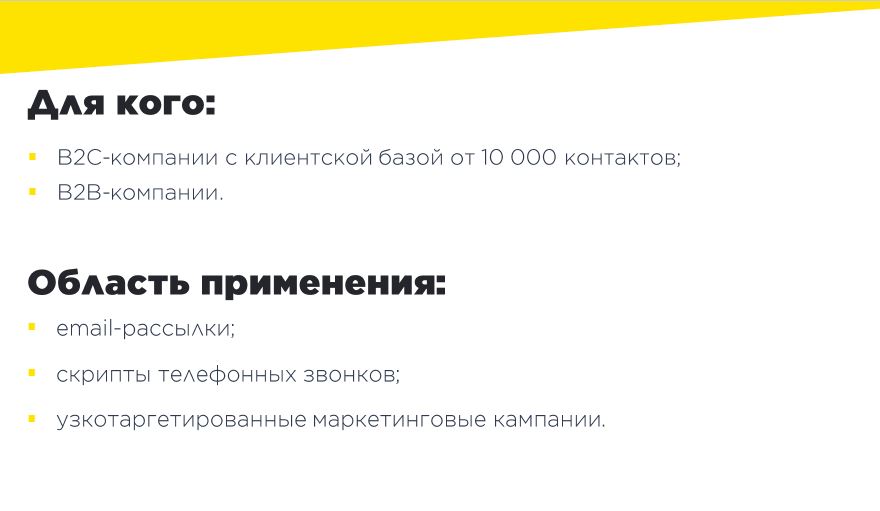
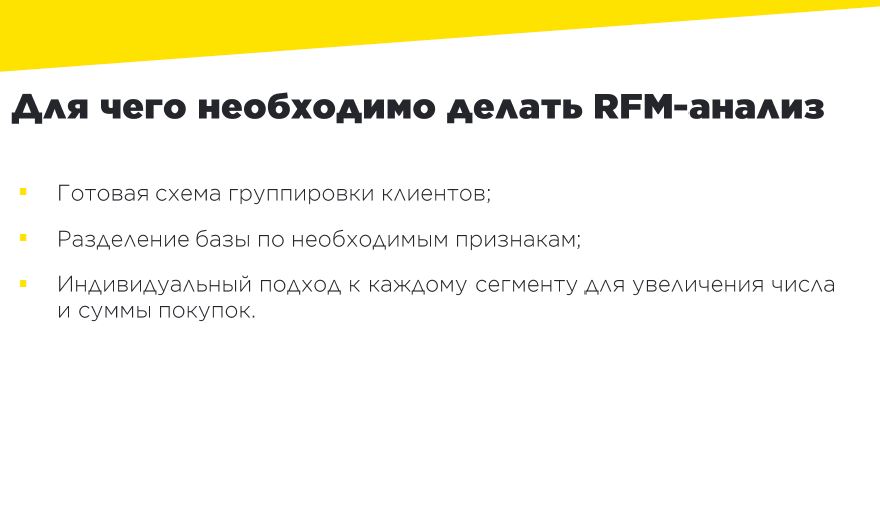
RFM analysis provides a ready-made scheme that allows you to apply an individual approach to each group of customers. You group customers and predict their behavior based on past actions. For example, those who buy often and a lot receive special offers, and those who have not bought anything for a long time, receive a bonus or discount + targeting to remind themselves of themselves.
Most often, the results of RFM analysis are used in working with email newsletters. It is also useful when preparing telephone call scripts (according to the script, the manager can process a client from a certain cluster) and, in principle, for any narrowly targeted marketing campaigns: for example, retargeting or remarketing.
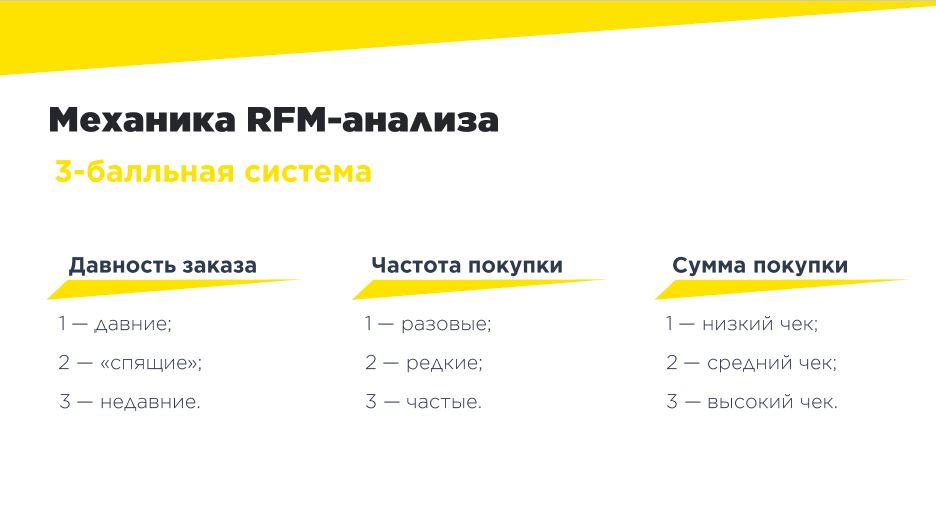
The entire RFM analysis is divided into a three-point system: prescription, frequency and amount of purchases. In turn, the prescription of the order is divided into long-standing, "sleeping" and recent orders. Frequency purchases are divided into one-time, rare and frequent. The amount of purchases is divided into low, medium and high point.
We compare these parameters and get the segments of the site users. There can be up to 27.
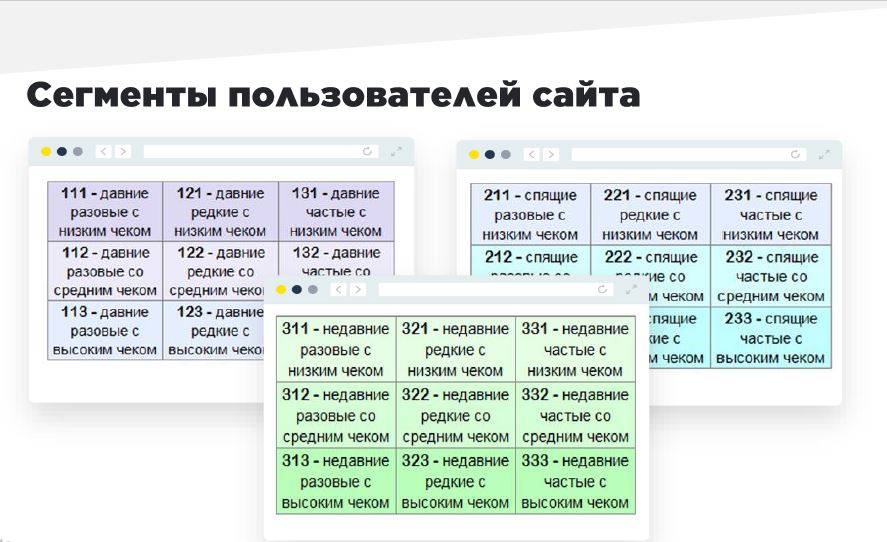
In practice, there may be fewer. The number of segments depends on the customer base, how diverse it is, how different the user groups are.
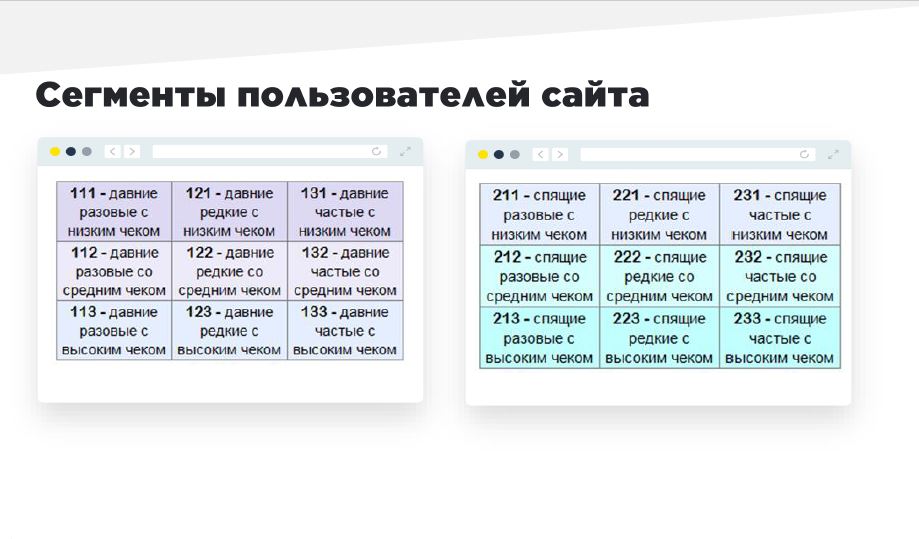
Manual analysis is laborious, it is better to use Excel pivot tables. I will teach you how to quickly and easily do RFM analysis in Excel in 5-7 minutes.
First you need to unload from CRM or another database:

These three parameters are enough to make a simple, quick and, most importantly, free RFM analysis. Next, let's create and configure a pivot table. Using pivot tables (click on Insert - Pivot Table), we transfer all three of these parameters to a new screen.
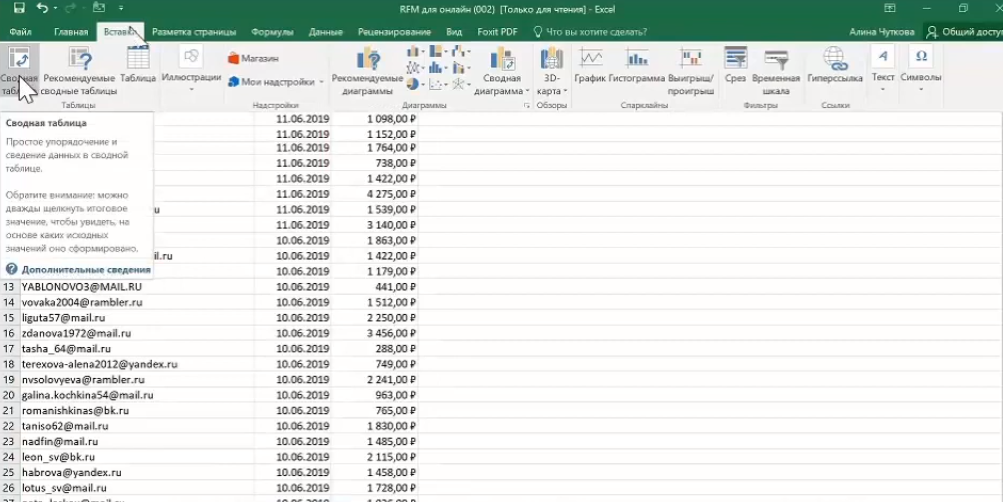
There are three fields in the fields of the Pivot Table - email, Purchase Date and Purchase Amount - they must be divided into Rows and Values. In Strings, we place one single indicator, in this case, these are email addresses (this can be phone numbers, any contacts). It is important to note that the emails in this column are already unique, they are not duplicated.
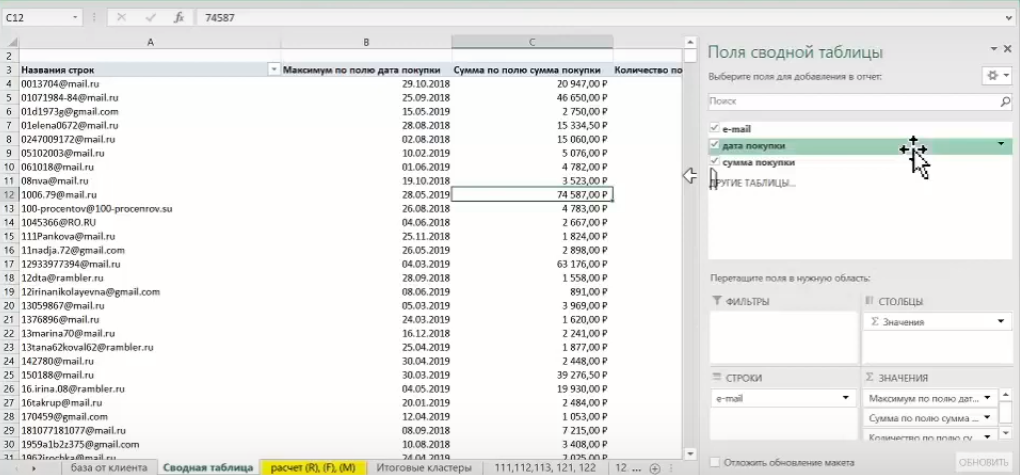
In the value Next, we consider for each user indicators such as: the number of purchases and the sum of all purchases. An important parameter is the Maximum purchase date field. This displays the date of the user's last purchase. It is needed to calculate how long the user has bought something, this calculation will determine the customers in a particular cluster.
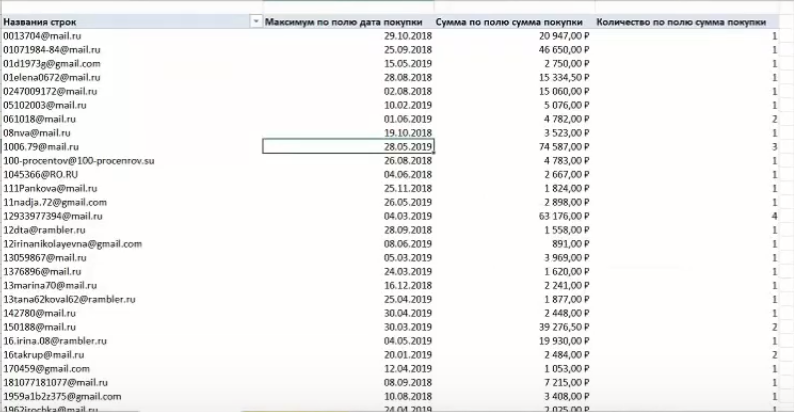
Here is a simple pivot table in almost three clicks. All that is needed for the calculation is to place it in separate fields:
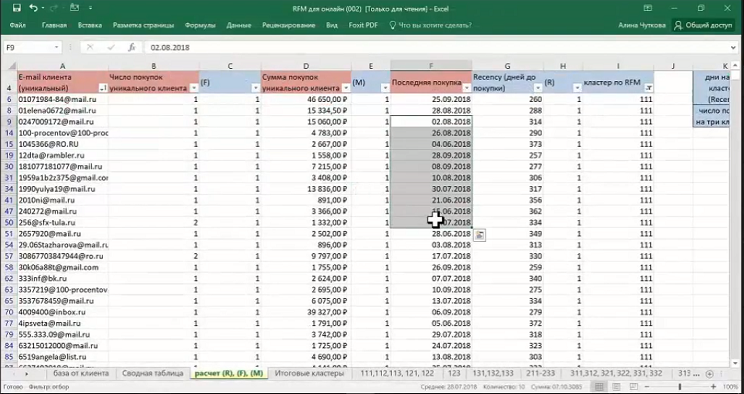
Now we have a pivot table with RFM calculation. Depending on how much, how often and how much the customer made purchases, the formula calculates and assigns from 1 to 3 values to each client. Next, we define an RFM cluster - a formula by which these three numbers are combined, we get a segment or group to which these or other users belong.

This data is collected in an RFM cluster. This is how all these clusters look.
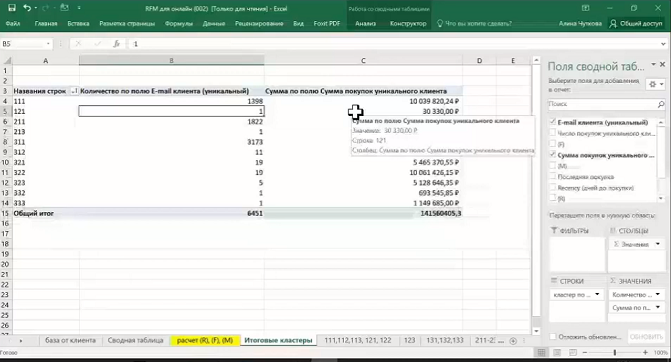
Now you can select a segment (for example, customers who bought only a very long time ago) and already purposefully work with this database. Segments can be uneven, that is, one includes 74 people, the other only 1, and the segments themselves 27. Sometimes it happens that there is only one user in a separate cluster. In such cases, it is better to attach it to the nearest large cluster, where customers with similar characteristics.
A complete guide to creating RFM analysis and technical guidance can be found in our webinar “How to Turn Traffic into Sales Using Site User Data”:
After we learned how to divide clients into clusters, let's figure out how to work with them.
Customers who made a small purchase once and never returned. I recommend not spending a lot of time on them. You can try to return them one time. For example, to remind about yourself by talking about some promotions, special offers, sales. If after such mailings the users still do not return to you, you should calm down and let them go. Better switch to other clusters.

Adidas Store Newsletter Example
Users who made a major purchase once and disappeared. Typically, such customers are more promising than lost. You can make more efforts to interest and return them. First of all, it can be:
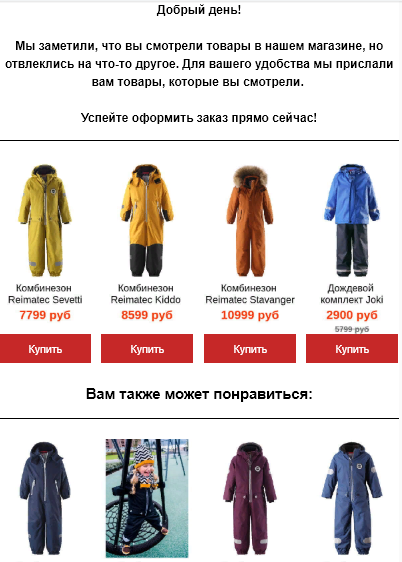
Reima Store Selling Example
In addition, you can attract and interest such an audience by sending out useful content. It would be great to contact the client and find out why they stopped buying from you. What happened to encourage them to continue buying from you.
For this group, the same events are suitable as for the previous client cluster. In addition to the above, you can offer them some more long-term motivation, for example, loyalty programs. Do not hesitate in praising your store, product, service, communications, showing how they are better than others.

Rookee Service Mailing Example
This is an interesting cluster of customers who remember about you, but for some reason have stopped buying. What will help wake them up? First of all, these are:

MIF Publishing House Example
There is a possibility that this group of clients will be interested in some kind of educational content, reference information. It is important that the first impression is good, that these users switch to loyal. You can share an article, review, guide with them. Congratulate them on your purchase, thank you for choosing your company, invite them to groups on social networks, to events where you can talk to them in detail and explain why your product suits them.

Rookee Service Mailing Example
Prospective - those who bought large amounts, potential VIP-customers. You need to try to keep their interest. For example, you can use a survey to find out if they are satisfied with the services, what they are interested in, what their needs are. It is not worth offering discounts to this group of customers, they are already loyal and buying.
It is very important to show that you value them, you love them! You can be a little flattered by some interesting comments, such as Yandex.Music, for example, that you can envy the user's musical taste. I would not recommend bothering the client with any unnecessary links, newsletters, SMS and calls. They are with you, they love you, and you should not bother you again. When they need to, they themselves will seek help.
Over time, the performance of RFM analysis changes, and customers move from one segment to another. The frequency of updating the data depends on how mobile your base is: what is the life cycle of the customer, the natural period of the purchase, and also the period during which the customer has time to make a repeat purchase. For a large successful online store - no more than once a month. If orders rarely occur, it is enough to revise the segments once a quarter or half a year.
RFM analysis is a simple but effective method. It takes only 15-20 minutes to figure it out, do database segmentation and start working with clients at a new level. You can further develop and work with specialized services. At Rookee, we use Power BI, which allows us to ship users ’email addresses, the number of paid orders, the amount of orders, and the dates when they were made online. This allows you to avoid updating the table in manual mode, segmentation is always relevant. Useful for those who work with a large amount of data. However, even starting with a regular spreadsheet in Excel, you take a huge step towards increasing the life of the client, and therefore increase the company's profits.
Segmentation and targeting - alpha and omega marketing. You can disagree with this statement and shoot endlessly at the sparrows from the cannon. It is wiser and more efficient to analyze user behavior, break the audience into segments and offer each group a personalized solution. Let's look at a specific technique and learn how to apply RFM analysis to segment the customer base.
So, RFM is a customer analysis based on three indicators: prescription, frequency and value of purchases. During this analysis, the data is segmented in accordance with the following indicators:
- Prescription - shows how long a user bought something from your site.
- Frequency - how often the user buys something on the site.
- The total value of purchases is the profit that the customer brings to you.
According to these indicators, the customer base is segmented, and then individual communication can be conducted with each of these groups. This approach leads to an increase in the total number of purchases, as customers return.
Who needs RFM analysis and why?
First of all, it is necessary for B2C companies with a client base of more than 10,000 contacts. This is a conditional restriction, the base may be smaller, in this case the number of clusters into which the audience is divided will simply be reduced. In B2B companies, RFM analysis is not very popular, but it can also be used by marketers and business owners.

RFM analysis provides a ready-made scheme that allows you to apply an individual approach to each group of customers. You group customers and predict their behavior based on past actions. For example, those who buy often and a lot receive special offers, and those who have not bought anything for a long time, receive a bonus or discount + targeting to remind themselves of themselves.

Most often, the results of RFM analysis are used in working with email newsletters. It is also useful when preparing telephone call scripts (according to the script, the manager can process a client from a certain cluster) and, in principle, for any narrowly targeted marketing campaigns: for example, retargeting or remarketing.
How to conduct an RFM analysis?
The entire RFM analysis is divided into a three-point system: prescription, frequency and amount of purchases. In turn, the prescription of the order is divided into long-standing, "sleeping" and recent orders. Frequency purchases are divided into one-time, rare and frequent. The amount of purchases is divided into low, medium and high point.

We compare these parameters and get the segments of the site users. There can be up to 27.

In practice, there may be fewer. The number of segments depends on the customer base, how diverse it is, how different the user groups are.

Manual analysis is laborious, it is better to use Excel pivot tables. I will teach you how to quickly and easily do RFM analysis in Excel in 5-7 minutes.
RFM Analysis Algorithm
First you need to unload from CRM or another database:
- Unique customer data (this can be mail, phone number, what identifies the client);
- customer purchase dates;
- customer purchases

These three parameters are enough to make a simple, quick and, most importantly, free RFM analysis. Next, let's create and configure a pivot table. Using pivot tables (click on Insert - Pivot Table), we transfer all three of these parameters to a new screen.

There are three fields in the fields of the Pivot Table - email, Purchase Date and Purchase Amount - they must be divided into Rows and Values. In Strings, we place one single indicator, in this case, these are email addresses (this can be phone numbers, any contacts). It is important to note that the emails in this column are already unique, they are not duplicated.

In the value Next, we consider for each user indicators such as: the number of purchases and the sum of all purchases. An important parameter is the Maximum purchase date field. This displays the date of the user's last purchase. It is needed to calculate how long the user has bought something, this calculation will determine the customers in a particular cluster.

Here is a simple pivot table in almost three clicks. All that is needed for the calculation is to place it in separate fields:
- user's unique email (just copy from the previous summary table);
- unique customer purchases
- amount of purchases;
- date of last purchase.
- Further, according to the formula, which is already Exel, RFM indicators are calculated.

Now we have a pivot table with RFM calculation. Depending on how much, how often and how much the customer made purchases, the formula calculates and assigns from 1 to 3 values to each client. Next, we define an RFM cluster - a formula by which these three numbers are combined, we get a segment or group to which these or other users belong.

This data is collected in an RFM cluster. This is how all these clusters look.

Now you can select a segment (for example, customers who bought only a very long time ago) and already purposefully work with this database. Segments can be uneven, that is, one includes 74 people, the other only 1, and the segments themselves 27. Sometimes it happens that there is only one user in a separate cluster. In such cases, it is better to attach it to the nearest large cluster, where customers with similar characteristics.
A complete guide to creating RFM analysis and technical guidance can be found in our webinar “How to Turn Traffic into Sales Using Site User Data”:
After we learned how to divide clients into clusters, let's figure out how to work with them.
Lost customers
Customers who made a small purchase once and never returned. I recommend not spending a lot of time on them. You can try to return them one time. For example, to remind about yourself by talking about some promotions, special offers, sales. If after such mailings the users still do not return to you, you should calm down and let them go. Better switch to other clusters.

Adidas Store Newsletter Example
Endangered Users
Users who made a major purchase once and disappeared. Typically, such customers are more promising than lost. You can make more efforts to interest and return them. First of all, it can be:
- good discounts;
- purchase coupons;
- sales information;
- personal selection depending on what they have already bought from you;
- an offer with similar products, similar or related.

Reima Store Selling Example
In addition, you can attract and interest such an audience by sending out useful content. It would be great to contact the client and find out why they stopped buying from you. What happened to encourage them to continue buying from you.
Former loyal customers
For this group, the same events are suitable as for the previous client cluster. In addition to the above, you can offer them some more long-term motivation, for example, loyalty programs. Do not hesitate in praising your store, product, service, communications, showing how they are better than others.

Rookee Service Mailing Example
Sleeping Clients
This is an interesting cluster of customers who remember about you, but for some reason have stopped buying. What will help wake them up? First of all, these are:
- profitable promotions and offers;
- collections for a thematic holiday;
- gifts and bonuses for the birthday of the client.

MIF Publishing House Example
Beginners with a low and medium bill
There is a possibility that this group of clients will be interested in some kind of educational content, reference information. It is important that the first impression is good, that these users switch to loyal. You can share an article, review, guide with them. Congratulate them on your purchase, thank you for choosing your company, invite them to groups on social networks, to events where you can talk to them in detail and explain why your product suits them.

Rookee Service Mailing Example
Prospective customers
Prospective - those who bought large amounts, potential VIP-customers. You need to try to keep their interest. For example, you can use a survey to find out if they are satisfied with the services, what they are interested in, what their needs are. It is not worth offering discounts to this group of customers, they are already loyal and buying.
Ideal customers
It is very important to show that you value them, you love them! You can be a little flattered by some interesting comments, such as Yandex.Music, for example, that you can envy the user's musical taste. I would not recommend bothering the client with any unnecessary links, newsletters, SMS and calls. They are with you, they love you, and you should not bother you again. When they need to, they themselves will seek help.
Over time, the performance of RFM analysis changes, and customers move from one segment to another. The frequency of updating the data depends on how mobile your base is: what is the life cycle of the customer, the natural period of the purchase, and also the period during which the customer has time to make a repeat purchase. For a large successful online store - no more than once a month. If orders rarely occur, it is enough to revise the segments once a quarter or half a year.
RFM analysis is a simple but effective method. It takes only 15-20 minutes to figure it out, do database segmentation and start working with clients at a new level. You can further develop and work with specialized services. At Rookee, we use Power BI, which allows us to ship users ’email addresses, the number of paid orders, the amount of orders, and the dates when they were made online. This allows you to avoid updating the table in manual mode, segmentation is always relevant. Useful for those who work with a large amount of data. However, even starting with a regular spreadsheet in Excel, you take a huge step towards increasing the life of the client, and therefore increase the company's profits.
All Articles