Infrastructure A / B experiments in the big Search. Yandex Report
A / B testing is a powerful way to test interfaces before publishing to an entire audience. I decided to tell what this tool consists of, what logging features it has, how metrics are compiled, and what is the essence of the experiments in the frontend. Let's talk about their device and services for solving daily analytical tasks. We will discuss several development paths for a developer who seems to be already able to do everything, but wants more.
- My name is Lesha, I work in Search and develop the most important, probably Yandex product - search results.
All of you, one way or another, have ever used any of the searches. A couple of terms. The issue consists of various blocks. There are simple organic documents that we collect from all over the Internet and somehow know how to present, and there are special blocks that we display as special markup. We know a lot of data about their contents. These blocks are called sorcerers. Specific terminology adopted by Yandex and not only.
Today I want to tell you how we conduct experiments, what nuances, tools, and what wonderful inventions are in our zashniks in this area of our activity.
What should I start with? Why do Yandex need A / B experiments?
I would like to start with the lyrics. Not so long ago, with my daughter, I watched one short scientific film “4.5 billion years in 40 minutes. History of the Earth. " There are quite a number of A / B experiments. Including these. I tried to make one of the most interesting and fun on this slide. This is when evolution has several branches. For example, there are two families: marsupials and placental. And as we now see, placental somehow win. This is why they win.

This is already the human brain conceived. In the prenatal and further development of marsupials, the skull box hardens quickly and prevents the brain from developing. And in the placental, everything progresses, everything is soft until the brain becomes folds with grooves, the surface grows, making the neocortex steep. As a result, the placental will win in evolution. What's the point of this? Nature has evolution, and its driving forces are mutation and natural selection, as you probably know.


The company has an analogy of nature’s A / B experiments: any business wants to develop stably and invests certain efforts, using A / B experiments as a way to mutate something, change something. The company uses all the mathematical power of analytics to select these very experiments.
A / B experiments and the whole evolution are aimed at achieving goals, being able to observe oneself from the outside, comparing with competitors, and looking for certain new niches, hypotheses. For developers in general, especially for front-end vendors, it is important to test new features on a small fraction of the production.

A short story looks something like this. We can say that 2010, when our product managers did the first A / B experiments, is such a post-period after the Big Bang. Certain star clusters have just begun to arise, an understanding of how to conduct A / B experiments, what to look at, how to log. The first bumps, the first mistakes were accumulated.
During this period from 2010 to 2019, we achieved significant results. Today, all these terms regarding logs, experiments, metrics, goals, achievements and so on are already basic for us, in particular for newcomers to new developers. This is our slang, our internal Yandex mentality.
We pass directly to the meat, about the great Search. The Big Search in its structure looks something like this.
We have a browser, a balancer, a lot of data centers and a huge rich infrastructure under the hood. The diagram demonstrates that the device is complex, there are many components. And what is most surprising, all these components are able to conduct A / B experiments and, of course, write and analyze logs.

Logs are written by many, many components. Of course, it’s more interesting for us to talk in the context of the frontend. The frontend logs two large significant slices. These are purely technical logs related to the direct measurement of some time, performance on client devices. Real user measurement, RUM metrics. Here are the times before the first byte, before the first rendering, before loading all the DOM content and before interactivity.
Along with this, there are logs written by both server and client typesetting. These are grocery logs. In our realities, even here there is a term “baobab”. Why baobab? Because the tree is a component tree, a feature tree in which one of the main logs is the logs of impressions, clicks and other technical events that we register for subsequent analysis.

This slide shows a tool for storing logs inside Yandex and for distributed computing. We have it called Yandex Tables, YT . Everything developed in Yandex has the letter Y. I tried to recall the analogue of this tool in the outside world. In my opinion, Facebook has a MapReduce tool called Hadoop. It allows you to implement storage and calculation.
The slide shows statistics for August 8 this year. One of the most valuable search logs, user sessions, is 54 terabytes per day in its form. This is a huge amount of information that can not be shoveled in its raw form. Therefore, one must be able to build some high-level stories.
To work with logs, in particular, all of our especially experienced developers must master some kind of analytical tool.
Inside Yandex, there is a YQL tool. This is a SQL-like query and computation language over our logs, which allows you to build all kinds of environments, do just low-level analytics, look directly at specific numbers, average percentiles, and build reports. The tool is powerful enough, it has a huge branchy API and many features. A lot of infrastructure processes are built on its basis.
In addition, among our front-end developers and, in particular, analysts, the Jupyter tool is in great demand and popularity. It is already possible with the power of Numpy tools and other tools known to you, for example Pandas, to do some transformations and high-level analytics over our logs.
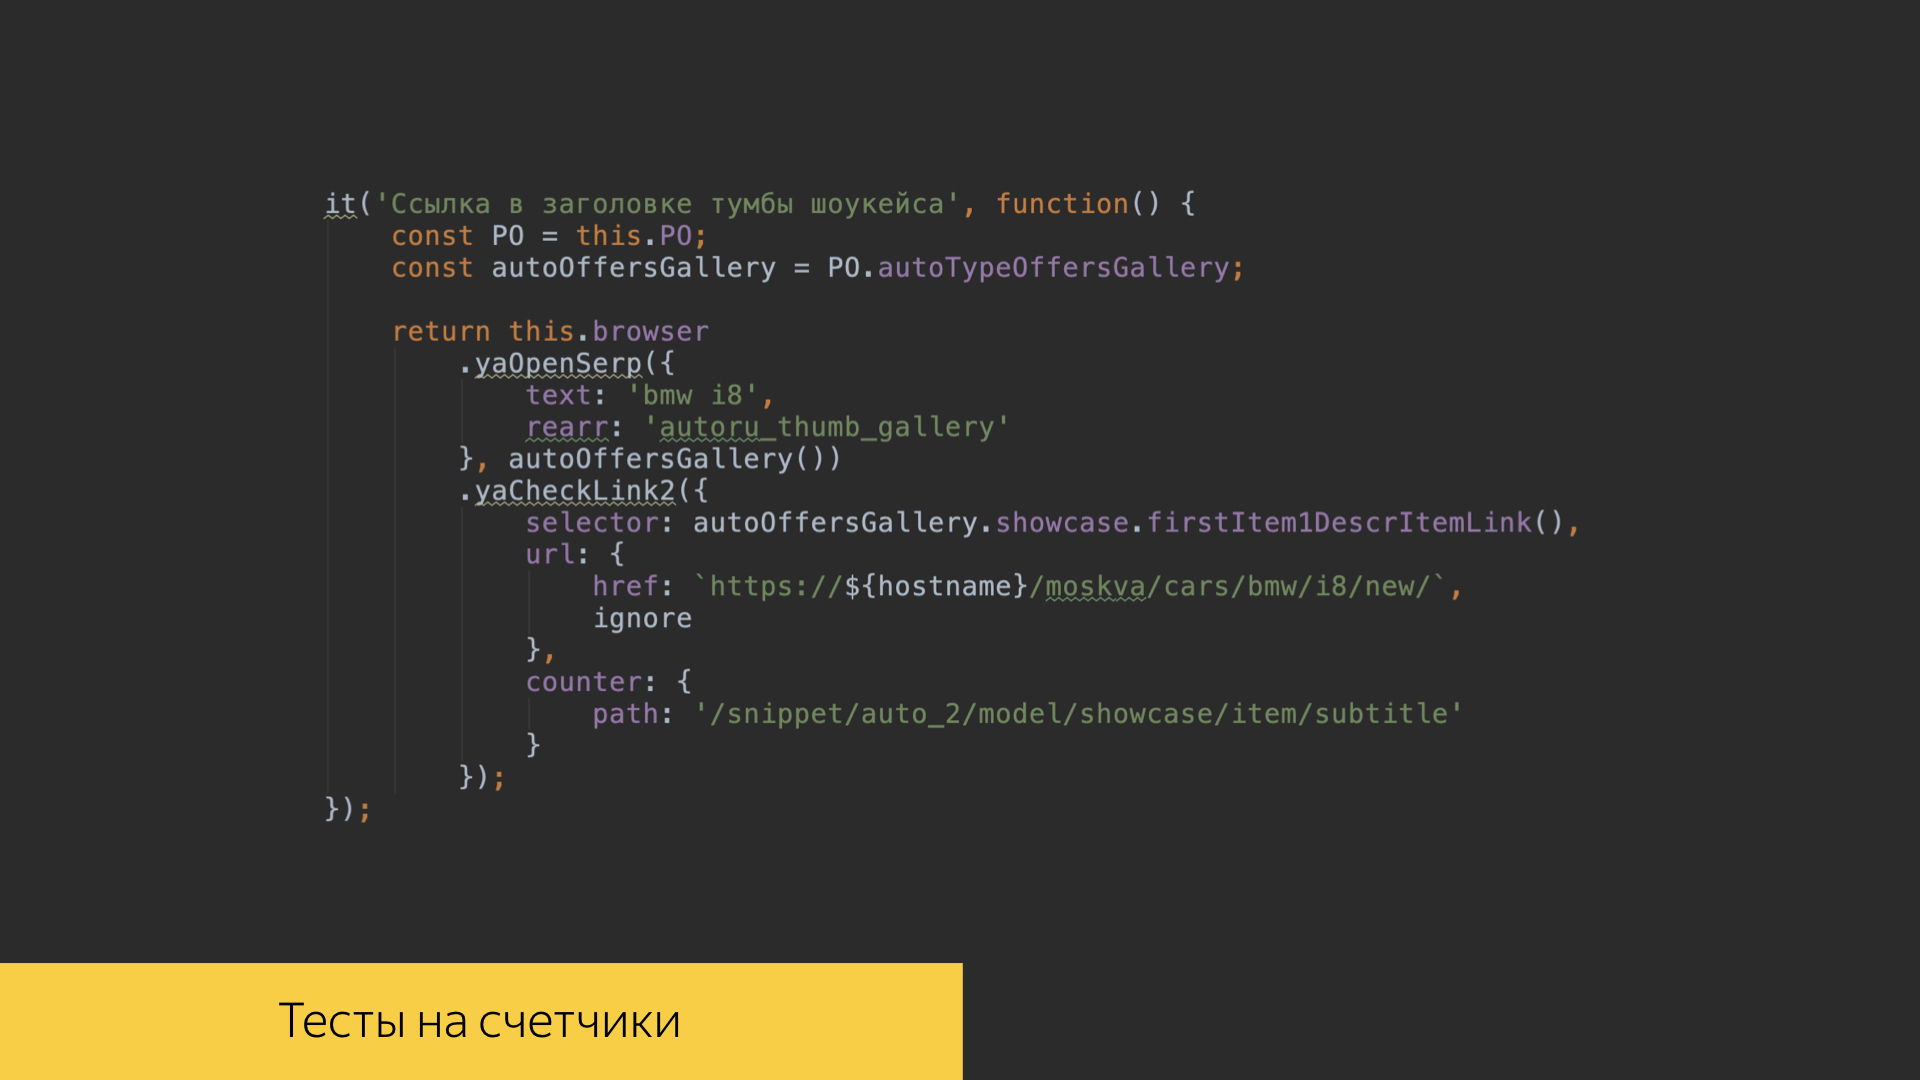
We really value the logs, literally fighting for each entry. To do this, in the repository of our search project, there are tests in the front-end code that allow us to verify that all events are correctly recorded. We write tests for each of our features, we can check a specific script, click on certain links, buttons, scroll through certain galleries in our interface and see what exactly the number of logs was recorded exactly with the values that we expect, which we recorded, for which we made some standards. And then we’ll go into these reference values.
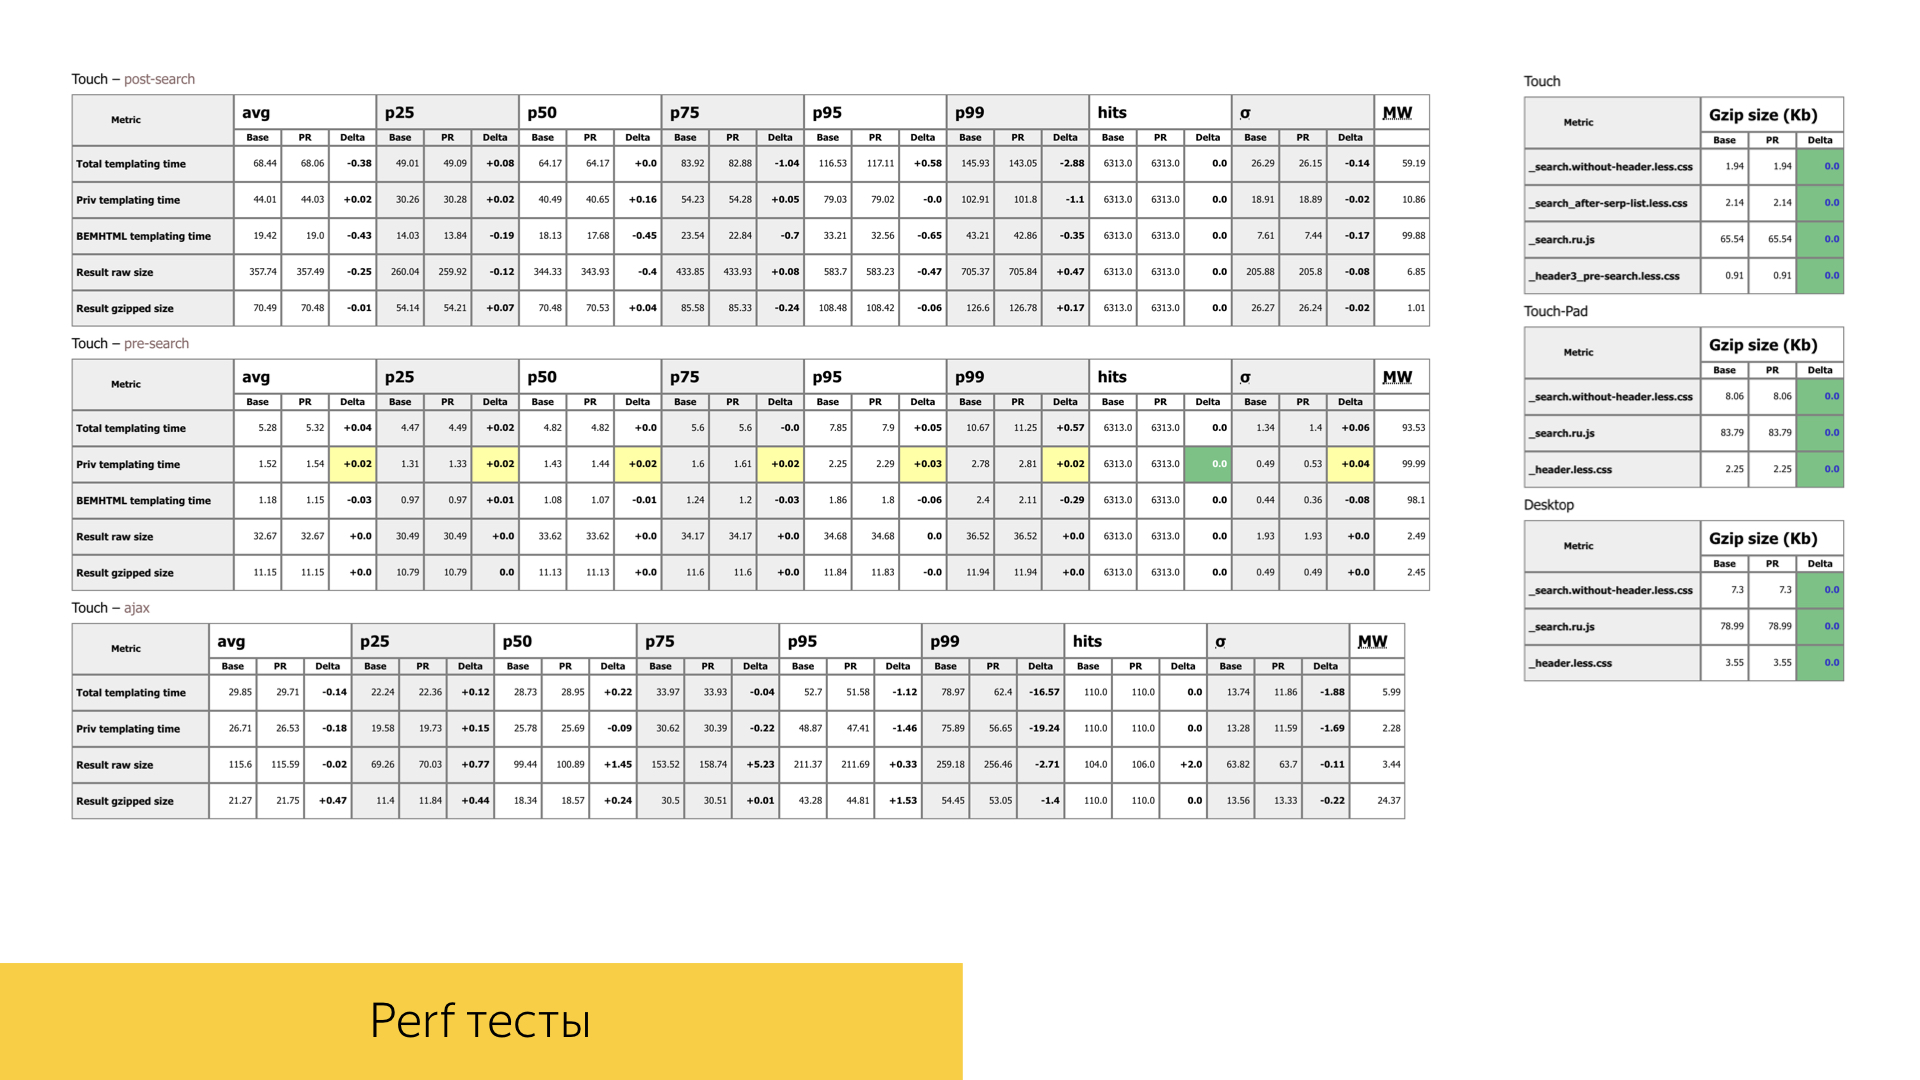
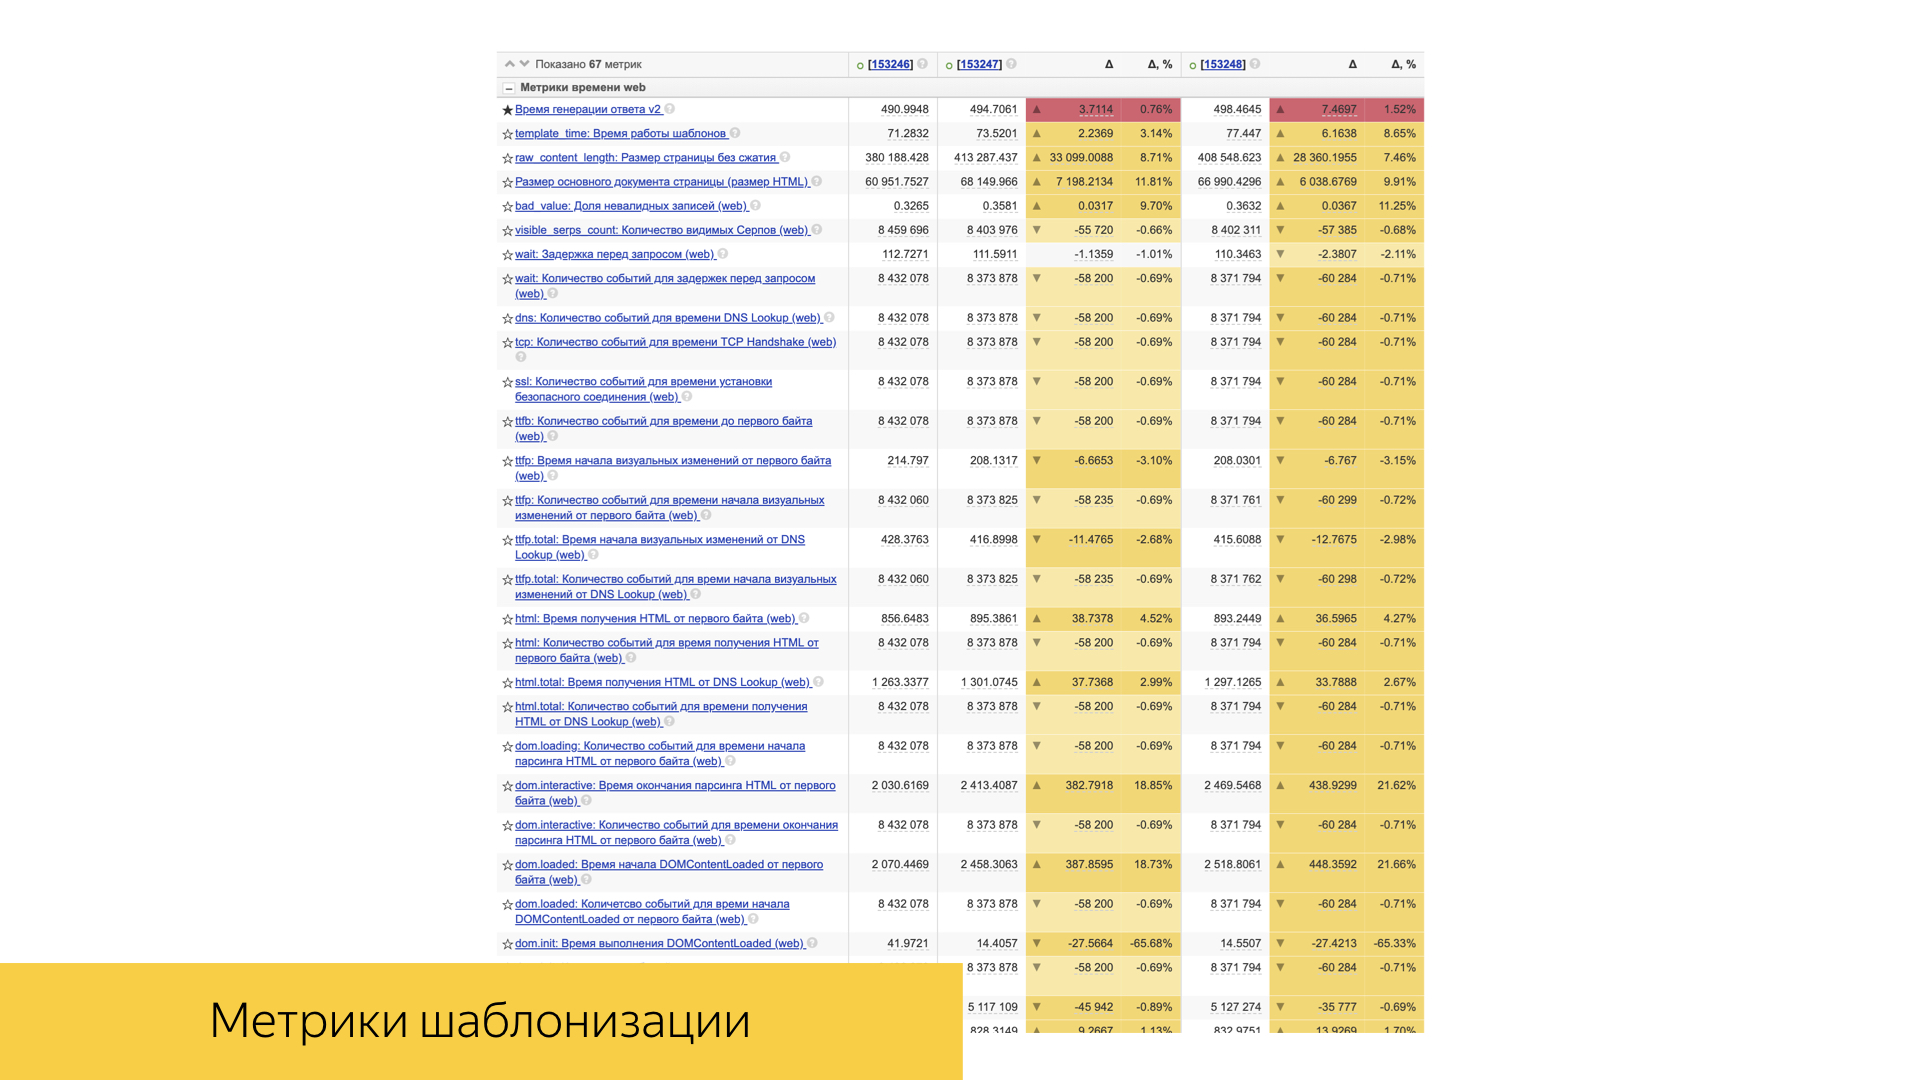
We also pay great attention to the performance of our interfaces. In any pool request with new functionality or refactoring of existing functionality, we pay great attention to the times, volumes, number of calls of certain functions. On the slide is one of the reports of a completely random pool request. We have two stages of search, one is ajax type: first we load the header on the page with the search arrow, and when all the search sources work out, we can measure exactly the times of template and all the performance already when rendering the main part of the output.
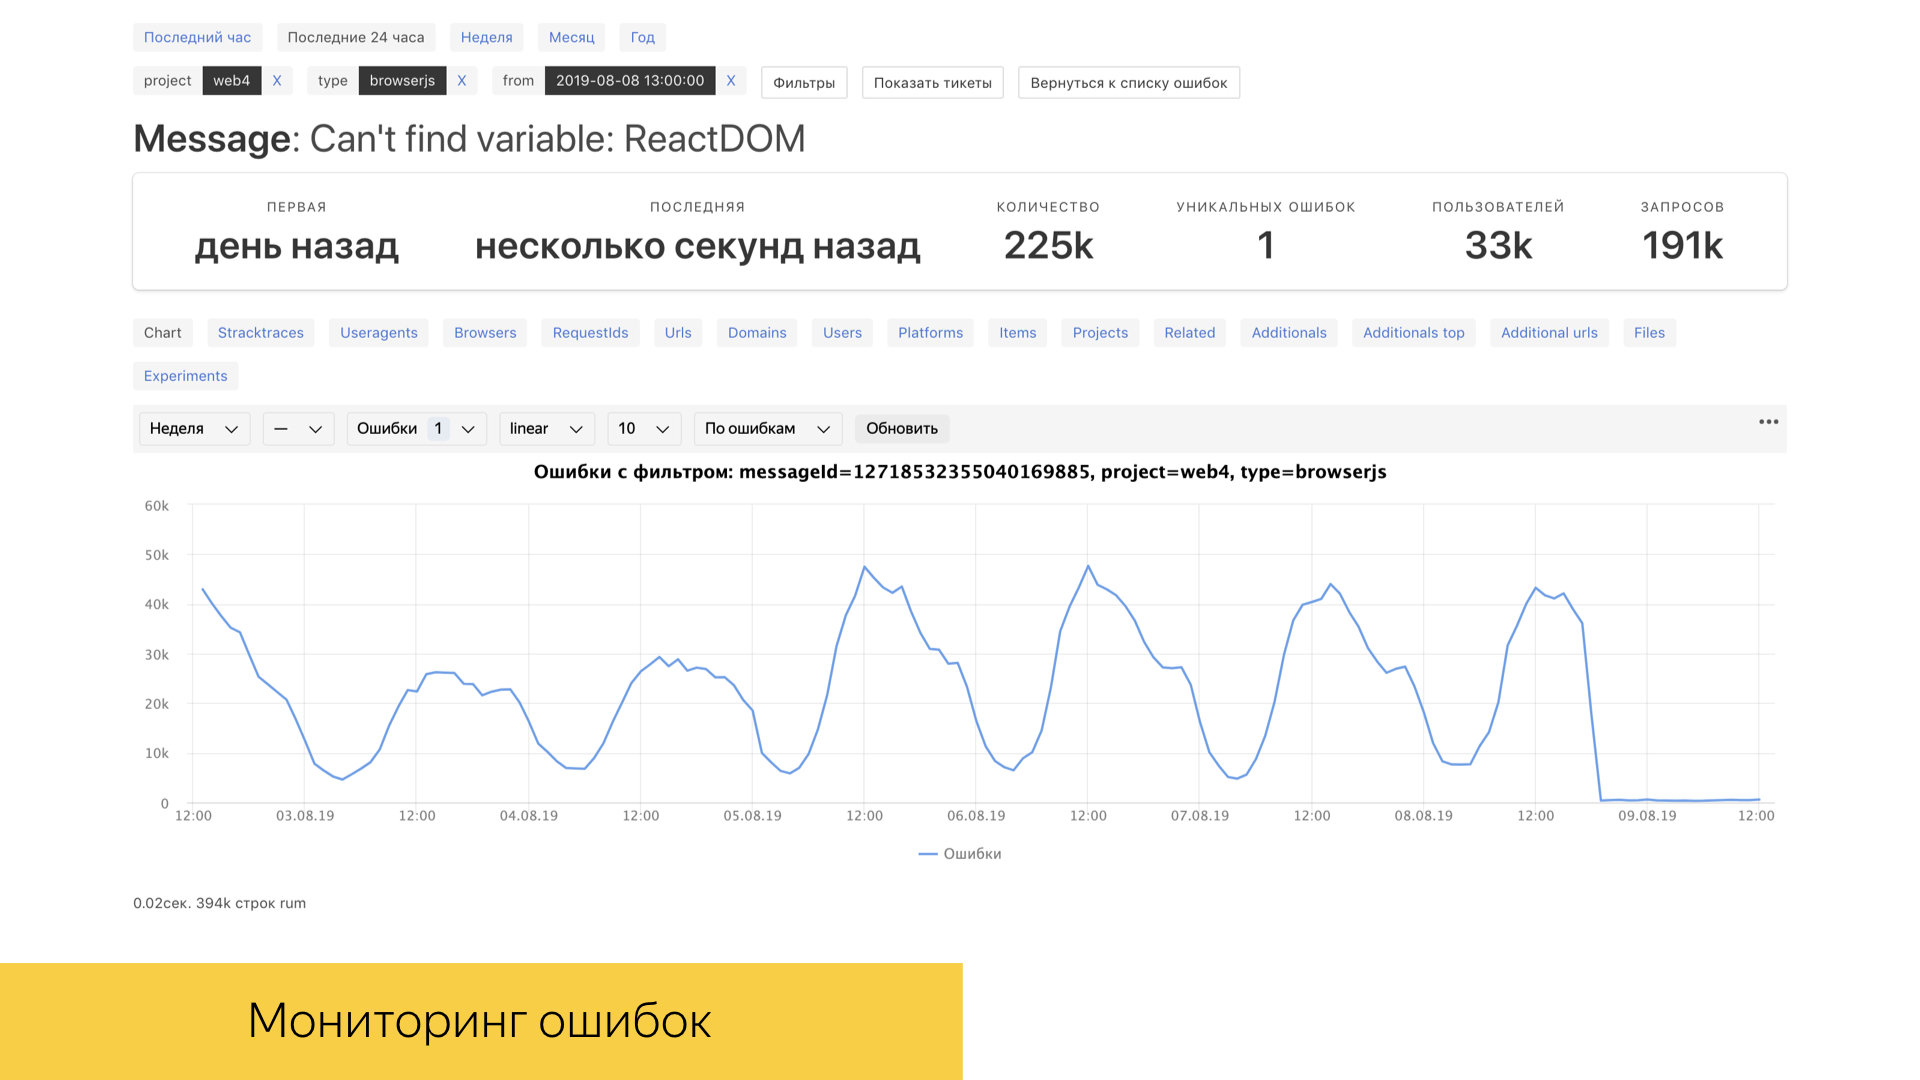
For us, as, of course, and for any other subject in IT, errors in production and in special environments are very important. We have a tool called error booster, which allows you to look at real errors in production in real time with a fairly good time frame. Under the hood, this tool uses the ClickHouse database, in which queries are processed quite quickly, and the database itself is designed for analytical work. Most interactions are implemented specifically with ClickHouse.
We talked about the logs, about their varieties. There are a lot of them. In order to move experiments and analyze something, to make decisions on something, we have a large number of metrics. These are some convolutions over large volumes of raw data.
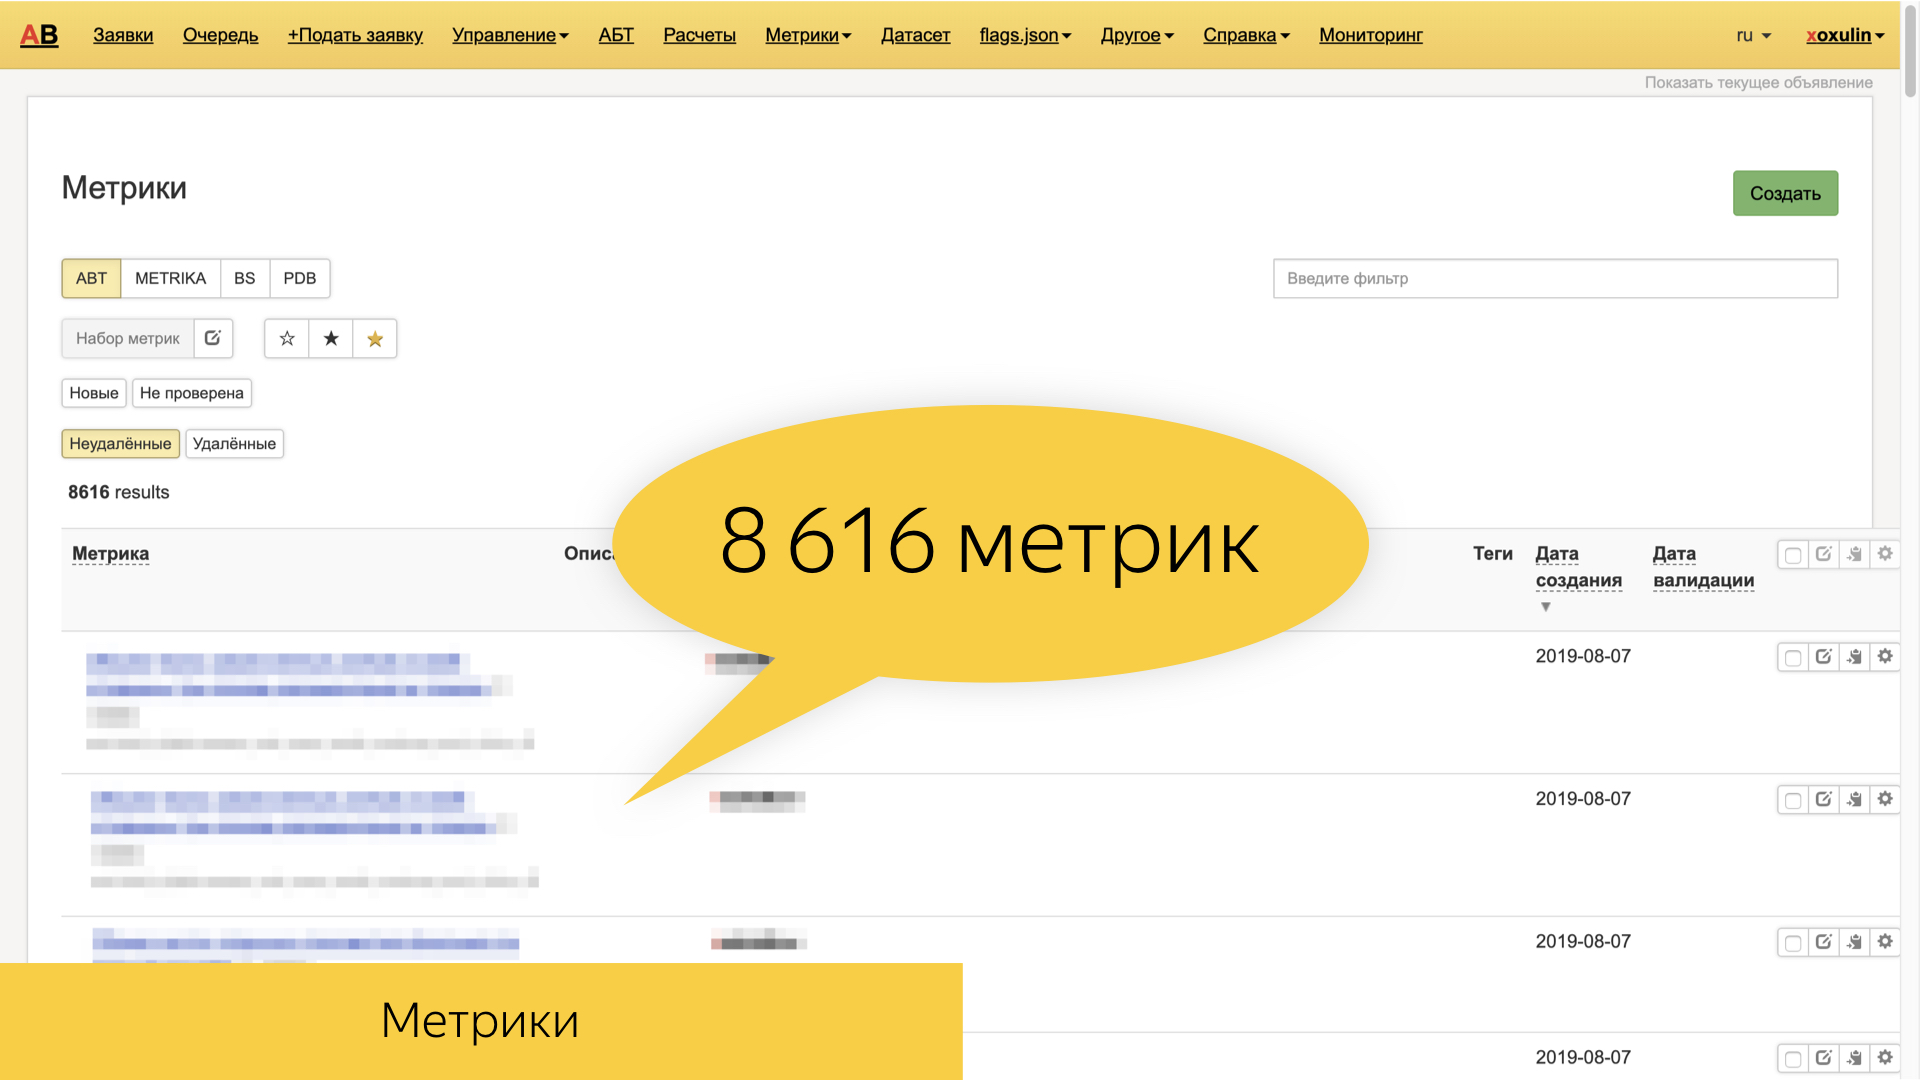
Yandex now has about 8.6 thousand of various metrics that are based on the same raw logs - and higher-level ones, such as search and user sessions. They are very diverse, and often precisely feature-oriented. That is, these are metrics specific to a particular sorcerer, a specific block, a slice of requests, the type of documents that we display.
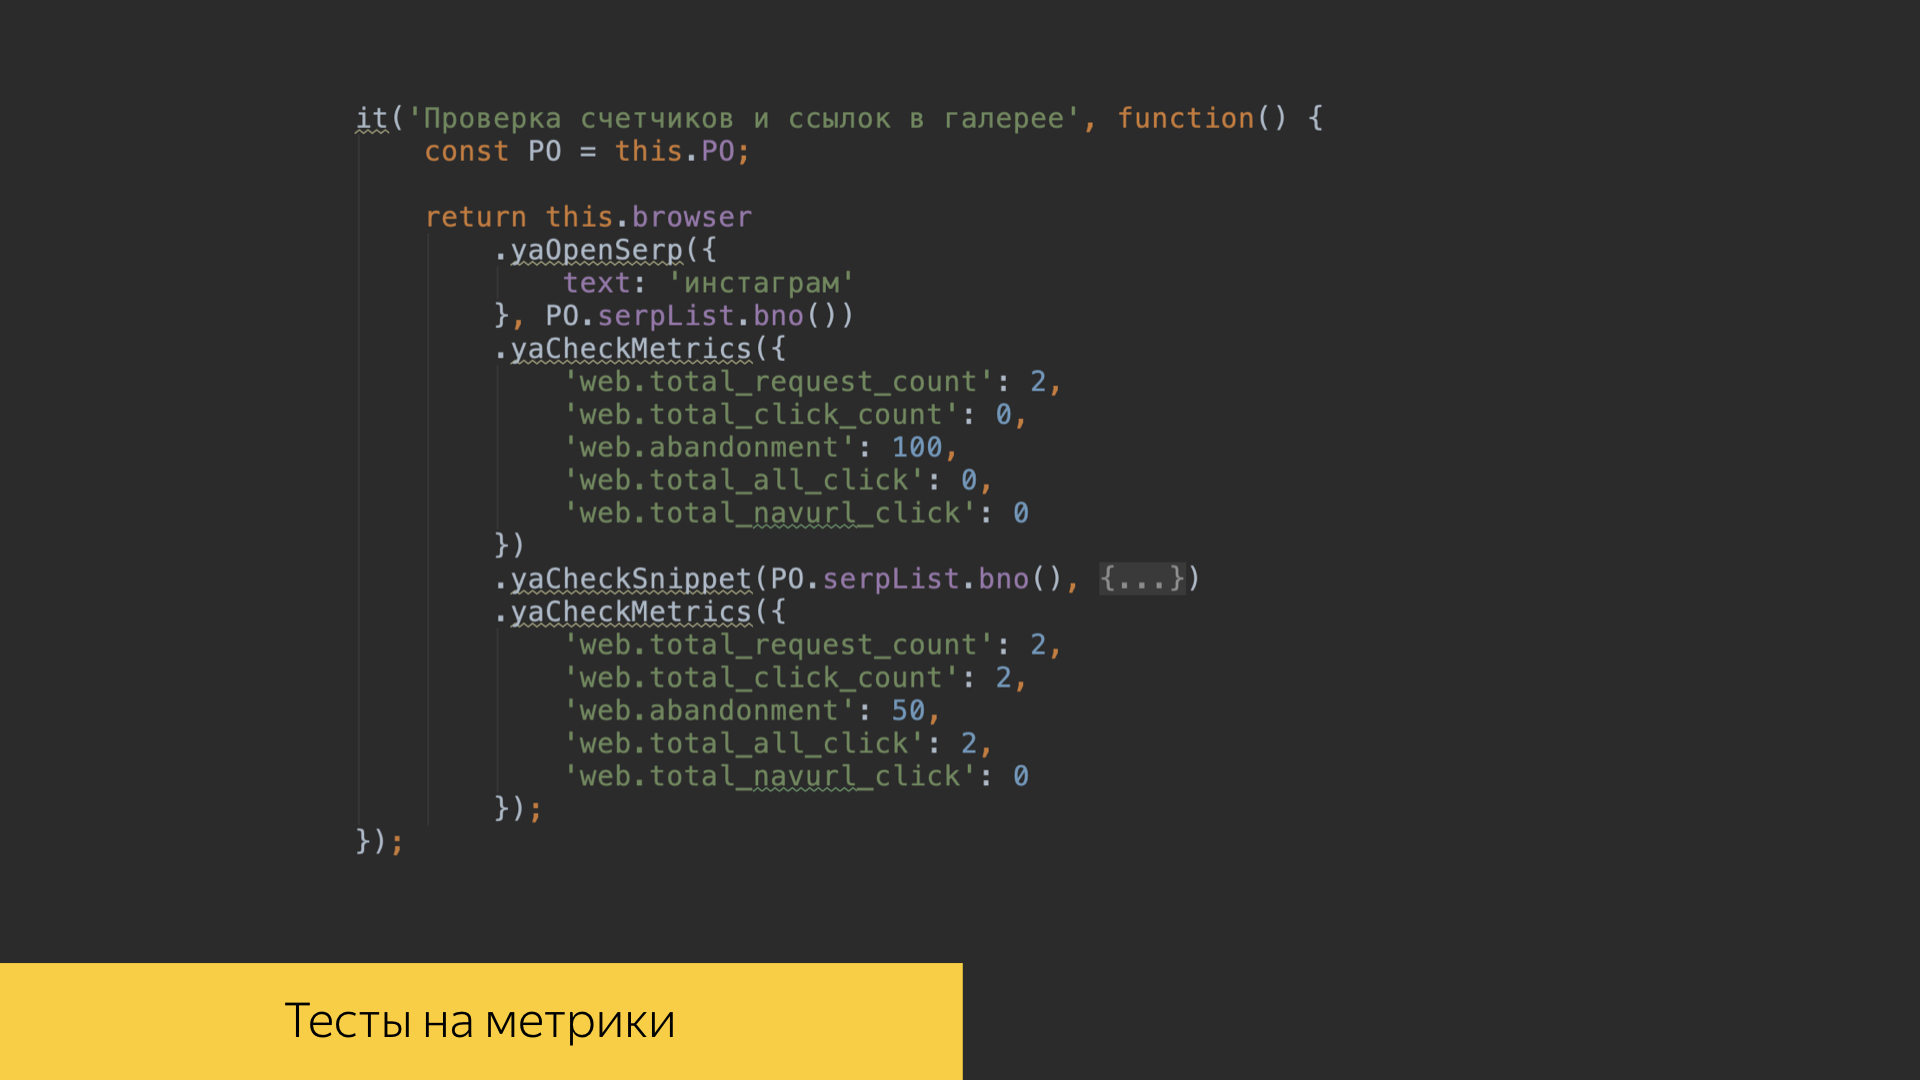
In our test scenarios, it is possible to check the value of metrics in our own interfaces. When we lost certain scenarios, we can look at the results of calculations over the logs and sourcing certain metric values.
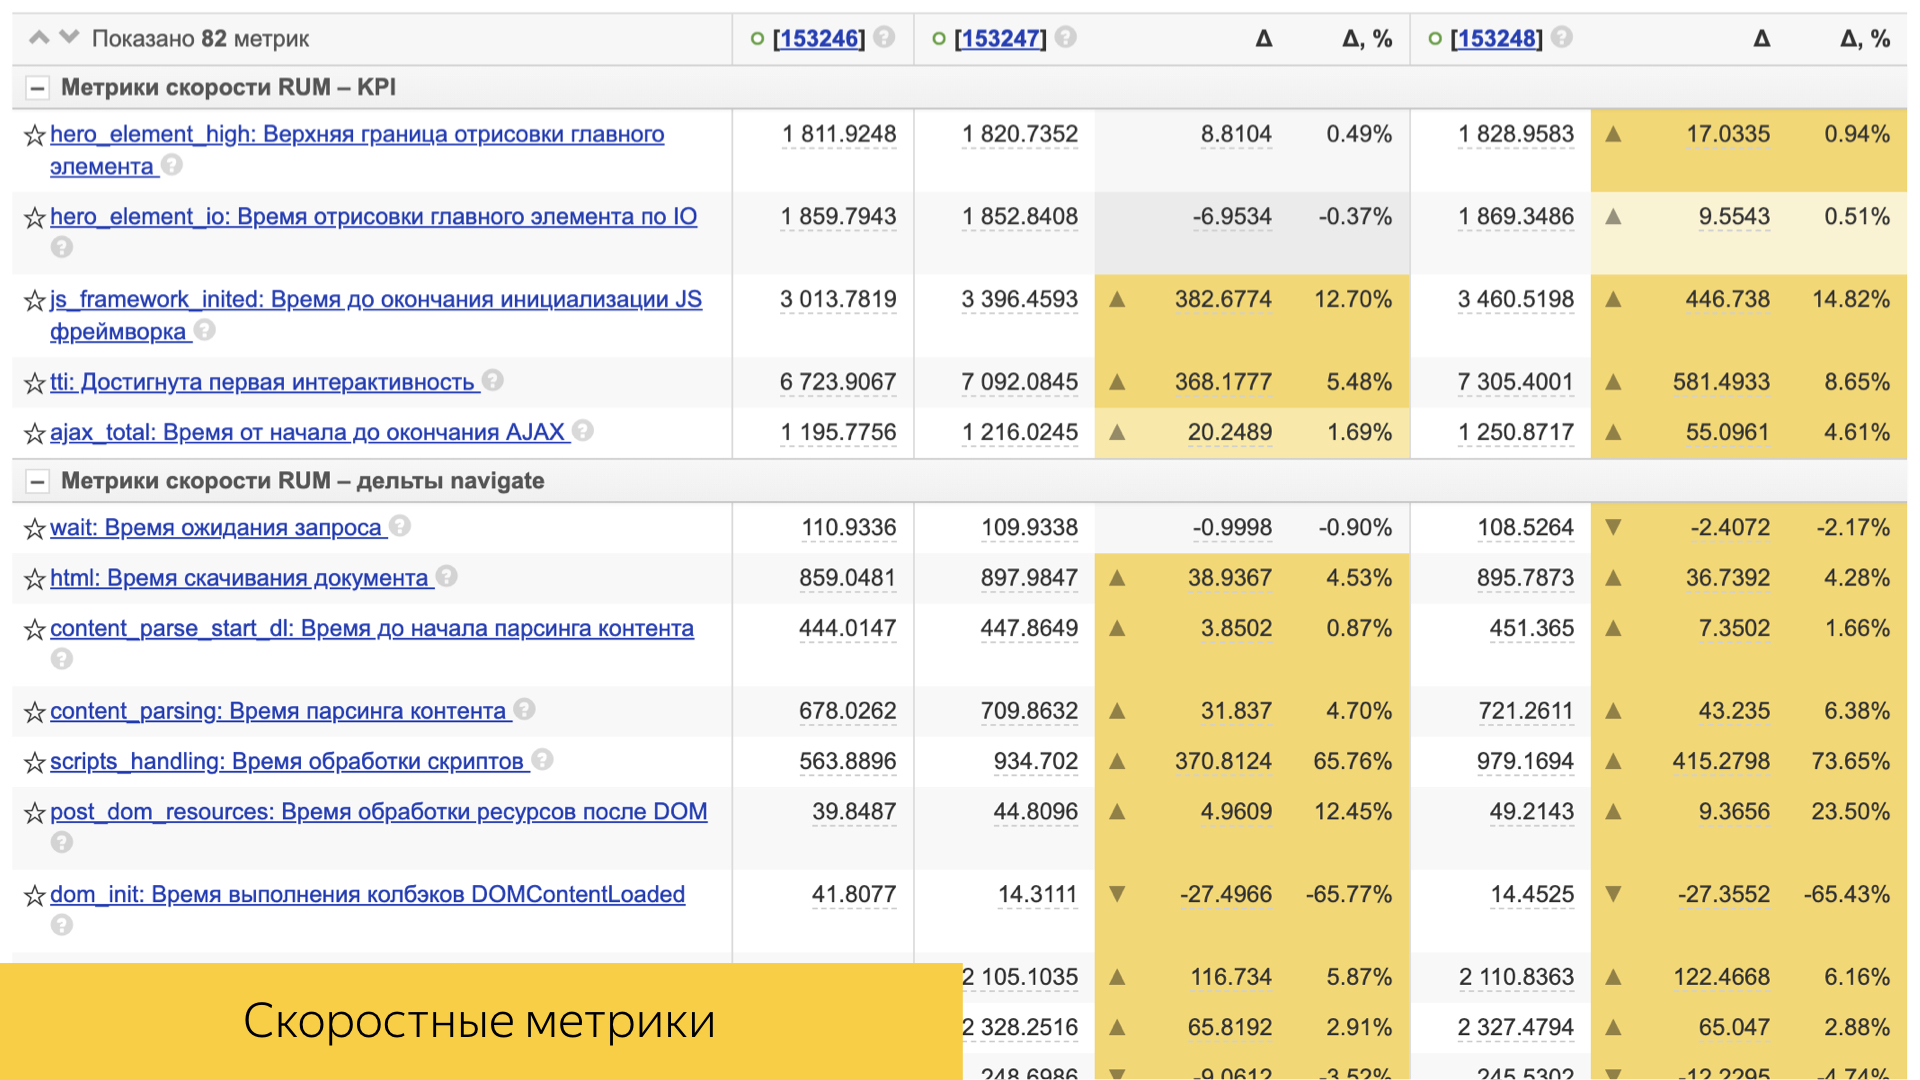
An important role is played by speed metrics. All of them are simple enough arranged. This is usually either some kind of percentile, or the average value and its deviation and statistical significance.
There are a lot of them, they take into account both the time of standardization and the time of delivery of content to the user's device.
Direct client performance is also taken into account: rendering time, interactivity time, and others.

So how do we conduct experiments? For example, there are two users who suddenly decided to use Yandex search. We agreed with each other - we go today, for example, to Starbucks, and are looking for him using our search. Their requests, falling into the infrastructure of our search sources, are marked with certain markers. By markers, these users fall into various experiment baskets. In each of the baskets there is a certain set of flags that activate experiments in each of the search sources. For example, these two users went to search results and used search hints. The first introduces “Starbucks”, sees some verbal clues in the form of words. When he ends up with a search, he sees a block about this organization, says - yes, I found it, I’m going there. And the second user discovers a navigation hint already in the interface of search hints, quickly switches to the organization and receives a response faster.
For all this variety of changes, differences in the interface, in a certain functionality, the BEM tool is responsible. This is not just a framework, but a whole methodology for the declaration of visual components, their modifications. Even here in the background are the very DNA chromosomes that seem to mutate through bem. In fact, bem is Yandex DNA, the DNA of experiments in the front end.
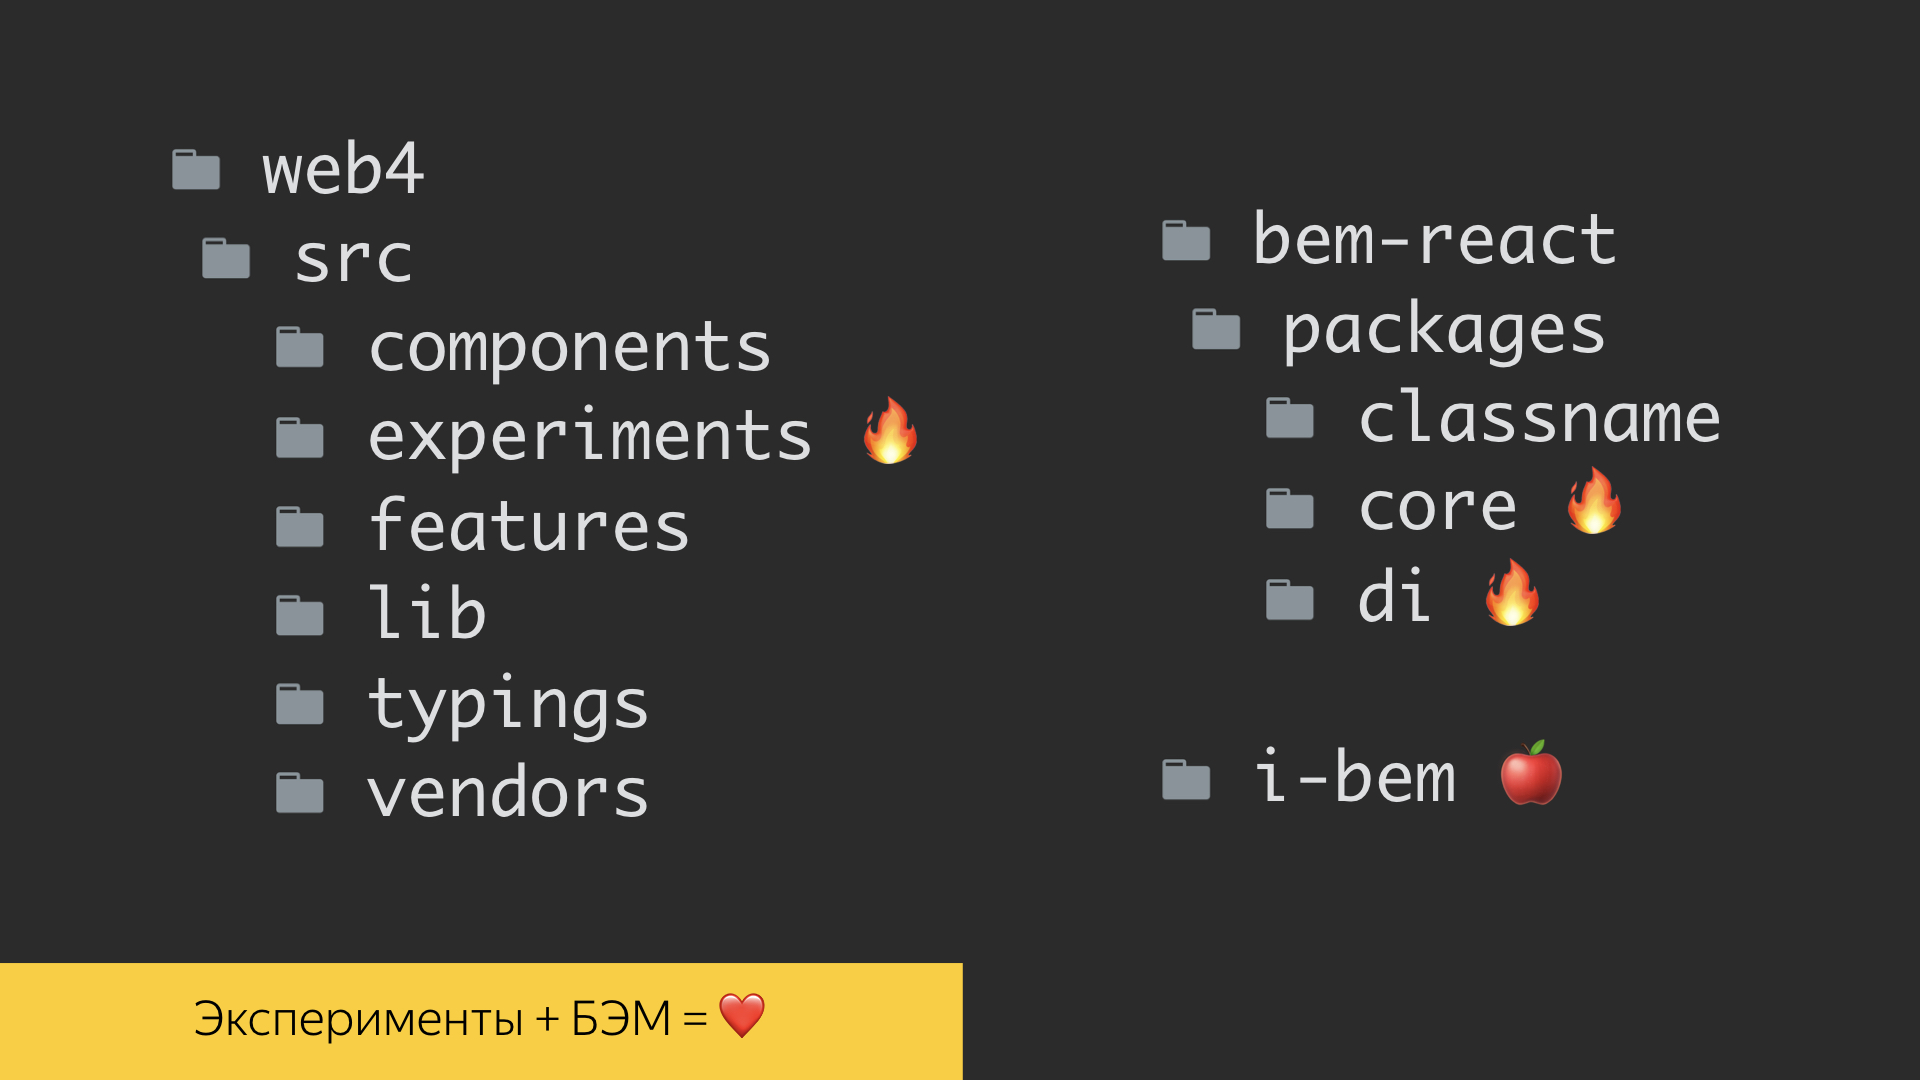
There are several implementations in the methodology. One of them is on an already established i-bem stack, which is somewhere under the hood connected to jQuery. This is already quite mature technology. On such a stack, we can solve a lot of problems. Today, bem-react technology, which is already implemented on the React framework and TypeScript language, is gaining great boost and development. All these tools allow you to build experiments and preach the main idea - the ability to declare both visual components and their modifications. We have a whole separate level in the repository with declarations of those very experiments. But around 2015, they realized that it was economically unprofitable to smear our experimental flags throughout the frontend code. The fact is that units of experiments reach real production, and everything that is not used is very difficult to cut from the code later. Therefore, we evicted them to a separate level of definition. And here again thanks to the bem-methodology, which gave us the opportunity to use redefinition levels. We declare our experiments on them.

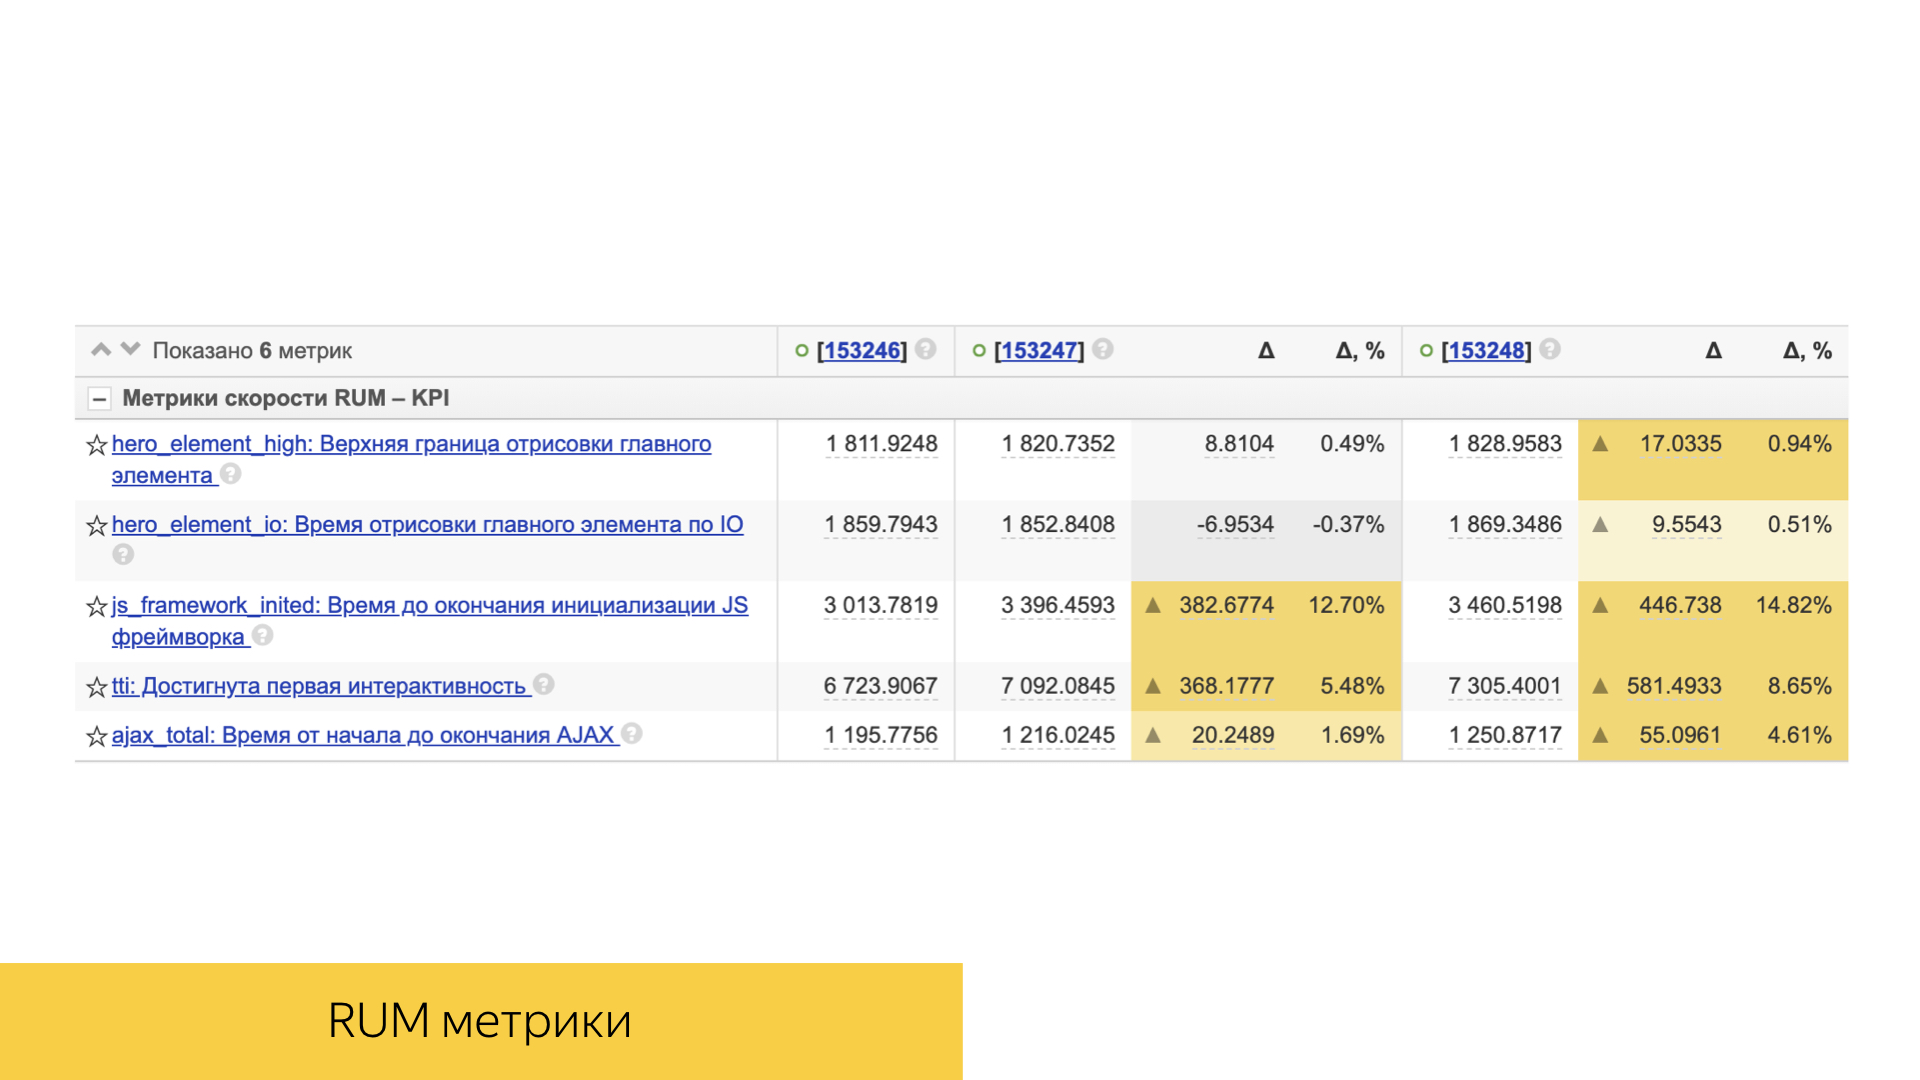
This is one of the reports of experiments. Two columns: control and experiment. Before you is not even everything that is in the report. Why is he so long? First of all, you saw how many metrics we have - 8.6 thousand.

But the main role is actually played only by the metrics that differ. And we are able to conduct our experiments at the same time, that is, on one user we can simultaneously have about 20 experiments. They do not conflict with each other and at the same time in all our experiments only their purely product metrics are stained, without affecting each other. Now there are about 800 experiments in production: not only search engines, but also from so many services. The tool is called AB, which is not surprising. Services start experiments in it, declare certain samples, and then look at the differences between metrics, which after some period begin to differ in experiment and control.
As a consequence of this diversity in the work of front-end developers, there are even roles among them. There are experts on experiments, and for this we officially give achievements in the framework of the Yandex internal network, people really pass exams. They analyze experiments, validate their results about experts and get a passport that says: “I’m an analyst, I can analyze experiments.” And in general, all work with experiments, with our metrics, is focused primarily on improving the product itself. I am one of the representatives, I am very motivated to develop a product, not just code and not technology. And it really drives me when I come to a team and make a product.

What is the bottom line? We have a large number of logs written daily to our storage systems. There are a large number of metrics that we calculate, we conduct experiments on them. Very large infrastructure. The top modern tool that allows you to implement a huge number of tools is the bem-react package. We pay great attention to indicators of speed and quality, product stability. And in general, we are growing in our developers more and more new roles related to the main specialty - the frontend. That's all I wanted to say. Thanks for your attention.
- My name is Lesha, I work in Search and develop the most important, probably Yandex product - search results.
All of you, one way or another, have ever used any of the searches. A couple of terms. The issue consists of various blocks. There are simple organic documents that we collect from all over the Internet and somehow know how to present, and there are special blocks that we display as special markup. We know a lot of data about their contents. These blocks are called sorcerers. Specific terminology adopted by Yandex and not only.
Today I want to tell you how we conduct experiments, what nuances, tools, and what wonderful inventions are in our zashniks in this area of our activity.
What is A / B testing for?
What should I start with? Why do Yandex need A / B experiments?
I would like to start with the lyrics. Not so long ago, with my daughter, I watched one short scientific film “4.5 billion years in 40 minutes. History of the Earth. " There are quite a number of A / B experiments. Including these. I tried to make one of the most interesting and fun on this slide. This is when evolution has several branches. For example, there are two families: marsupials and placental. And as we now see, placental somehow win. This is why they win.
This is already the human brain conceived. In the prenatal and further development of marsupials, the skull box hardens quickly and prevents the brain from developing. And in the placental, everything progresses, everything is soft until the brain becomes folds with grooves, the surface grows, making the neocortex steep. As a result, the placental will win in evolution. What's the point of this? Nature has evolution, and its driving forces are mutation and natural selection, as you probably know.
The company has an analogy of nature’s A / B experiments: any business wants to develop stably and invests certain efforts, using A / B experiments as a way to mutate something, change something. The company uses all the mathematical power of analytics to select these very experiments.
A / B experiments and the whole evolution are aimed at achieving goals, being able to observe oneself from the outside, comparing with competitors, and looking for certain new niches, hypotheses. For developers in general, especially for front-end vendors, it is important to test new features on a small fraction of the production.
A short story looks something like this. We can say that 2010, when our product managers did the first A / B experiments, is such a post-period after the Big Bang. Certain star clusters have just begun to arise, an understanding of how to conduct A / B experiments, what to look at, how to log. The first bumps, the first mistakes were accumulated.
During this period from 2010 to 2019, we achieved significant results. Today, all these terms regarding logs, experiments, metrics, goals, achievements and so on are already basic for us, in particular for newcomers to new developers. This is our slang, our internal Yandex mentality.
Big Search
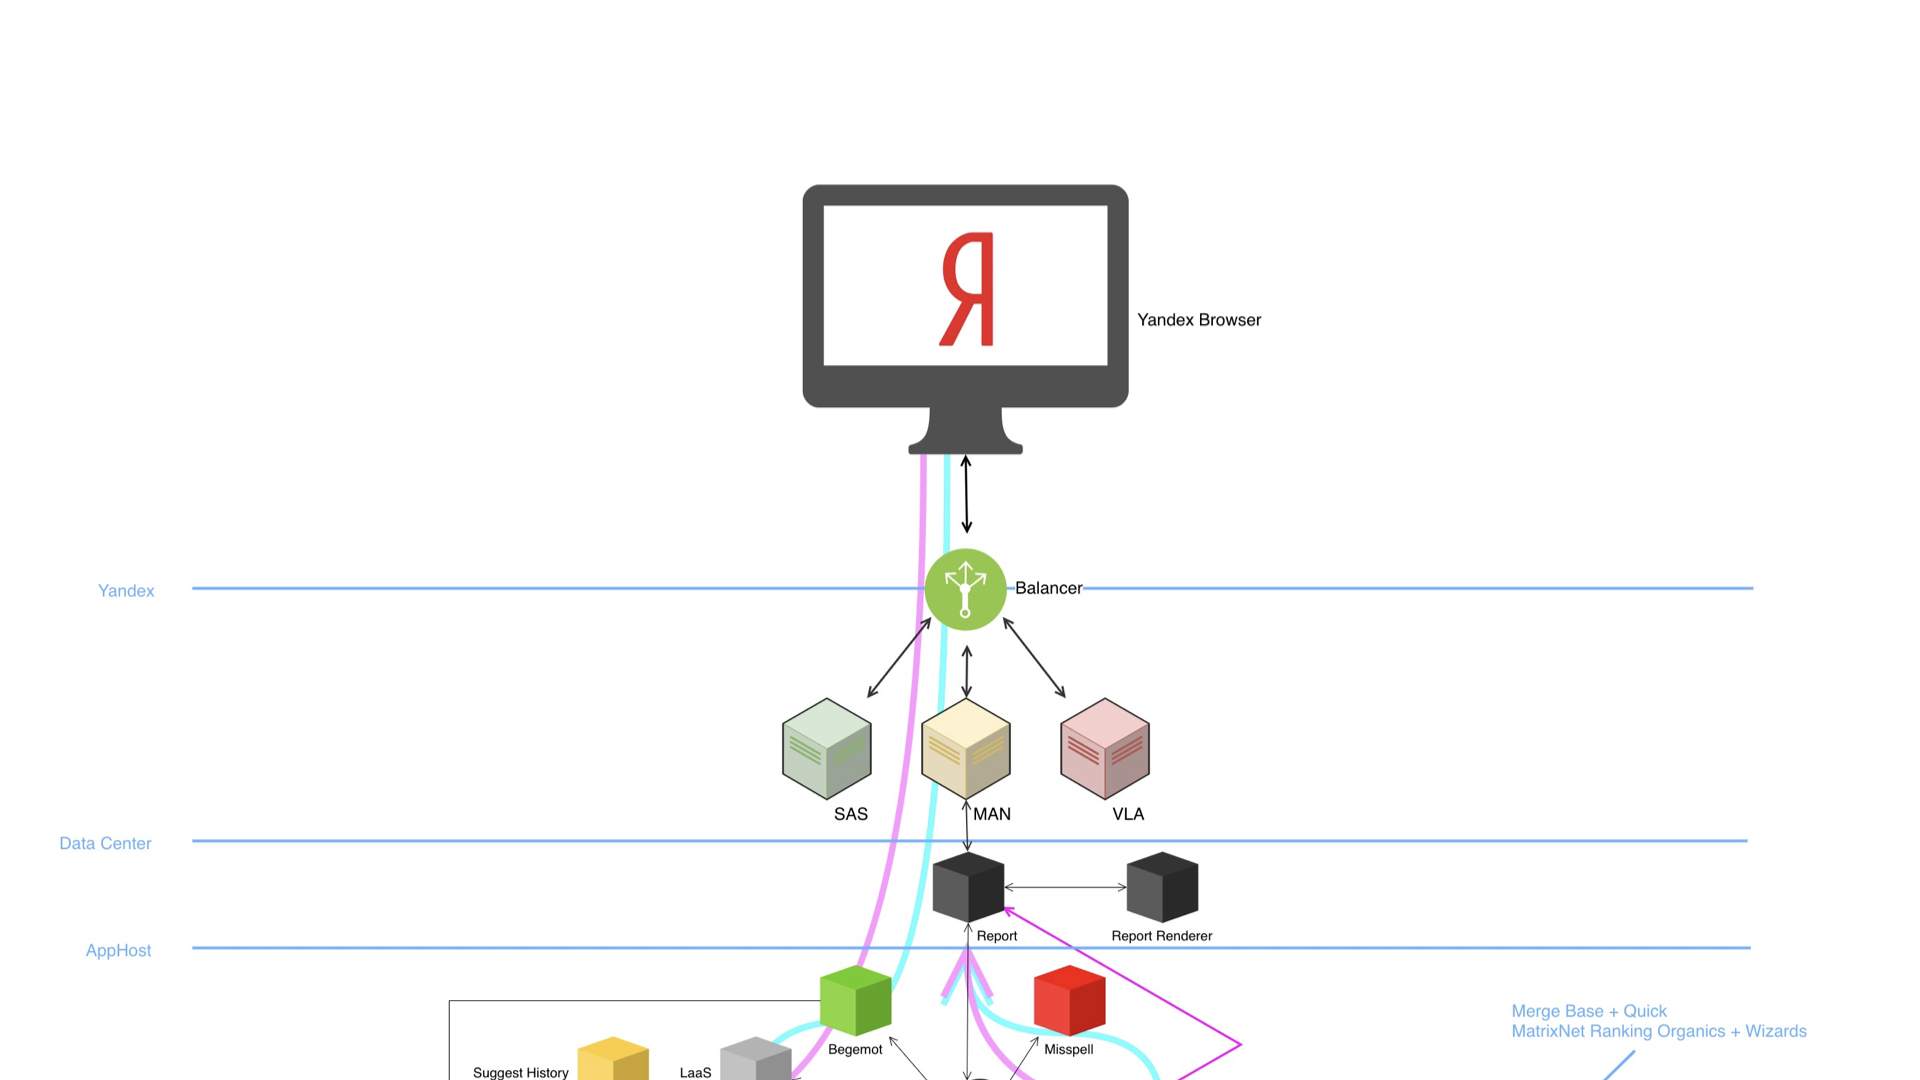
We pass directly to the meat, about the great Search. The Big Search in its structure looks something like this.
We have a browser, a balancer, a lot of data centers and a huge rich infrastructure under the hood. The diagram demonstrates that the device is complex, there are many components. And what is most surprising, all these components are able to conduct A / B experiments and, of course, write and analyze logs.
Logs
Logs are written by many, many components. Of course, it’s more interesting for us to talk in the context of the frontend. The frontend logs two large significant slices. These are purely technical logs related to the direct measurement of some time, performance on client devices. Real user measurement, RUM metrics. Here are the times before the first byte, before the first rendering, before loading all the DOM content and before interactivity.
Along with this, there are logs written by both server and client typesetting. These are grocery logs. In our realities, even here there is a term “baobab”. Why baobab? Because the tree is a component tree, a feature tree in which one of the main logs is the logs of impressions, clicks and other technical events that we register for subsequent analysis.
This slide shows a tool for storing logs inside Yandex and for distributed computing. We have it called Yandex Tables, YT . Everything developed in Yandex has the letter Y. I tried to recall the analogue of this tool in the outside world. In my opinion, Facebook has a MapReduce tool called Hadoop. It allows you to implement storage and calculation.
The slide shows statistics for August 8 this year. One of the most valuable search logs, user sessions, is 54 terabytes per day in its form. This is a huge amount of information that can not be shoveled in its raw form. Therefore, one must be able to build some high-level stories.
To work with logs, in particular, all of our especially experienced developers must master some kind of analytical tool.
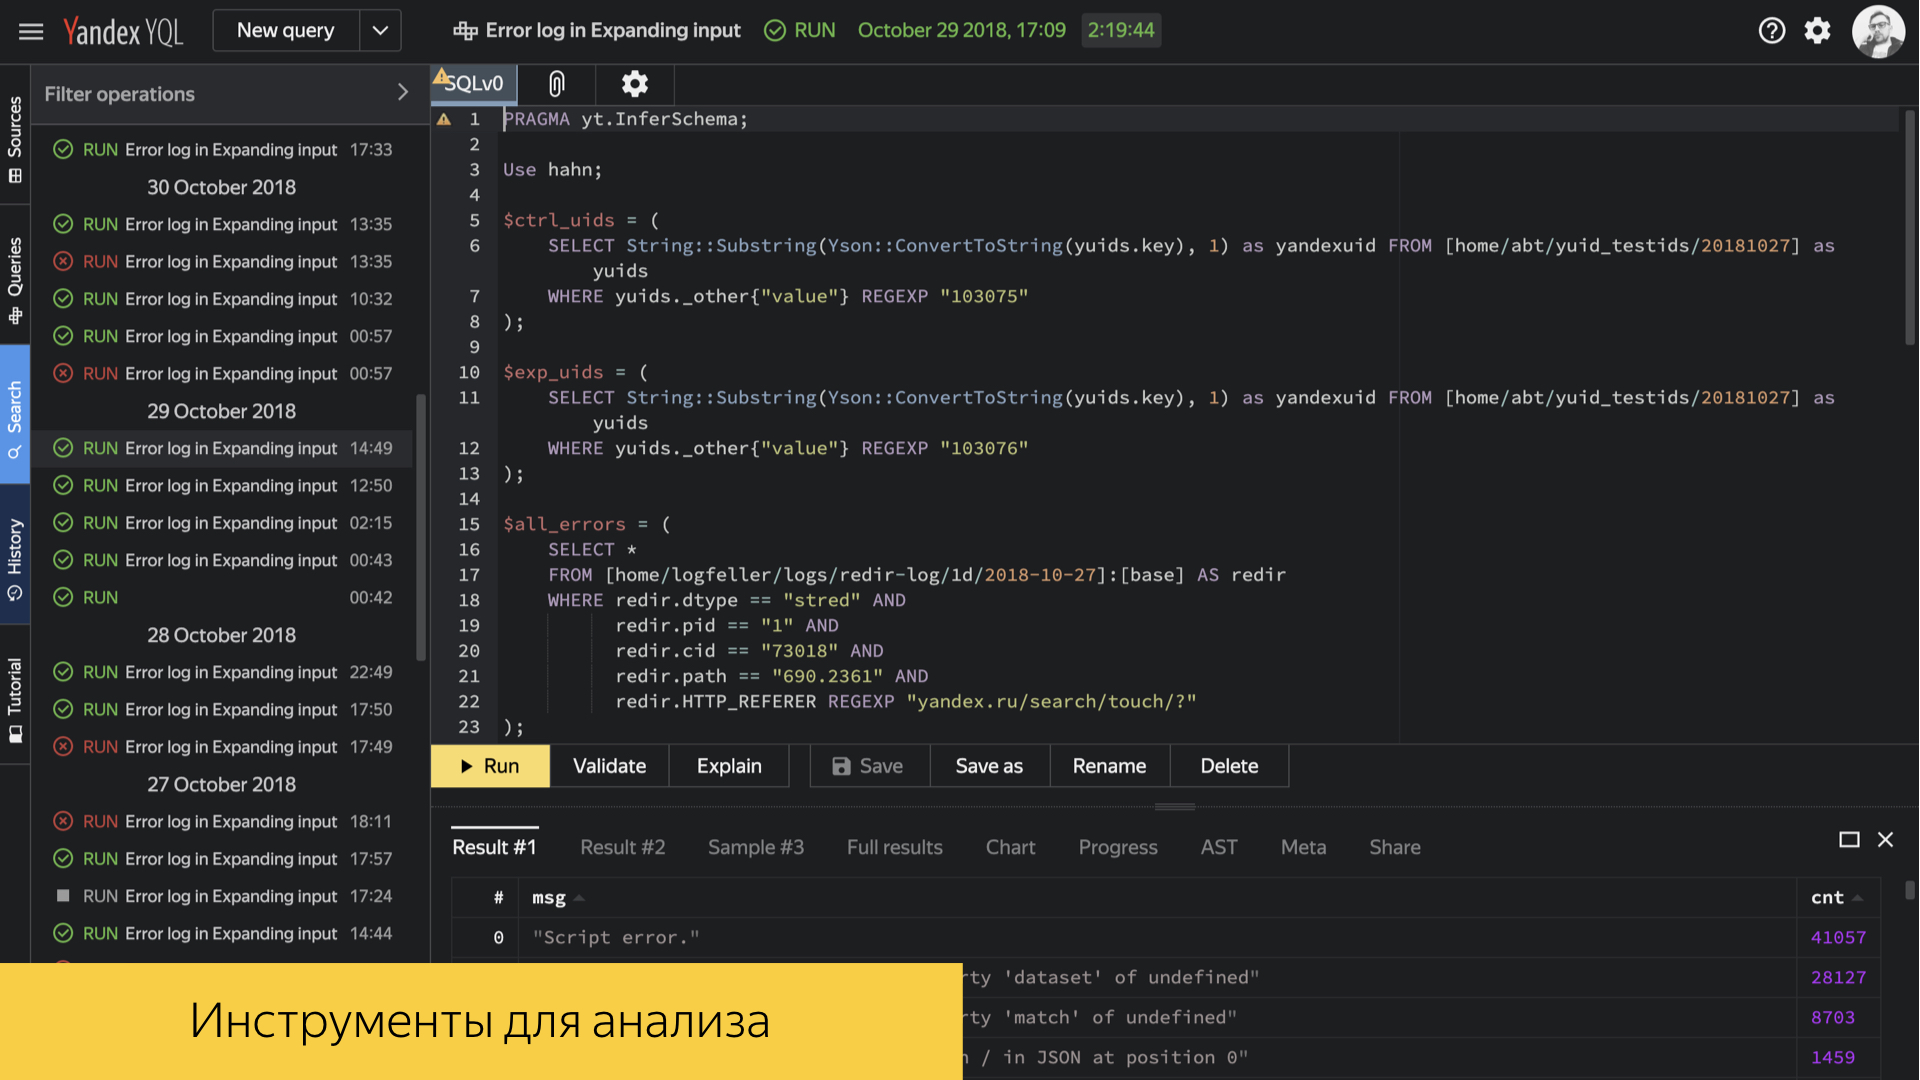
Inside Yandex, there is a YQL tool. This is a SQL-like query and computation language over our logs, which allows you to build all kinds of environments, do just low-level analytics, look directly at specific numbers, average percentiles, and build reports. The tool is powerful enough, it has a huge branchy API and many features. A lot of infrastructure processes are built on its basis.
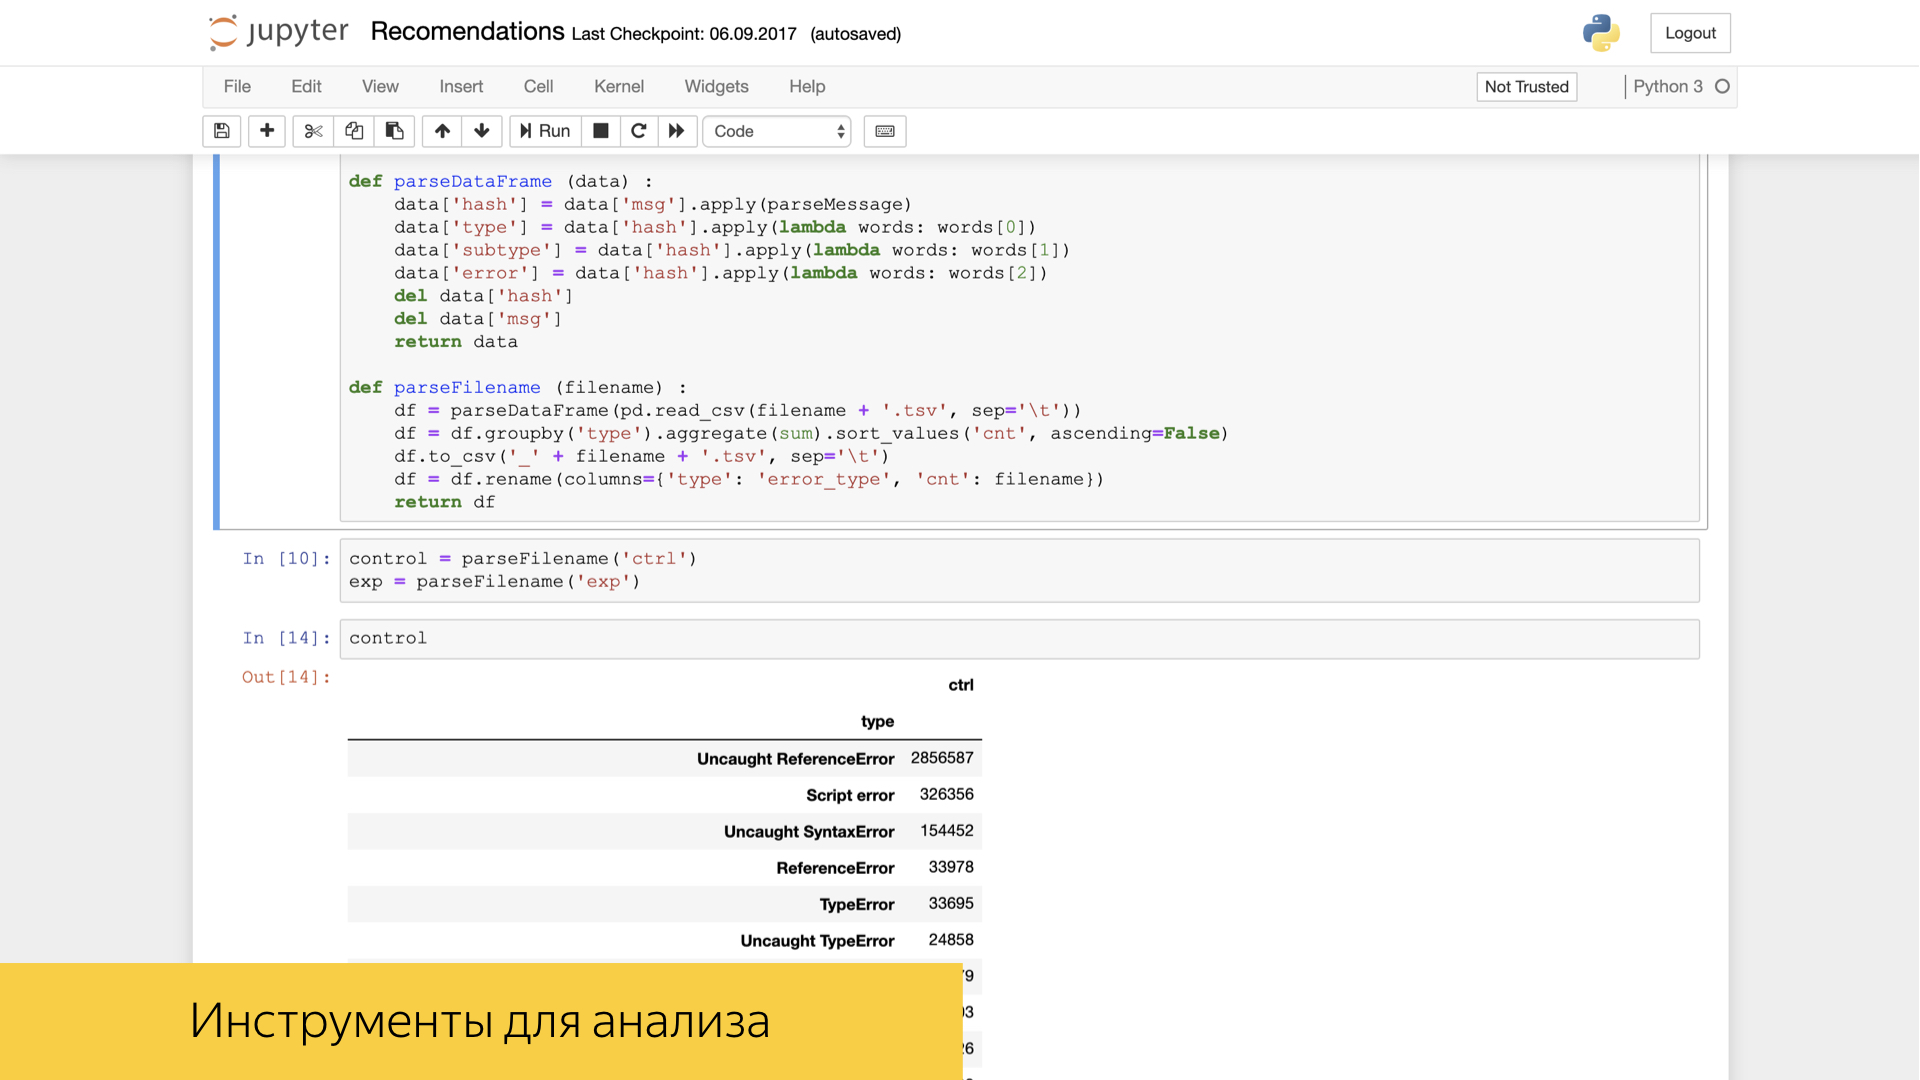
In addition, among our front-end developers and, in particular, analysts, the Jupyter tool is in great demand and popularity. It is already possible with the power of Numpy tools and other tools known to you, for example Pandas, to do some transformations and high-level analytics over our logs.
We really value the logs, literally fighting for each entry. To do this, in the repository of our search project, there are tests in the front-end code that allow us to verify that all events are correctly recorded. We write tests for each of our features, we can check a specific script, click on certain links, buttons, scroll through certain galleries in our interface and see what exactly the number of logs was recorded exactly with the values that we expect, which we recorded, for which we made some standards. And then we’ll go into these reference values.
We also pay great attention to the performance of our interfaces. In any pool request with new functionality or refactoring of existing functionality, we pay great attention to the times, volumes, number of calls of certain functions. On the slide is one of the reports of a completely random pool request. We have two stages of search, one is ajax type: first we load the header on the page with the search arrow, and when all the search sources work out, we can measure exactly the times of template and all the performance already when rendering the main part of the output.
For us, as, of course, and for any other subject in IT, errors in production and in special environments are very important. We have a tool called error booster, which allows you to look at real errors in production in real time with a fairly good time frame. Under the hood, this tool uses the ClickHouse database, in which queries are processed quite quickly, and the database itself is designed for analytical work. Most interactions are implemented specifically with ClickHouse.
We talked about the logs, about their varieties. There are a lot of them. In order to move experiments and analyze something, to make decisions on something, we have a large number of metrics. These are some convolutions over large volumes of raw data.
Metrics
Yandex now has about 8.6 thousand of various metrics that are based on the same raw logs - and higher-level ones, such as search and user sessions. They are very diverse, and often precisely feature-oriented. That is, these are metrics specific to a particular sorcerer, a specific block, a slice of requests, the type of documents that we display.
In our test scenarios, it is possible to check the value of metrics in our own interfaces. When we lost certain scenarios, we can look at the results of calculations over the logs and sourcing certain metric values.
An important role is played by speed metrics. All of them are simple enough arranged. This is usually either some kind of percentile, or the average value and its deviation and statistical significance.
There are a lot of them, they take into account both the time of standardization and the time of delivery of content to the user's device.
Direct client performance is also taken into account: rendering time, interactivity time, and others.
The experiments
So how do we conduct experiments? For example, there are two users who suddenly decided to use Yandex search. We agreed with each other - we go today, for example, to Starbucks, and are looking for him using our search. Their requests, falling into the infrastructure of our search sources, are marked with certain markers. By markers, these users fall into various experiment baskets. In each of the baskets there is a certain set of flags that activate experiments in each of the search sources. For example, these two users went to search results and used search hints. The first introduces “Starbucks”, sees some verbal clues in the form of words. When he ends up with a search, he sees a block about this organization, says - yes, I found it, I’m going there. And the second user discovers a navigation hint already in the interface of search hints, quickly switches to the organization and receives a response faster.
For all this variety of changes, differences in the interface, in a certain functionality, the BEM tool is responsible. This is not just a framework, but a whole methodology for the declaration of visual components, their modifications. Even here in the background are the very DNA chromosomes that seem to mutate through bem. In fact, bem is Yandex DNA, the DNA of experiments in the front end.
There are several implementations in the methodology. One of them is on an already established i-bem stack, which is somewhere under the hood connected to jQuery. This is already quite mature technology. On such a stack, we can solve a lot of problems. Today, bem-react technology, which is already implemented on the React framework and TypeScript language, is gaining great boost and development. All these tools allow you to build experiments and preach the main idea - the ability to declare both visual components and their modifications. We have a whole separate level in the repository with declarations of those very experiments. But around 2015, they realized that it was economically unprofitable to smear our experimental flags throughout the frontend code. The fact is that units of experiments reach real production, and everything that is not used is very difficult to cut from the code later. Therefore, we evicted them to a separate level of definition. And here again thanks to the bem-methodology, which gave us the opportunity to use redefinition levels. We declare our experiments on them.
This is one of the reports of experiments. Two columns: control and experiment. Before you is not even everything that is in the report. Why is he so long? First of all, you saw how many metrics we have - 8.6 thousand.
But the main role is actually played only by the metrics that differ. And we are able to conduct our experiments at the same time, that is, on one user we can simultaneously have about 20 experiments. They do not conflict with each other and at the same time in all our experiments only their purely product metrics are stained, without affecting each other. Now there are about 800 experiments in production: not only search engines, but also from so many services. The tool is called AB, which is not surprising. Services start experiments in it, declare certain samples, and then look at the differences between metrics, which after some period begin to differ in experiment and control.
Related Developer Roles
As a consequence of this diversity in the work of front-end developers, there are even roles among them. There are experts on experiments, and for this we officially give achievements in the framework of the Yandex internal network, people really pass exams. They analyze experiments, validate their results about experts and get a passport that says: “I’m an analyst, I can analyze experiments.” And in general, all work with experiments, with our metrics, is focused primarily on improving the product itself. I am one of the representatives, I am very motivated to develop a product, not just code and not technology. And it really drives me when I come to a team and make a product.
What is the bottom line? We have a large number of logs written daily to our storage systems. There are a large number of metrics that we calculate, we conduct experiments on them. Very large infrastructure. The top modern tool that allows you to implement a huge number of tools is the bem-react package. We pay great attention to indicators of speed and quality, product stability. And in general, we are growing in our developers more and more new roles related to the main specialty - the frontend. That's all I wanted to say. Thanks for your attention.
All Articles