Sampler. Console utility for visualizing the result of any shell commands
In general, using the shell command, you can get any metric without writing code or integrations. So in the console there should be a simple and convenient tool for visualization.
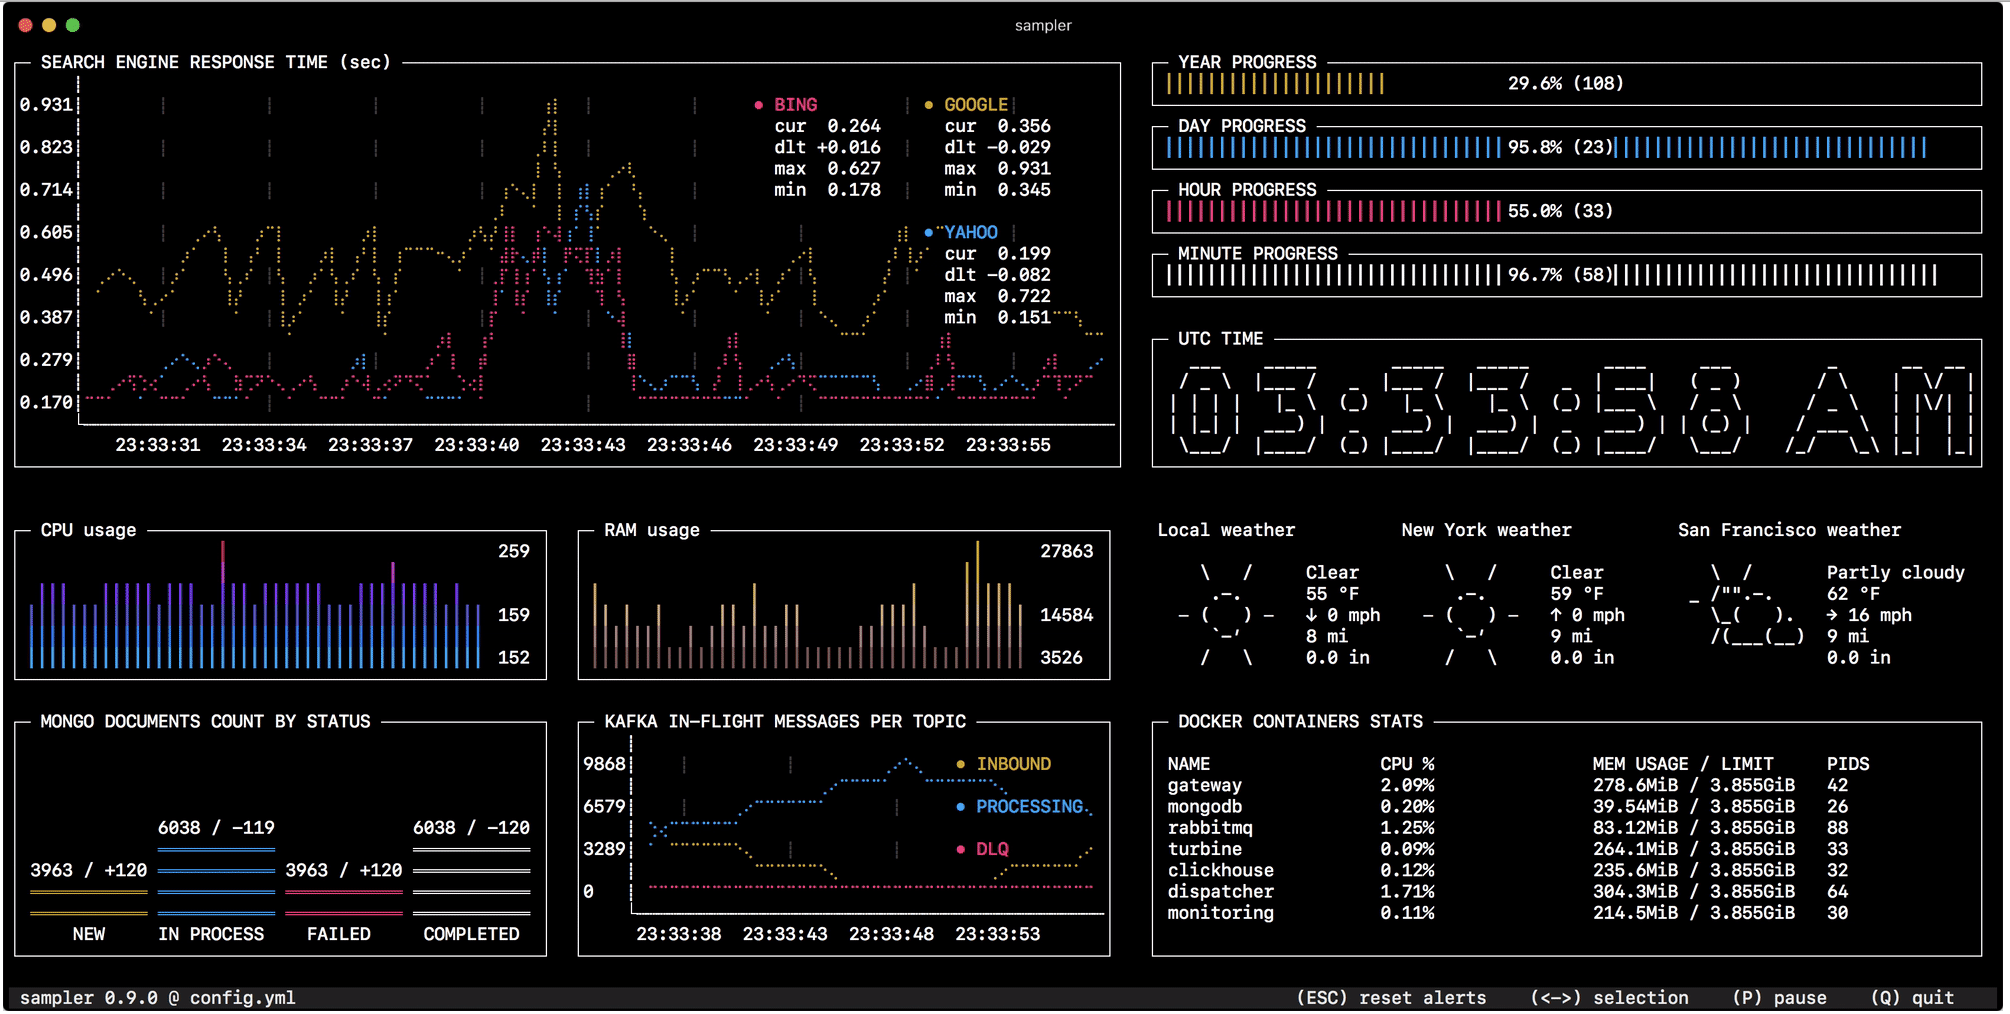
Monitoring the state change in the database, monitoring the size of queues, telemetry from remote servers, launching script scripts and receiving notifications upon completion is configured in a minute with a simple YAML file.
The code is available on github . Installation instructions - for Linux, macOS and (experimental) Windows.
Why do I need this when there are complete monitoring systems?
I must say right away that this is in no way an alternative to full-scale dashboards and monitoring. Comparing Sampler with Prometheus + Grafana is the same as comparing tail
and less
with Elastic Stack or Splunk .
But if you raise and configure production monitoring for your task - like a cannon on sparrows, then perhaps Sampler will be the answer to the question. It was conceived as a tool for prototyping, demonstrating, or simply observing metrics on a locale and a remote server.
So it must be put on all servers?
No, Sampler can be run locally, but metrics can be taken from many remote machines. Each component on the dashboard has an init
section where you can enter via ssh
(or do any other action to enter the interactive shell
- establish a connection to the database, connect via JMX, log in to the API, etc.)
Component Views and Configuration Examples
The configuration examples show commands for macOS. Many will work unchanged under Linux, but some need to be adapted.
Runchart

runcharts: - title: Search engine response time rate-ms: 500 # sampling rate, default = 1000 scale: 2 # number of digits after sample decimal point, default = 1 legend: enabled: true # enables item labels, default = true details: false # enables item statistics: cur/min/max/dlt, default = true items: - label: GOOGLE sample: curl -o /dev/null -s -w '%{time_total}' https://www.google.com - label: YAHOO sample: curl -o /dev/null -s -w '%{time_total}' https://search.yahoo.com - label: BING sample: curl -o /dev/null -s -w '%{time_total}' https://www.bing.com
Sparkline

sparklines: - title: CPU usage rate-ms: 200 scale: 0 sample: ps -A -o %cpu | awk '{s+=$1} END {print s}' - title: Free memory pages rate-ms: 200 scale: 0 sample: memory_pressure | grep 'Pages free' | awk '{print $3}'
Barchart

barcharts: - title: Local network activity rate-ms: 500 # sampling rate, default = 1000 scale: 0 # number of digits after sample decimal point, default = 1 items: - label: UDP bytes in sample: nettop -J bytes_in -l 1 -m udp | awk '{sum += $4} END {print sum}' - label: UDP bytes out sample: nettop -J bytes_out -l 1 -m udp | awk '{sum += $4} END {print sum}' - label: TCP bytes in sample: nettop -J bytes_in -l 1 -m tcp | awk '{sum += $4} END {print sum}' - label: TCP bytes out sample: nettop -J bytes_out -l 1 -m tcp | awk '{sum += $4} END {print sum}'
Gauge
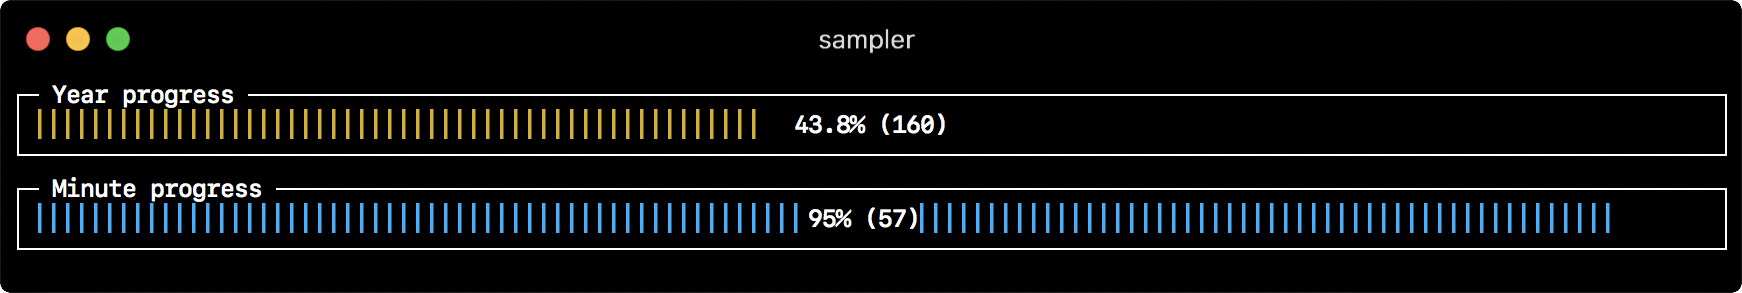
gauges: - title: Minute progress rate-ms: 500 # sampling rate, default = 1000 scale: 2 # number of digits after sample decimal point, default = 1 percent-only: false # toggle display of the current value, default = false color: 178 # 8-bit color number, default one is chosen from a pre-defined palette cur: sample: date +%S # sample script for current value max: sample: echo 60 # sample script for max value min: sample: echo 0 # sample script for min value - title: Year progress cur: sample: date +%j max: sample: echo 365 min: sample: echo 0
Textbox

textboxes: - title: Local weather rate-ms: 10000 # sampling rate, default = 1000 sample: curl wttr.in?0ATQF border: false # border around the item, default = true color: 178 # 8-bit color number, default is white - title: Docker containers stats rate-ms: 500 sample: docker stats --no-stream --format "table {{.Name}}\t{{.CPUPerc}}\t{{.MemUsage}}\t{{.PIDs}}"
Asciibox
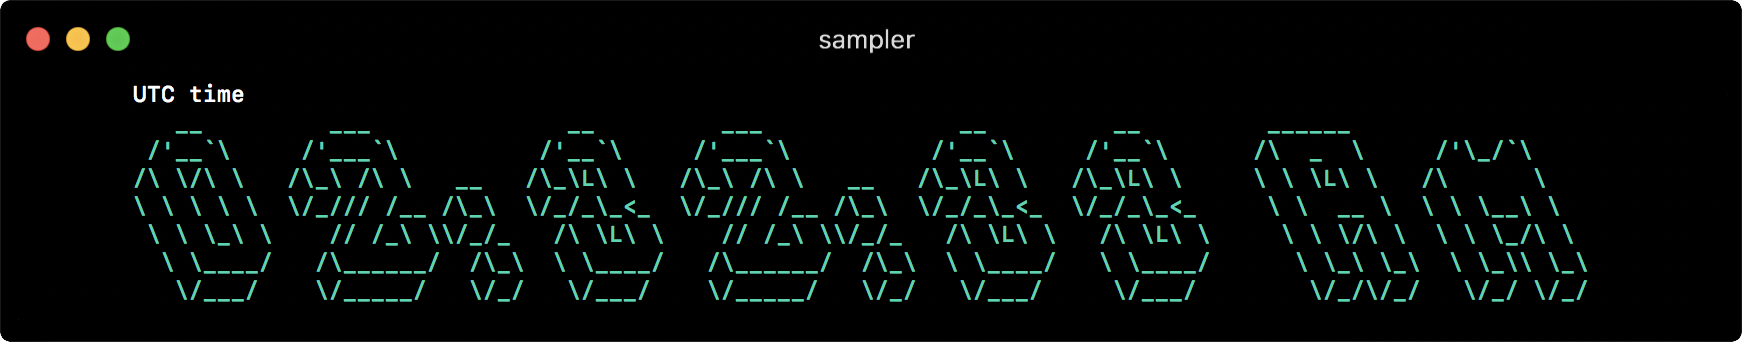
asciiboxes: - title: UTC time rate-ms: 500 # sampling rate, default = 1000 font: 3d # font type, default = 2d border: false # border around the item, default = true color: 43 # 8-bit color number, default is white sample: env TZ=UTC date +%r
Additional functionality
Triggers
Triggers allow you to trigger some additional action if the measured value meets the specified condition. Both the condition and the reaction are also shell commands into which the variables $label
, $cur
and $prev
are supplied. First of all, triggers were conceived for alerting (sound and visual notifications are built-in), but with the option of your own script to respond to the triggering of a trigger, you can customize its action as you like (for example, send a notification to your phone with Pushover )
The example below illustrates the configuration of triggers. If the latency of the search engine response exceeds 0.3 sec - Sampler blinks the standard terminal bell, loses NASA quindar tone, displays a visual notification on the graph and runs a script that in this case speaks the measured latency value in voice:
runcharts: - title: SEARCH ENGINE RESPONSE TIME (sec) rate-ms: 200 items: - label: GOOGLE sample: curl -o /dev/null -s -w '%{time_total}' https://www.google.com - label: YAHOO sample: curl -o /dev/null -s -w '%{time_total}' https://search.yahoo.com triggers: - title: Latency threshold exceeded condition: echo "$prev < 0.3 && $cur > 0.3" |bc -l # "1" TRUE actions: terminal-bell: true # default = false sound: true # NASA quindar tone, default = false visual: true # default = false script: 'say alert: ${label} latency exceeded ${cur} second'
Interactive shell
If you need to enter the interactive shell before starting sampling (for a one-time connection to the database, SSH login, connection to JMX, etc.), you can specify an init script
that will be executed once at startup. An example of connecting and polling mongoDB:
textboxes: - title: MongoDB polling rate-ms: 500 init: mongo --quiet --host=localhost test # sample: Date.now(); # mongo shell transform: echo result = $sample #
In addition, there is support for PTY mode and multistep-init scripts .
Variables
If the configuration contains frequently used parts that you do not want to repeat, you can put them into variables and use anywhere in the YML file.
On practice
As a backend programmer, I often have to debug, prototype and measure. Hence the regular need for quick visualization and monitoring. Writing something custom every time is unreasonably long, but if the customization process was quick and (more or less) convenient, such a visualization could well save time and solve problems. I could not find anything like this, so it was decided to write such a tool myself, and make it as universally configurable as possible.
For the very first time for its intended purpose, I began to use it to debug the mechanism of grouping and accumulation of data, which quickly changes the status of "events" in memory. Reading the state of the system from the logs or polling individual counters for each of the statuses doesn’t help you quickly find out and understand what's what, but one look at Sampler completely solves this problem -
For everything that I use myself, I prepared a collection of "recipes" - mook configurations that you can copy and immediately start customizing for your tasks
- Database Connections: MySQL, PostgreSQL, MongoDB, Neo4J
- Kafka
- Docker
- Ssh
- Jmx
This list will be supplemented (and your contribution is very welcome), and in the meantime, in issues, people started sharing their configurations for dashboards Kubernetes, Github, and more.
That's all, habr. I would be glad if someone would be useful.
All Articles