How social networks absorb our attention: a big study about screen time
In late July, I asked @PonchikNews subscribers to send an anonymously a screenshot of their Screen Time screen with information on the use of mobile applications over the past 7 days. After analyzing these screens, I came to interesting hypotheses and conclusions. Share them right away, in TL; DR.
TL; DR:
Among the people who sent the screens (n = 122), we observe this:
- Social networks eat almost half (46%) of all screen time (from a third to two-thirds in most cases).
- Instagram is the most dopamine-squeezing app to date. Average use: almost 7 hours a week. IG in the top 5 applications for use in 58% of those who sent screens.
- The business model of most popular applications by time of use is the advertising, collection and sale of your data. They account for half of all top-end applications.
- The three companies that own most of the major screen-time applications are Facebook, Apple, and Google. Surprise!
- Yandex competes on-screen time with Google, Facebook, Apple, it seems, only through its maps (at least on the iPhone; maybe even search, but we don’t know which search engine is in browsers by default; there may be a struggle between Google and Yandex) .
- Productivity apps are sparse on charts. I suspect that the main work is gradually flowing into instant messengers or is done separately from the phone on the computer.
- Casual games practically do not take away the screen time of most readers. Have played enough.
- It seems that the main advice is this: protect your attention and time from corporations that use involving mechanics with social pressure and earn money from advertising, collecting and selling user data. Now there are no regulations on this subject, but at the same time, the field of engaging and habitually forming mechanics is not only science, but also daily practice. Only you yourself can adjust your time and attention in such a way as to maximize the pleasure of living and communicating with real people.
Full story below.
Given:
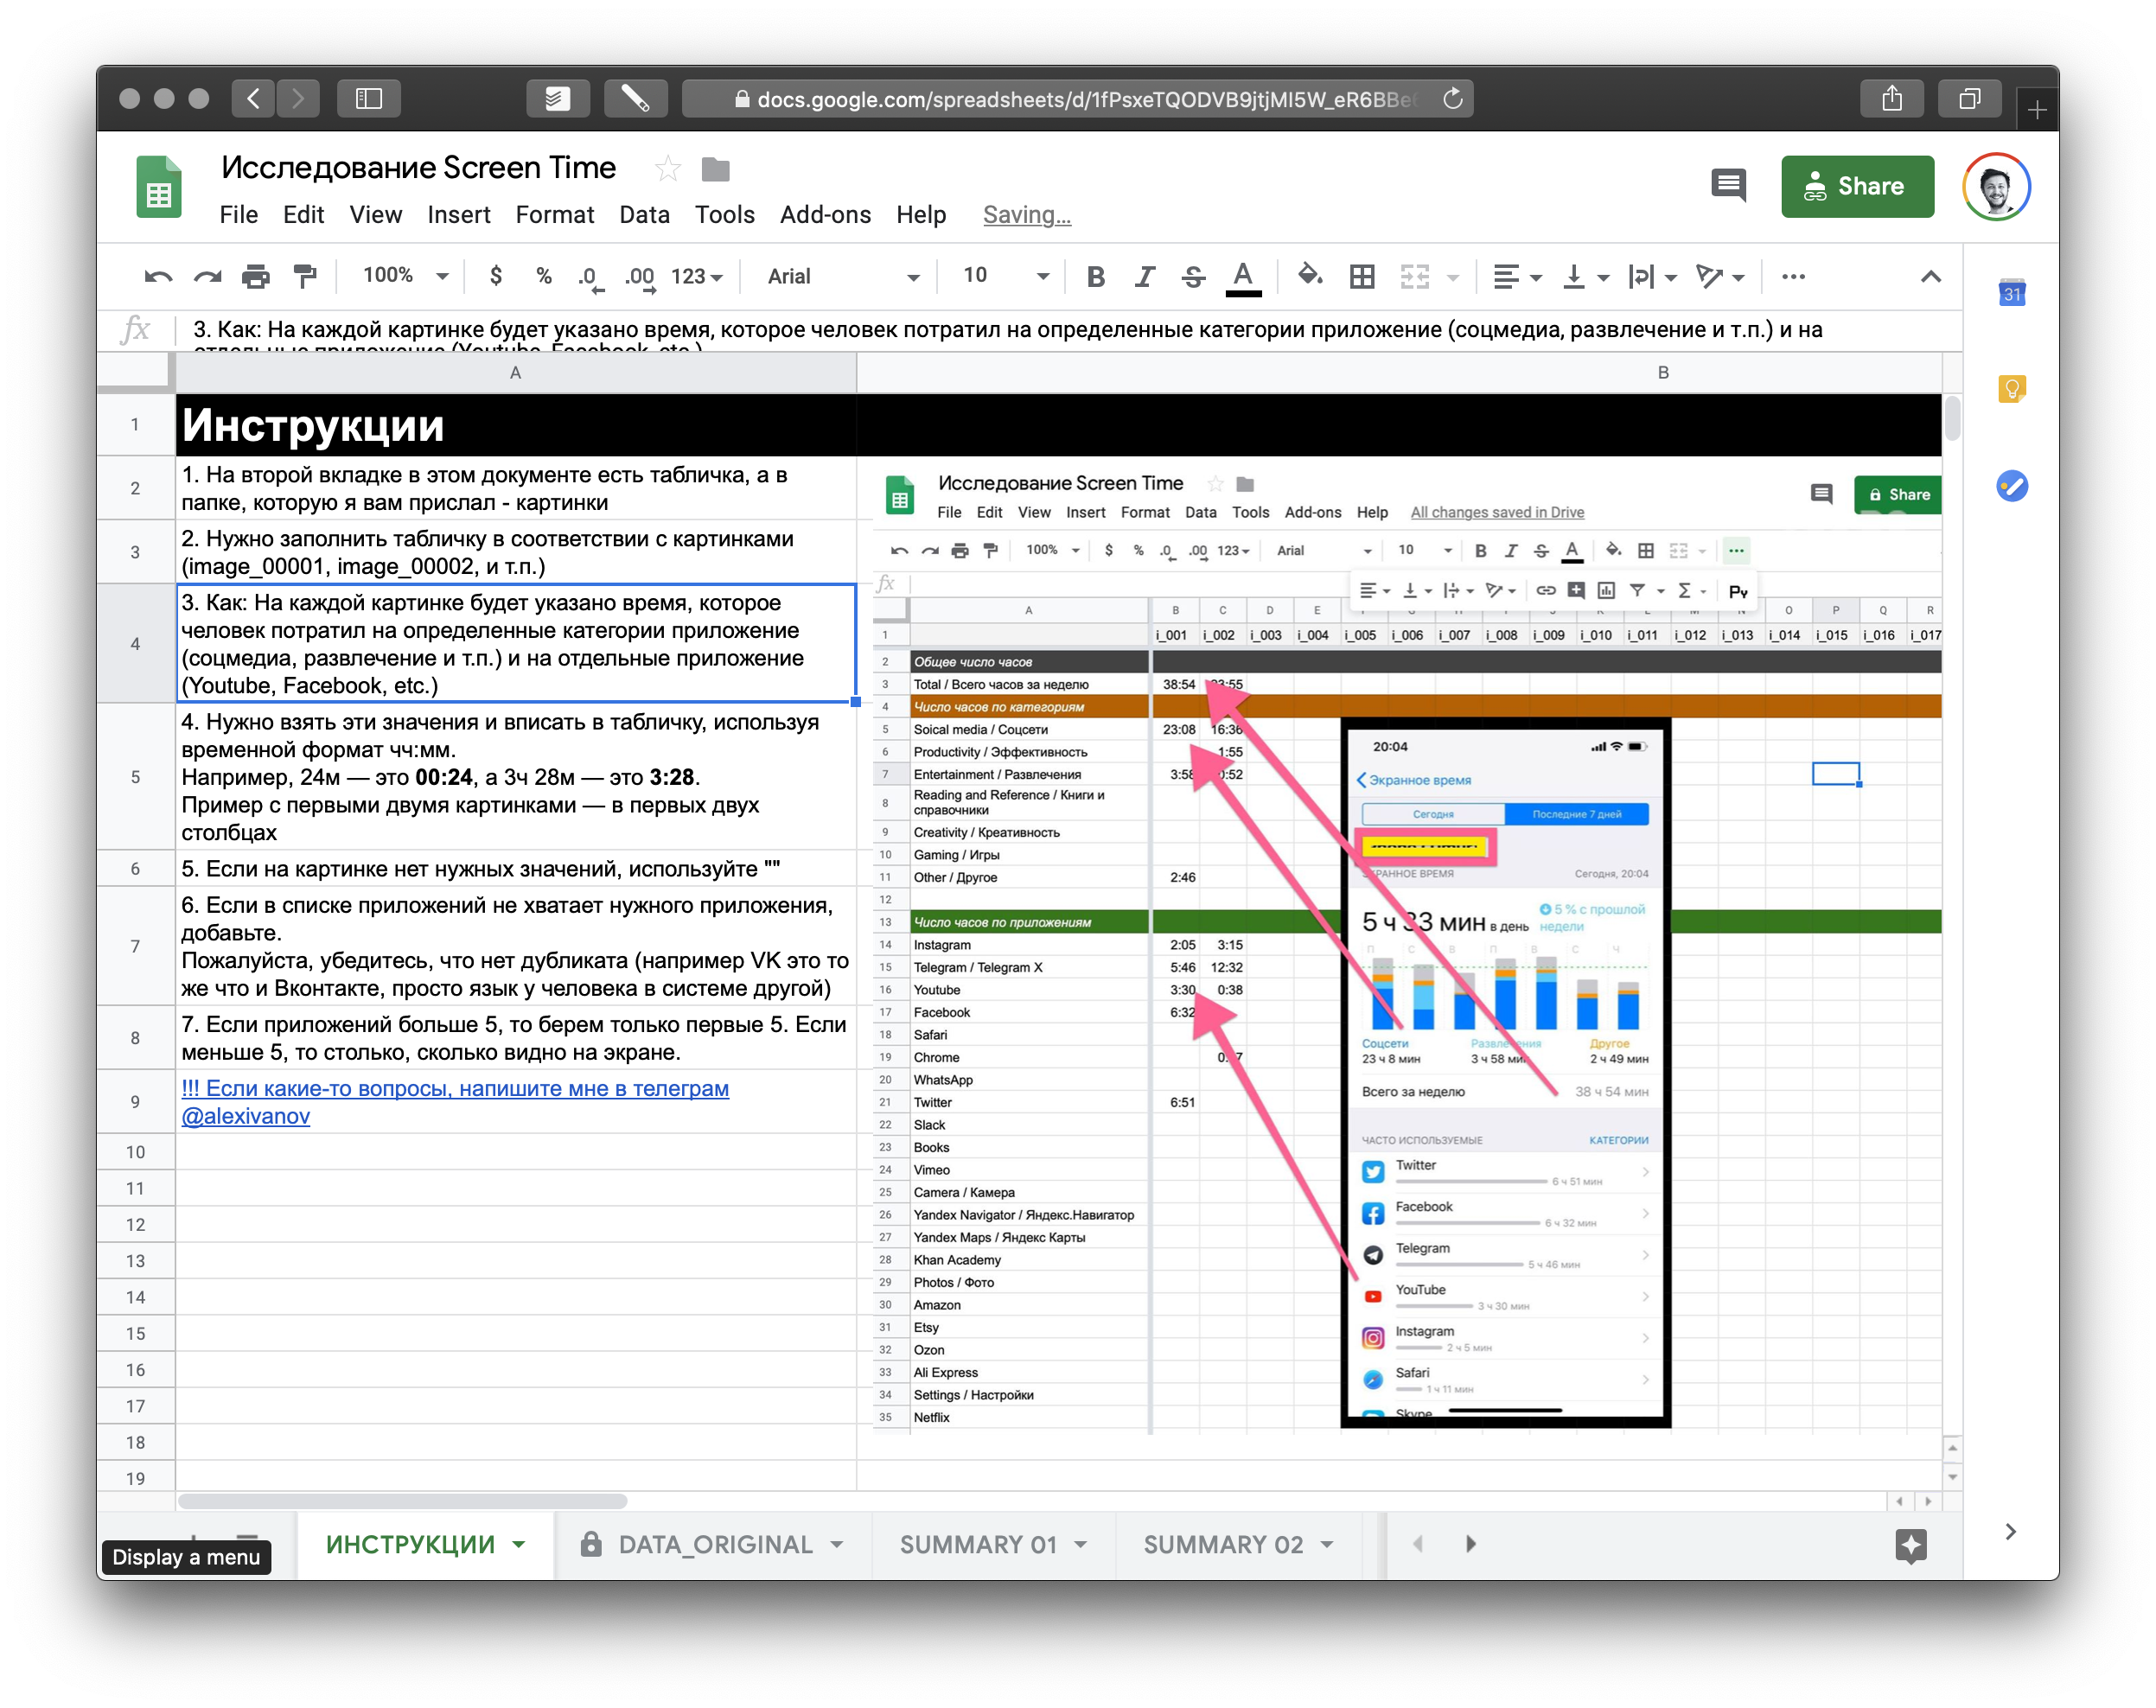
- The original google sheets, where data from n = 122 screens were driven.
- A selection of n = 122 screens from screenshots of “screen time”. Mostly iPhone owners participated, although there were a couple of Android owners. All came from the telegram ( ponchiknews ). Russian speakers. Judging by the languages and applications, they live everywhere - although the location did not track at all.
- We used only data about the weekly distribution of time by category, total weekly time, and the top 5 applications by time of use.
- I did not use information about notifications and raising the phone. Although I am sure, a separate interesting study can be made from this.
- The data is certainly very biased, and I certainly made a bunch of mistakes along the way. But we got a number of conclusions that seem to be close (from the word "good enough") to the real situation, at least for the subscribers of the channel.
Decision:
I. All screens were punched, unsuitable discarded, and a specially trained person with Youdo marked in google-table.
II. For each a) category and b) application, three important figures were obtained:
- average time of use (hours per week),
- median time of use (hours per week)
- % application / category in the top 5 applications by time of use.
III. I also counted some additional important stories:
- the average value of each category and application to the average total time,
- the same for medians,
- total average and median times per week,
- % of the presence of the category and application in the total number of screenshots.
It looked completely naughty, that is, like a wall of numbers.

IV. Then I thought a little more and analyzed a few additional pieces, namely:
- Top applications with> 2% and> 5% in the sample - to exclude unpopular applications. Only 22 were popular, 13 were very popular.
- Added categories to each of them, a business model, the name of the company that owns the application.
- He made several disappointing conclusions, but not on applications, but on companies and their main business models.
V. Then he dived some more information and calculated the correlation - categories to total time, applications to total time, etc. It turned out to understand some distributions. They will also be discussed.
Answer:
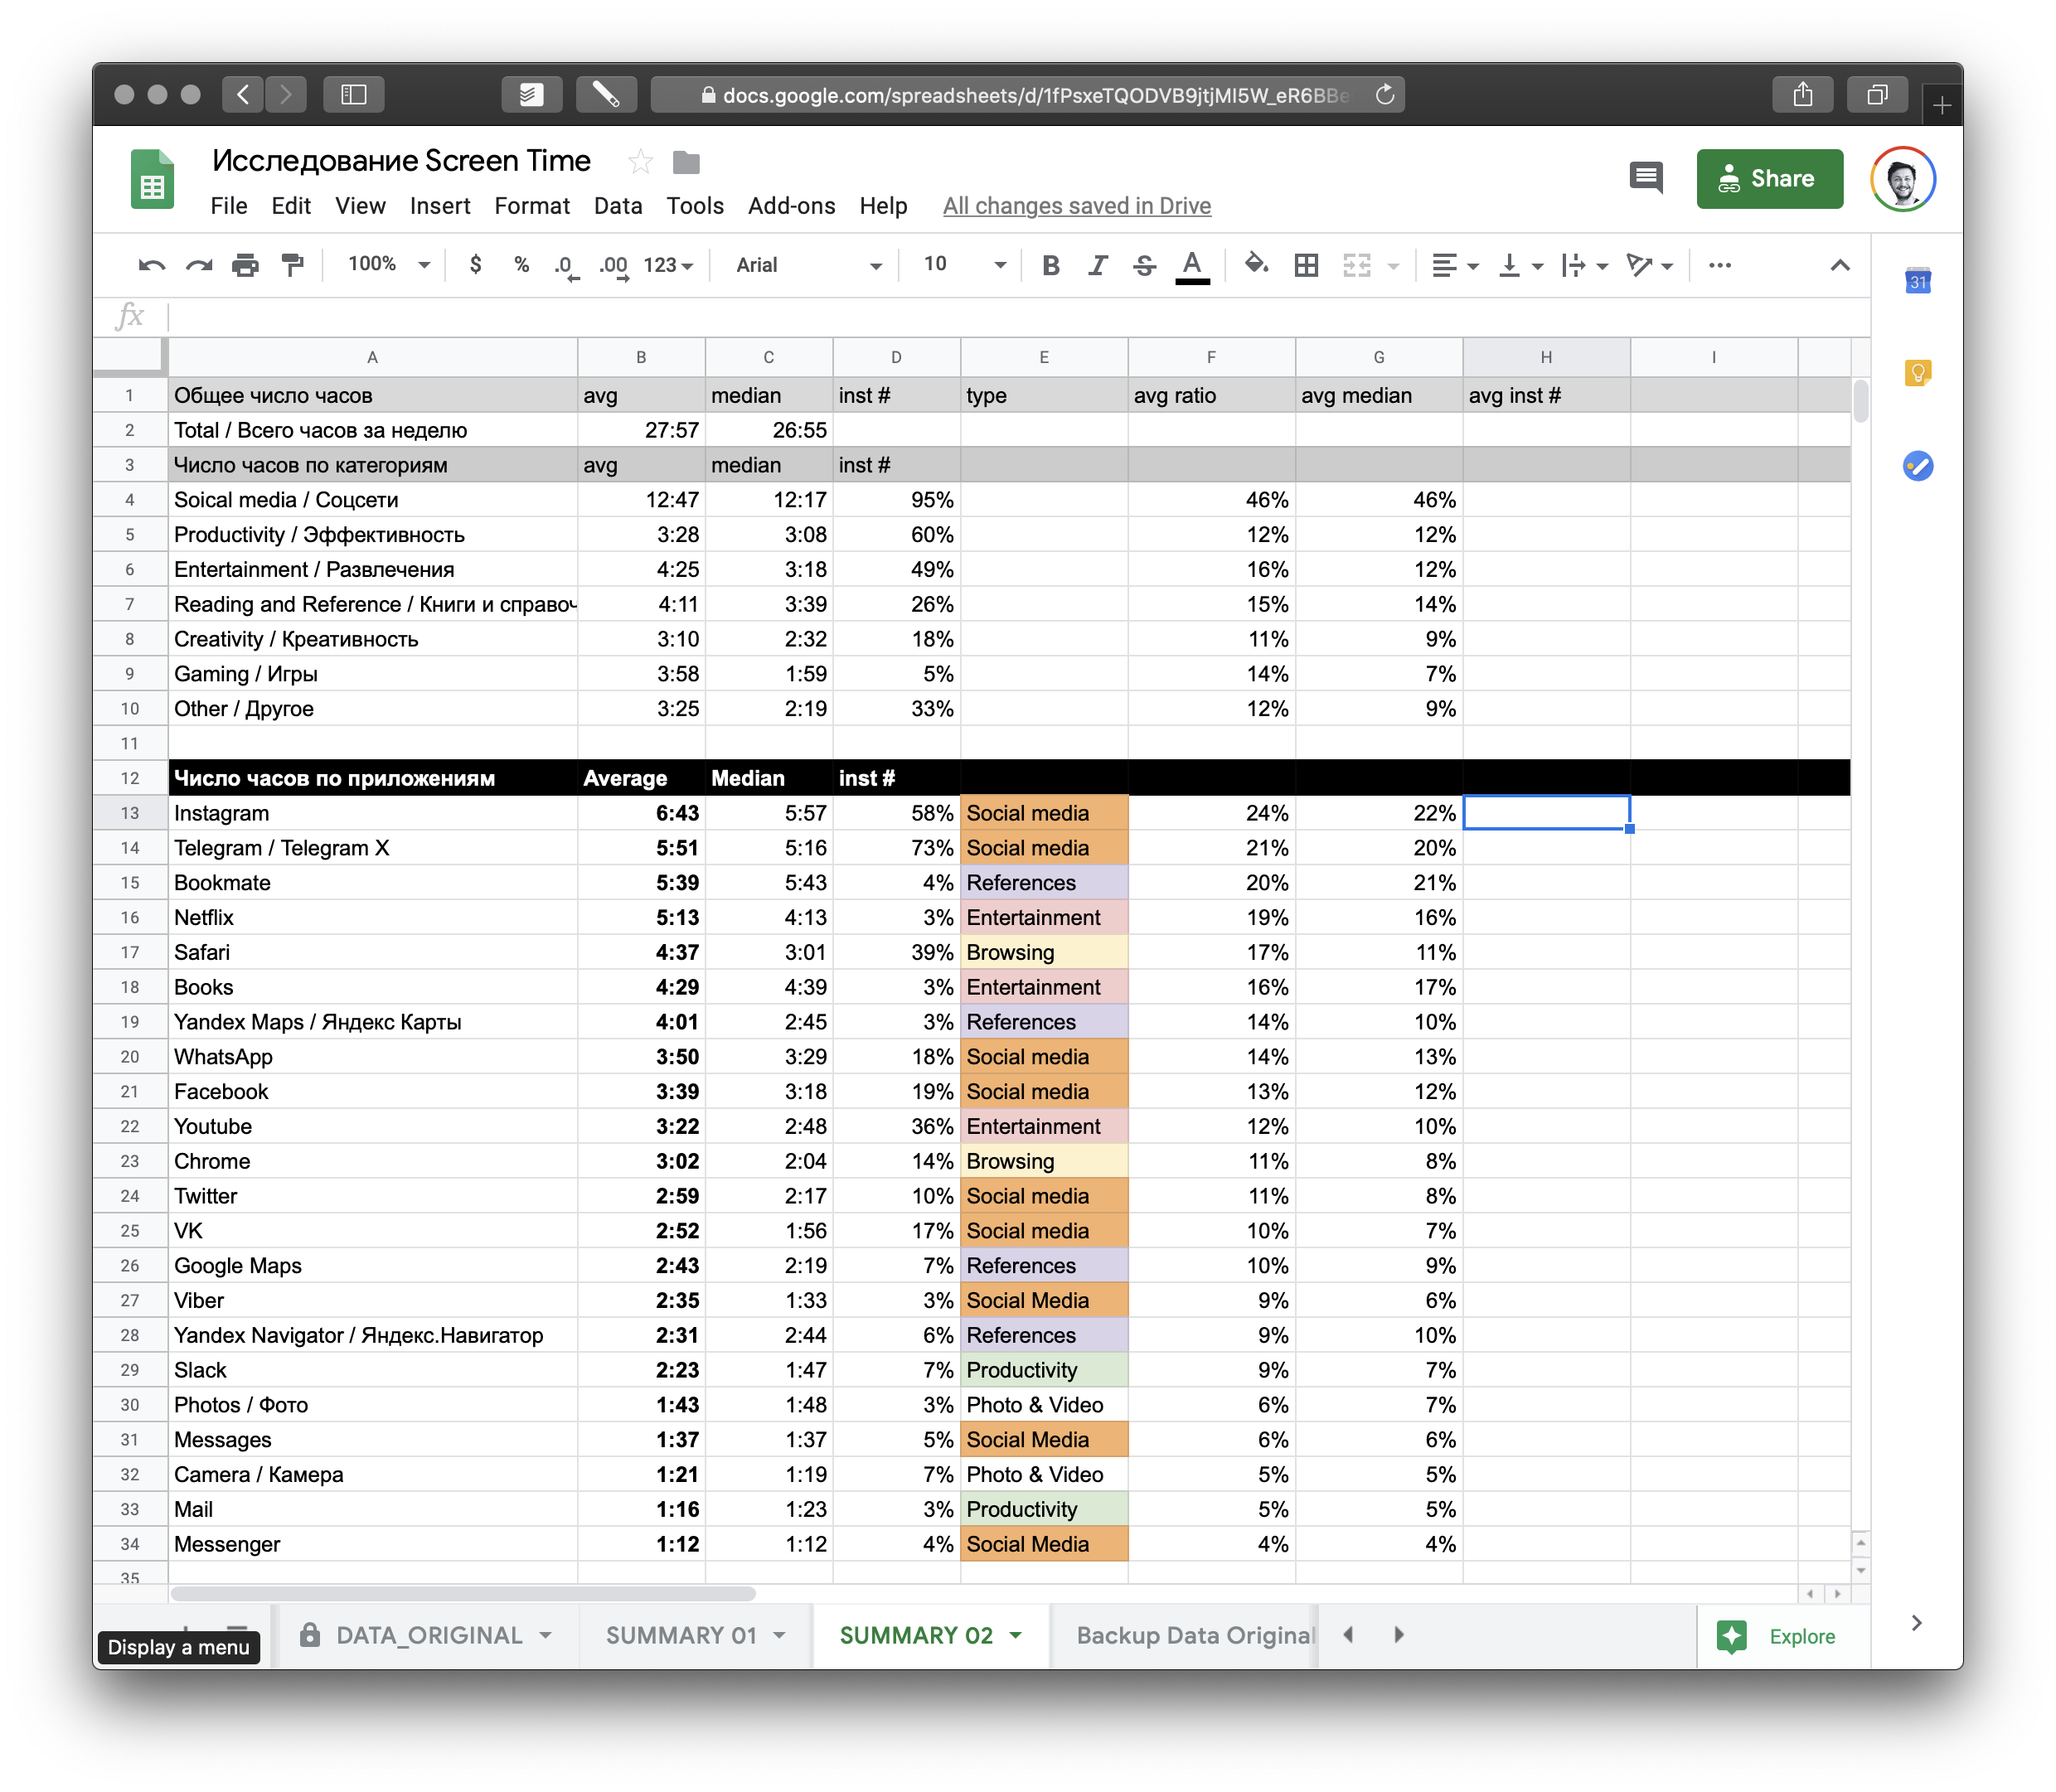
1. Top 3 categories by average time
In parentheses: the average number of hours per week and% of presence in the top 3 categories on the screens. To understand: the average total time the respondent spends on the phone is 27h 57m.
- Social networks (12h 47m, 95%) - mainly because of Instagram, Telegram, WhatsApp and the like.
- Entertainment (4h 25m, 49%) - mainly due to YouTube, VLC, Netflix, etc .;
- Books and reference books (4h 11m, 26%) - mainly because there are Navigators, Maps and Books, which by their nature take up a lot of screen time.
Observations:
- Note that the games in the top 3 are not even included. In general, they were in the top 3 categories of only 5% of respondents. Maybe everyone already had casual games?
- However, productivity is also not in the top 3. Perhaps because a lot of work happens in the messengers.
- Social networks on average (and median too) consume 46% of the screen time. This is almost half!
- I don’t know how time is considered inside Safari and Chrome. It seems that in the latest version of iOS 13, the OS is already able to determine in which categories we will browse, but I can not say anything about iOS 12.
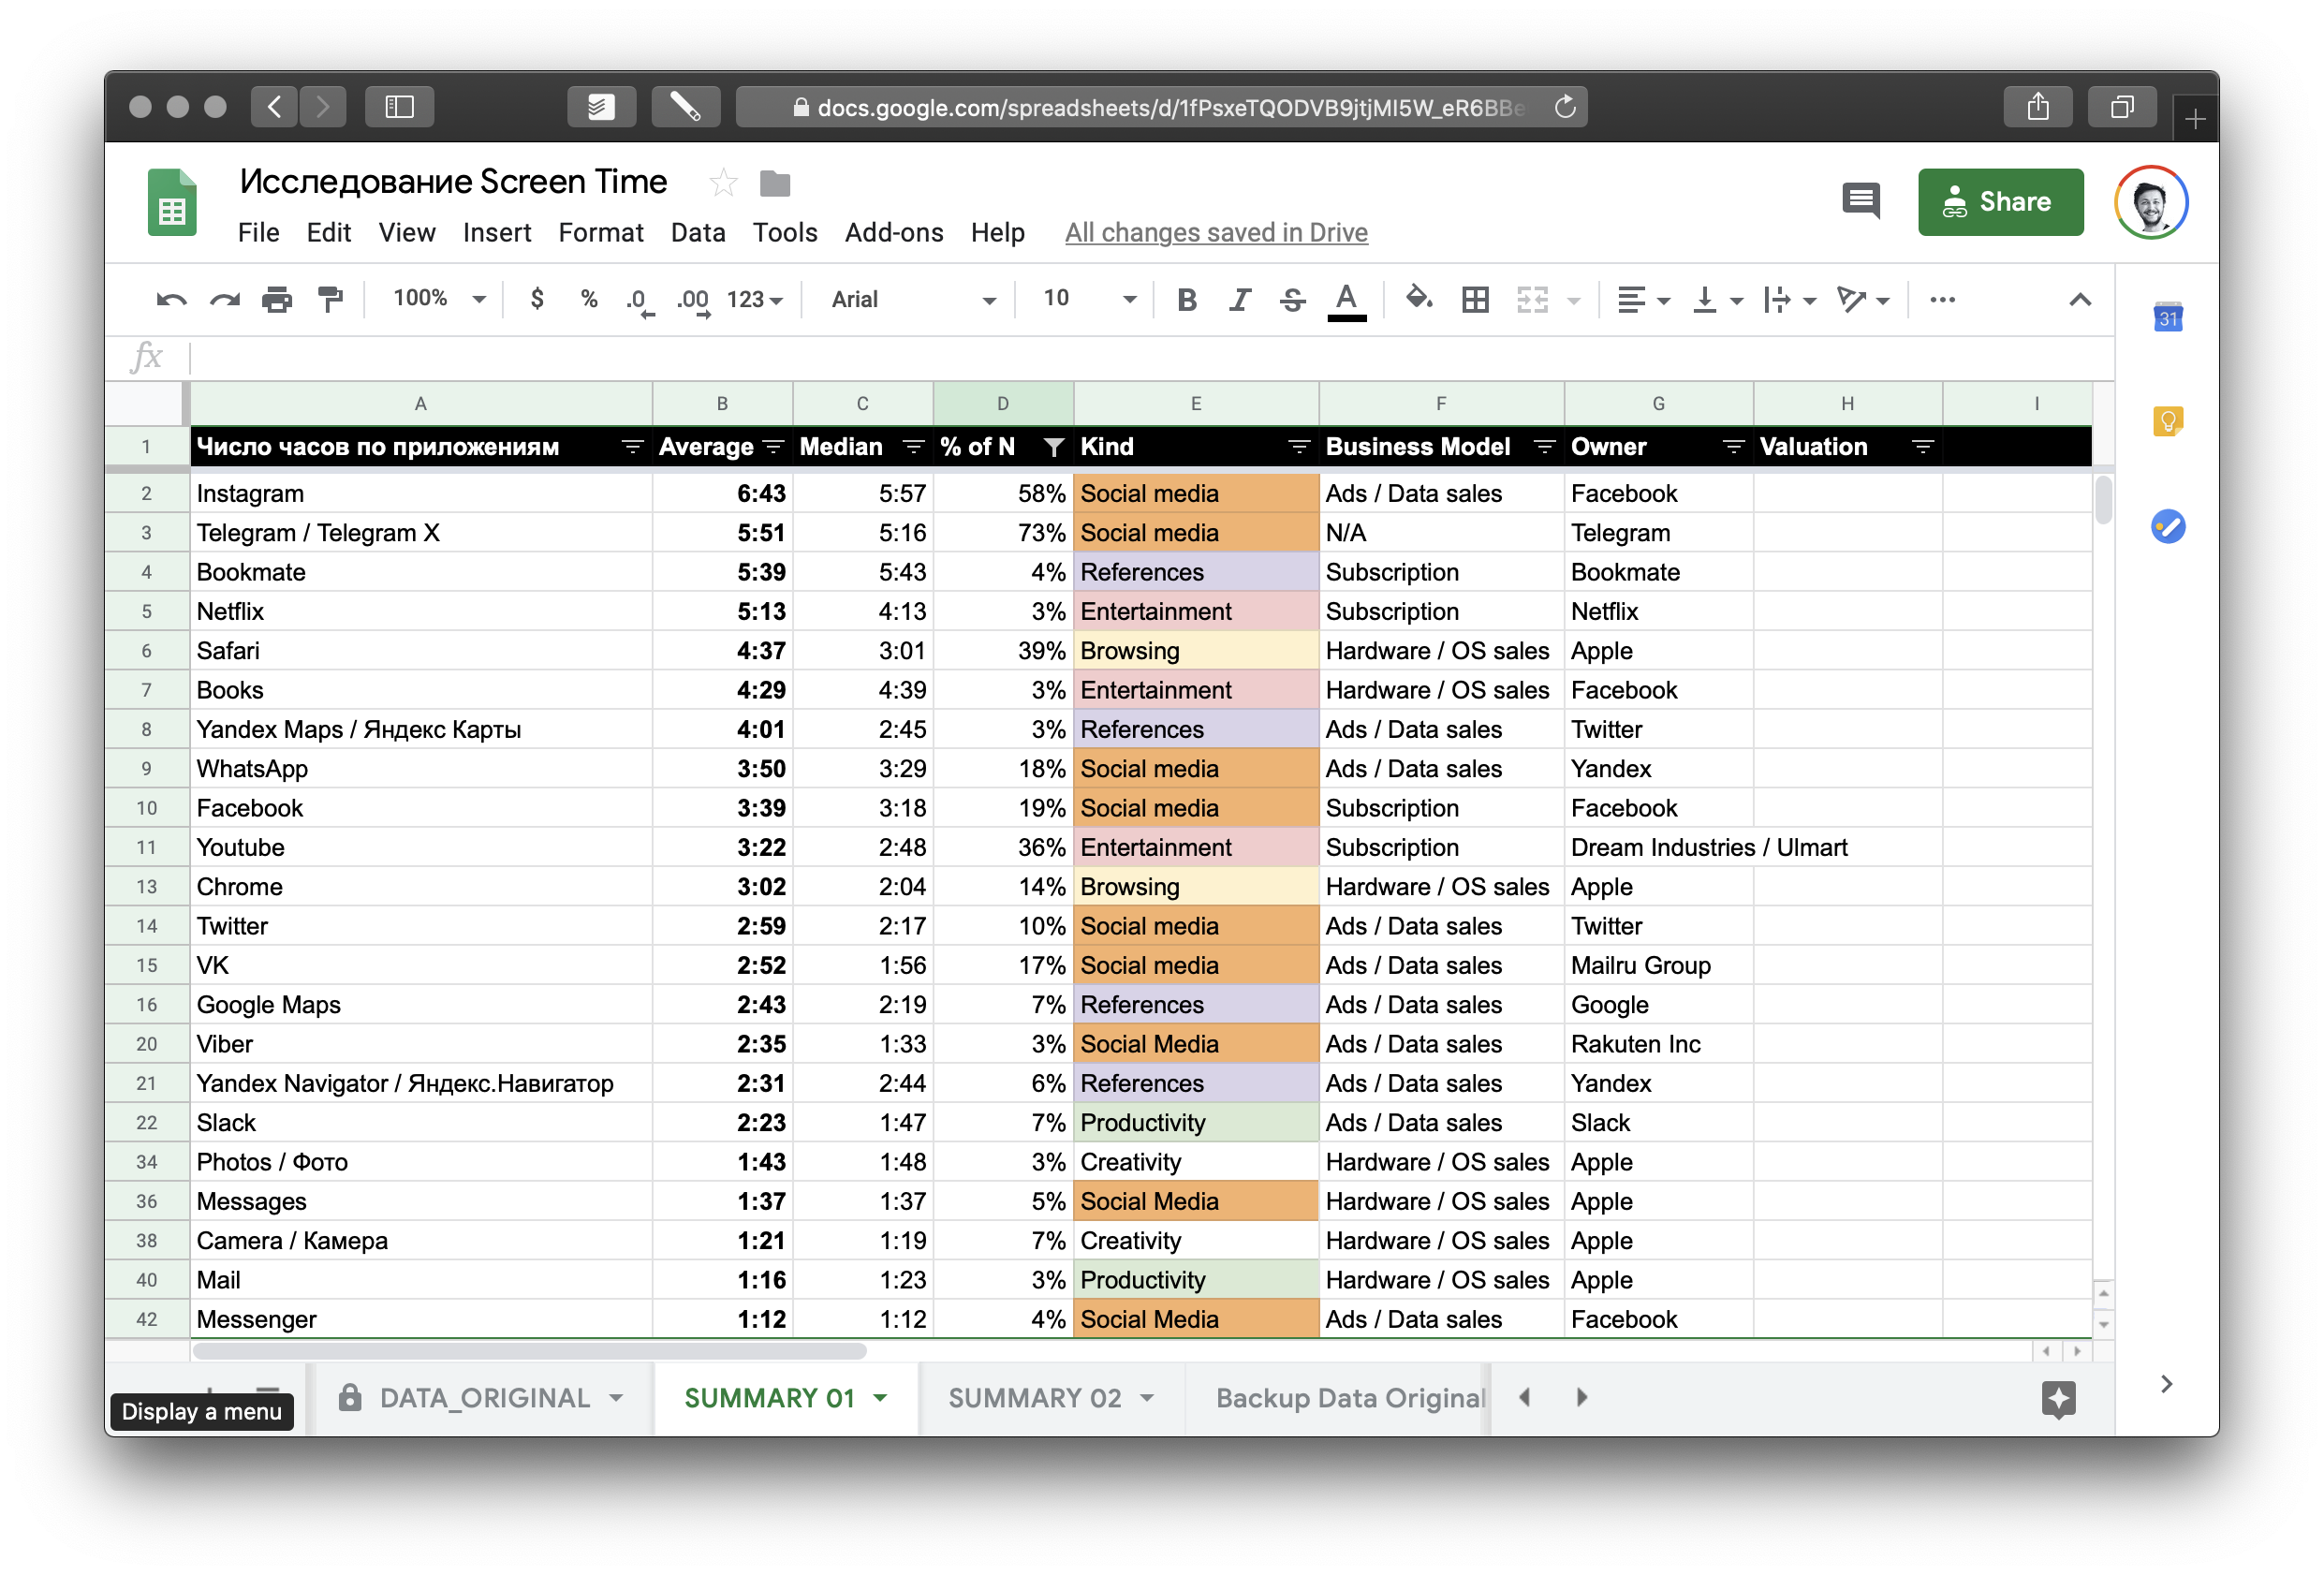
2. Short and long top screen time apps
Depending on how widely the application is presented among all the screens sent to us, different tops can be made. Let's focus on two: Top 13 with> 5% presence and Top 24 with> 2% presence in the top 5 of all screens. Time in the format X: XX means X hours XX minutes.
2.1 A short top in screen time (provided that each application appears on> 5% of sent screens).
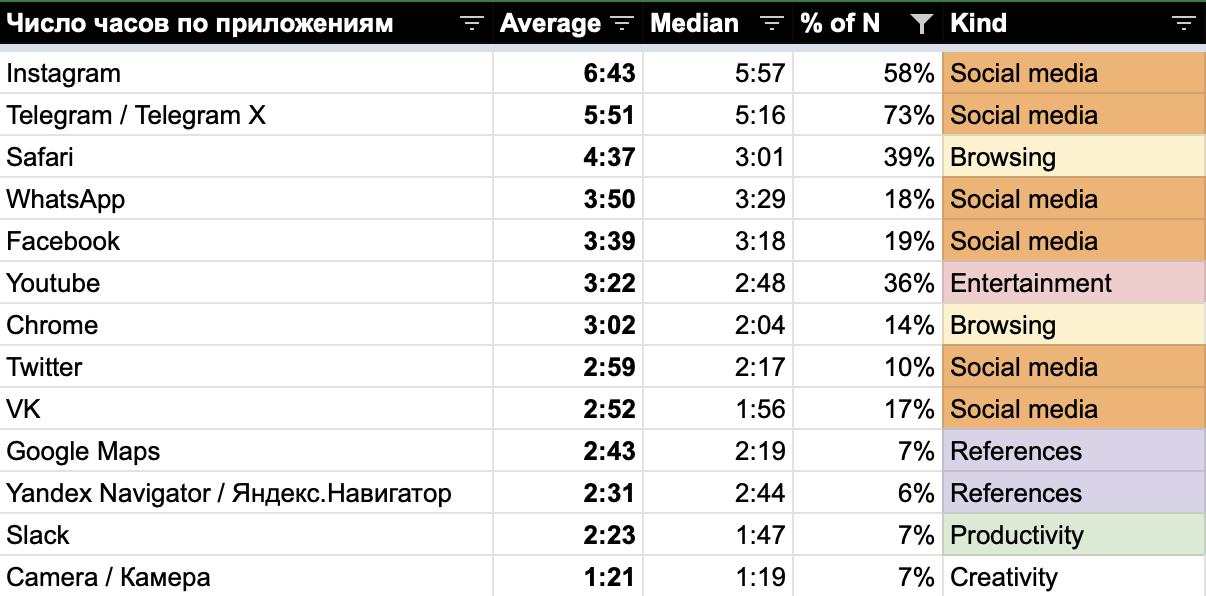
2.2 Long top in screen time (provided that each application appears on> 2% of sent screens)

Observations
- Social networks are still at the top. Half of the most popular applications (in the first chart with a threshold of ≧ 5%) are social media.
- If we discard navigators and maps (due to the driving usability case, alas, they should be constantly on the screen) and utilitarian applications such as cameras and photos, then almost all screen time in top applications falls on social networks and entertainment.
- Although many people work on WhatsApp and Telegram (the category of “social networks”: that is, it is difficult to calculate what goes to work and what is friends), the important Productivity category (applications only for work) is represented by only two apps - Slack and mail. The most interesting thing is that Slack is essentially the first social network to work, using all the attention grabbing mechanics. Firstly, we see how the mail is dying as a species, and secondly, we are happy for the success of the slack team.
- It is unclear what is happening there in browsers, but there is a hypothesis that there is also a lot of social interaction - in addition to viewing sites of different contents. By the way, Apple doesn’t miss some applications in the App Store - therefore, such products, especially dopamine-squeezing ones, will be used in the browser.
- There are no news apps on the list. All important news = social networks. It is not surprising that there is so much pressure from the authorities on Facebook and Twitter.
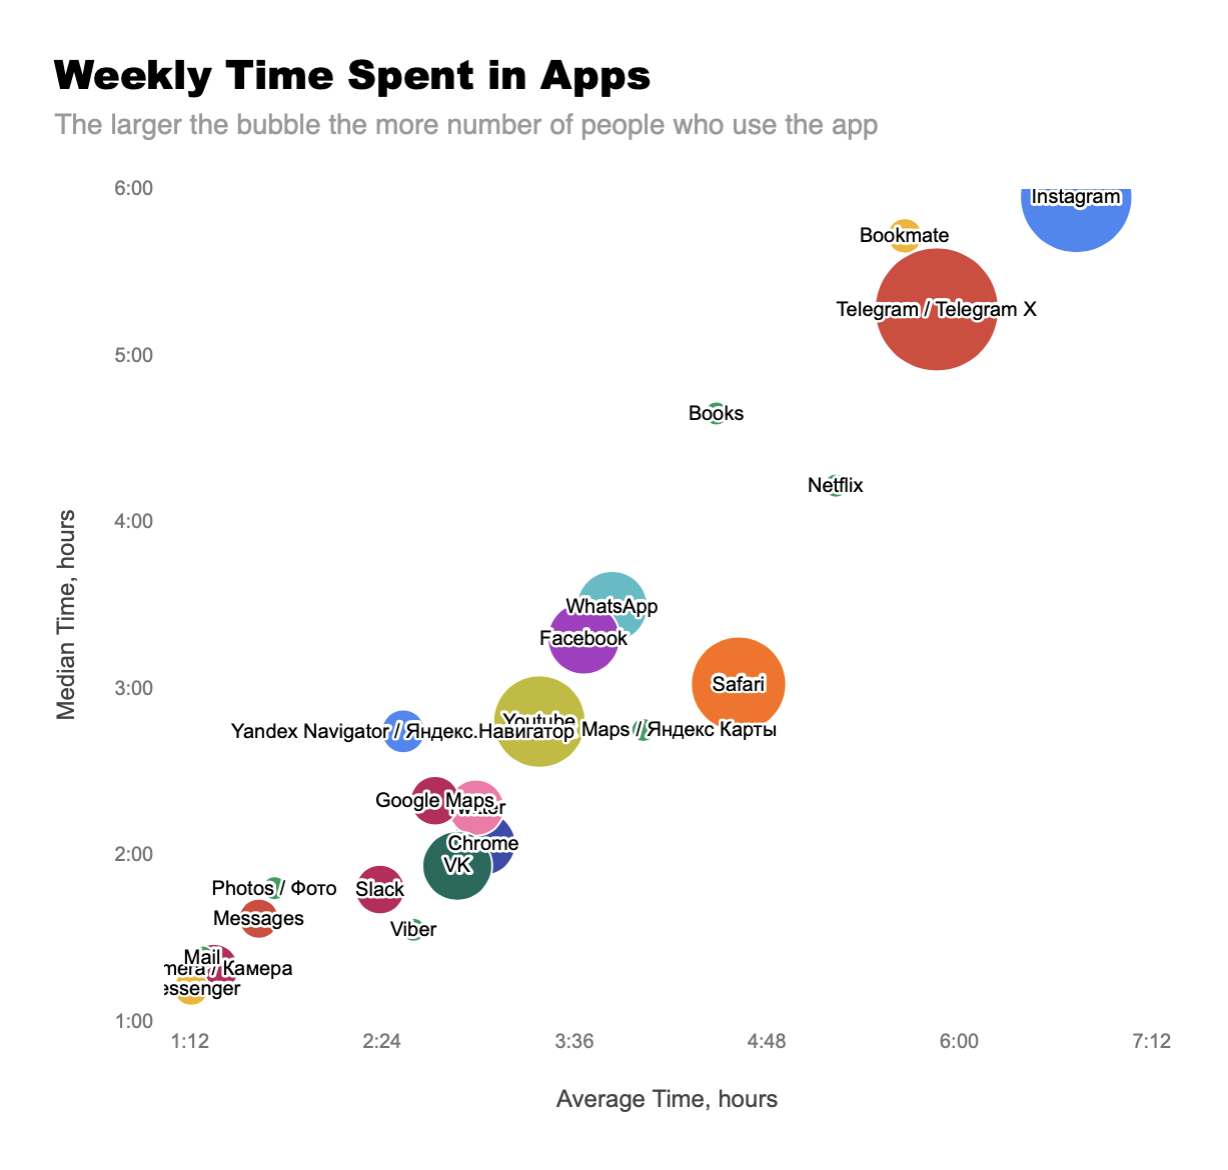
4. Is it possible in the form of a picture?
Yes, look at the colored balls below.
On the X and Y axes - the average and median in h: mm per week (they are not equal but in general all the Pts are close - therefore the circles almost form a line of 45 °). The size of the circle is how often it is found among the top 5 screens of respondents. The higher the circle, the more it takes attention and time. The larger the circle, the more popular it is among readers.
4.1. For a short top (> 5%)
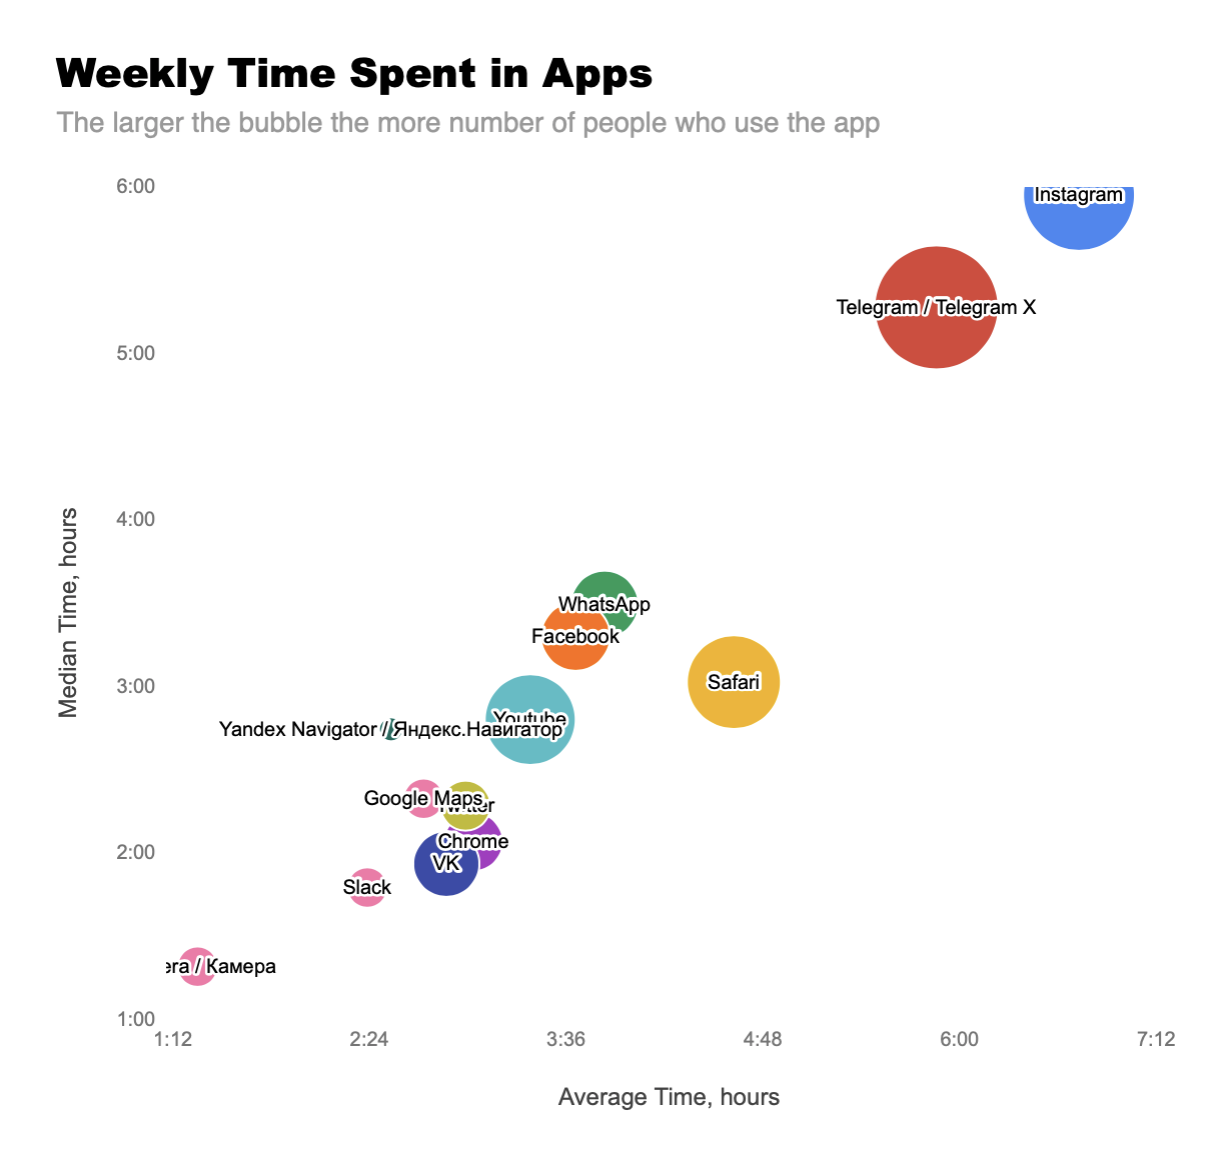
The more krzhok, the more often it is found in the sent screens. The closer to the upper right corner, the more on average it consumes time / attention per week.
4.2. For a long top (> 2%)
The situation has not changed much, just added a little more niche (for the Russian market / Russian-speaking consumer) products
* Let me remind you that there is a clear bias in the study in the direction of Telegram - it was through it that readers found a post in my channel and, I suspect, use it quite a lot.
5. Top 3 business models and top 3 company-owners of applications for screen time coverage
Another interesting thing: if you add to each application its main business model and the owner company, you can estimate how much everything in the attention market is consolidated.

It turns out the following distribution:
- 50% - advertising and collection and sale of data;
- 16.7% - subscription;
- 25% - sale of iron and goods.
Which 3 companies own almost all applications from the top of screen time is obvious:
- Apple (31.8%);
- Facebook (18.2%);
- Google (9.1%).
There is still Yandex (9.1%), but it is essentially represented in screen time by its maps and navigators. Actually, cool: it seems this is now the strongest Yandex offer on mobile devices, at least on iPhones.
Netflix and Telegram are also great, not for sale and competing - one with Amazon (and soon Apple), the other with Facebook. Pavel Durov, by the way, still has not come up with validated monetization for Telegram, I want to see how the site will develop further.
Clear bias about Apple are those phones from which almost all screenshots were taken. I am sure that in the world of Android owners, the distribution will be towards Google.

Go, Pasha, go!
Main conclusions
I’ll duplicate them one more time, from the very beginning of the article.
- Social networks eat almost half of all screen time (on average 47%, and from a third to two thirds in most cases).
- Instagram is the most dopamine-squeezing app to date. Average use: almost 7 hours a week. IG is in the top 5 applications for use by 58% of respondents.
- The business model of most popular applications by time of use is the advertising, collection and sale of your data. They account for half of all the top applications for collecting attention.
- The three companies that own most of the major screen-time applications are naturally Facebook, Apple, Google.
- Yandex competes on-screen time with Google, Facebook, Apple, it seems, only through its maps (at least on the iPhone; maybe even search, but we don’t know which search engine is in browsers by default; there may be a struggle between Google and Yandex) .
- Productivity apps are sparse on charts. I suspect that the main work is gradually flowing into instant messengers or is done separately from the phone on the computer.
- For most readers, casual games practically do not take up screen time. It seems everyone has played enough.
- My main advice is this: protect your attention and time from tech companies that use involving mechanics with social pressure and earn money from advertising, collecting and selling user data. Now there are no regulations on this subject, but at the same time, the field of engaging and habitually forming mechanics is not only science, but also daily practice. Only you yourself can adjust your time and attention in such a way as to maximize the pleasure of living and communicating with real people.
What to do?
My name is Alexey Ivanov, I’m a designer at an AI startup in San Francisco and a specialist in behavioral change. For the last two years I have been running the ponchiknews channel in Telegram, where I publish essays, talk about behavioral changes and record podcasts - in order to learn how to live such a long happy life that only we ourselves can create for each of us. Three things you can do right now:
- Read my previous posts about attention hygiene on Habré.
- Read other posts in the tg channel.
- Read the materials on the Time Well Spent website - this is an NGO that drowns for more reasonable attention management in the technological world.
Hold on!
All Articles