Reliable stress test taking into account unforeseen nuances
We thought about building the infrastructure of large load tests a year ago, when we reached the mark of 12K online users working in our service at the same time. For 3 months we made the first version of the test, which showed the limits of the service.
The irony of fate is that at the same time as the test was launched, we reached the limits on the prod, as a result of which the service fell by 2 hours. This additionally encouraged us to start moving from conducting tests from case to case to creating an effective load-bearing infrastructure. By infrastructure I mean all the tools for working with the load: tools for launching and autostart, a cluster for loading the load, a cluster, a similar product, services for collecting metrics and for preparing reports, code for managing all this and services for scaling.
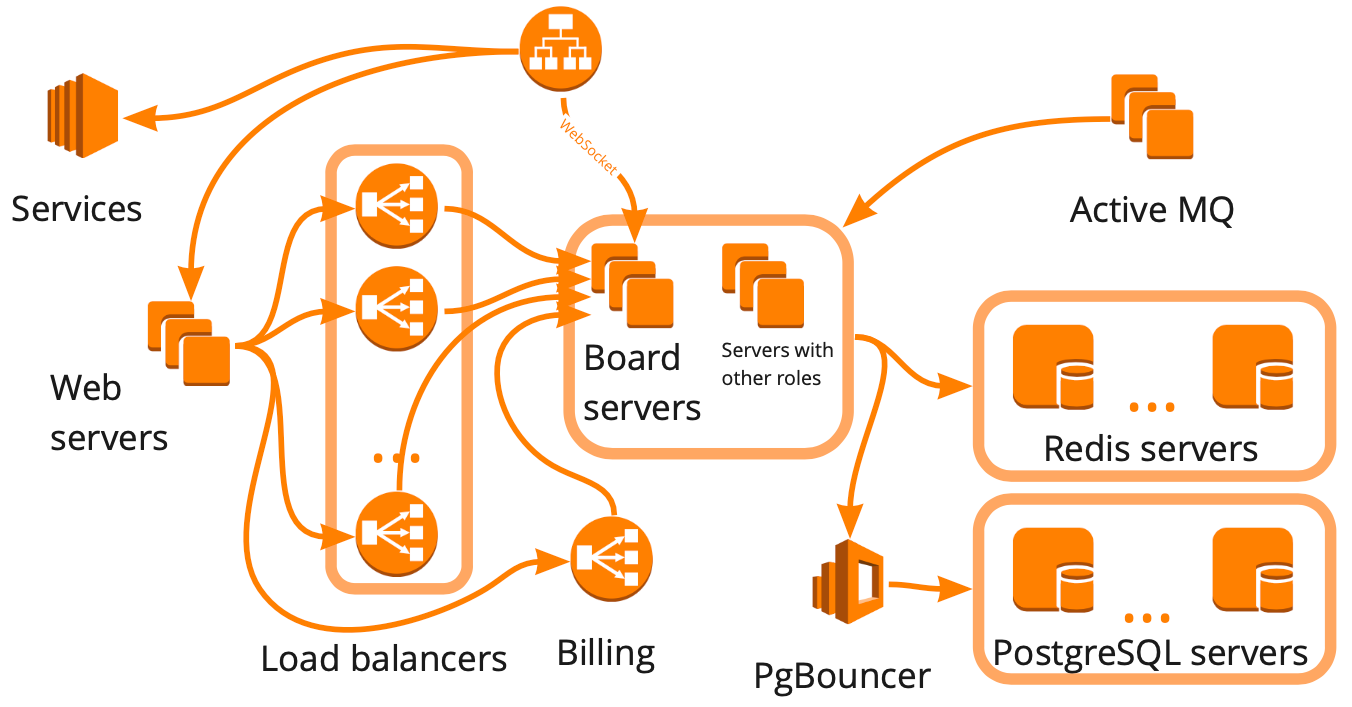
This is how simplified the miro.com scheme looks: a lot of different servers that somehow interact with each other, while each performs specific tasks. It seems that to build the infrastructure of load tests, it was enough for us to draw such a scheme, take into account all the relationships and begin to cover each block sequentially with scripts. This approach is good, but it would take many months, which was not suitable for us due to rapid growth - over the past six months we have grown from 12K to 20K online users working in the service at the same time. In addition, we did not know how the infrastructure of our service will respond to an increase in load: which of the blocks will become a bottleneck, and which we will be able to scale linearly.
As a result, we decided to test the service with the help of virtual users, simulating their realistic work, that is, build a production clone and do a big test, which:
The only minus of such a test is its cost price, because for it we need an environment that will be larger than the production environment.
I’ll tell you about creating a realistic scenario, plug-ins - WS, Stress-client, Taurus, - a load delivery cluster, a sales cluster and show examples of using tests.
To create a realistic scenario, we need:
Now more about each item.
Analysis of user work on prod
In our service, users can create boards and work on them with different content: photos, texts, mocapas, stickers, diagrams, etc. The first metric we need to collect is the number of boards and the distribution of content on them.
On the same board at the same moment in time, some users can actively do something - create, delete, edit - and some simply view the created material. This is also an important metric - the ratio of the number of users changing the content on the board to the total number of users of one board. This we can get on the basis of statistics on working with the database.
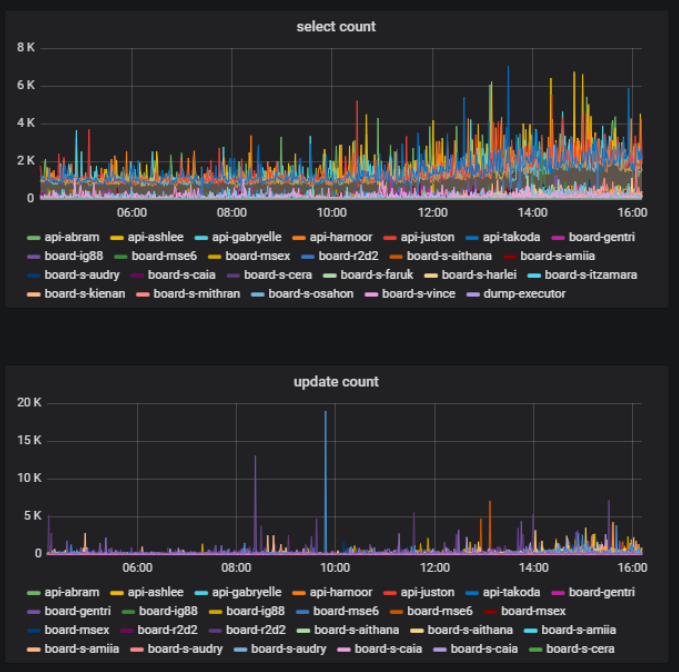
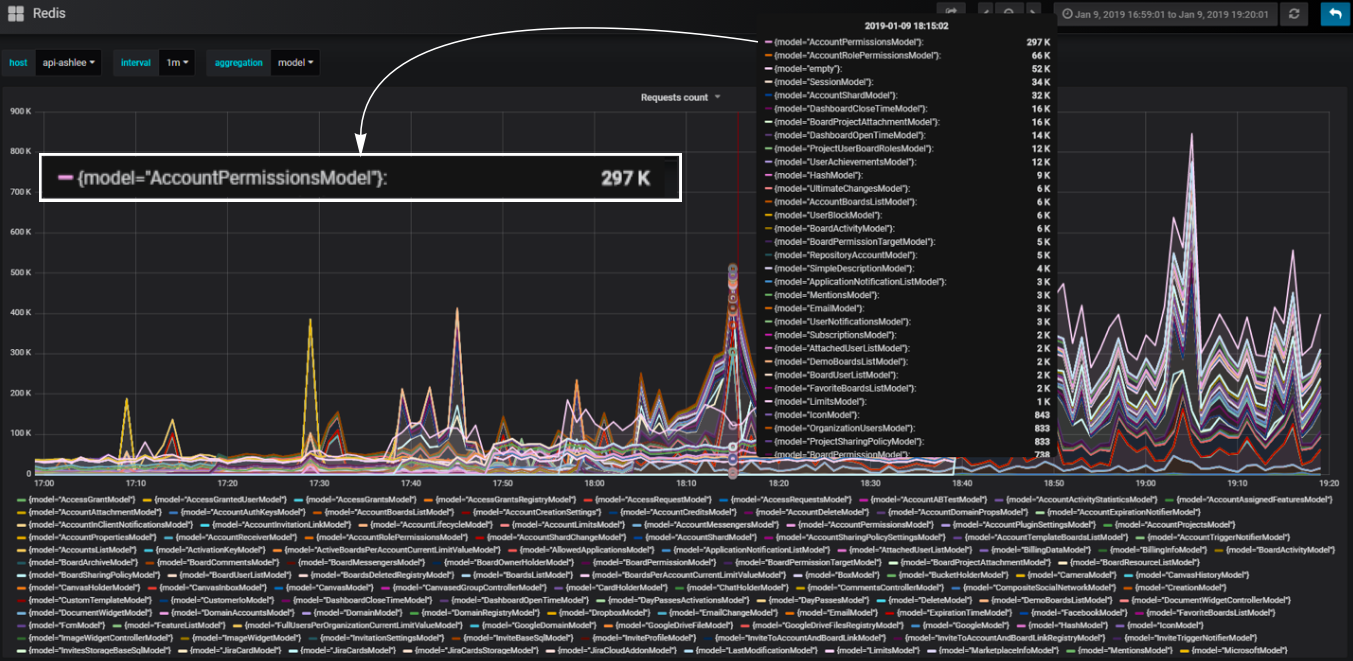
In our backend we use the component approach. Components we call models. We break our code into models so that a certain model is responsible for each part of the business logic. We can calculate the number of database calls that occur through each model and understand which part of the logic loads the database the most.
Convenient custom blocks
For example, we need to add a block to the script that loads our service identically to how it happens when you open a dashboard page with a list of user boards. During the loading of this page, http-requests with a large set of data are sent: the number of boards, the accounts that the user has access to, all users of the account, and so on.

How to load a dashboard effectively? When analyzing production behavior, we saw load spikes in the database during the opening of the dashboard of a large account. We can recreate an identical account and change the intensity of the use of its data in the script, effectively loading the dashboard with a small number of hits. We can also create an uneven load for greater realism.
At the same time, it is important for us that the number of virtual users and the load created by them are as similar as possible to users and the load on production. To do this, we also recreate in the test the background load on the average dashboard. Thus, most virtual users work on small average dashboards, and only a few users create a disastrous load, as happens in production.
Initially, we did not want to cover each server role and each relationship with a separate script. This can be seen in the example with the dashboard - we simply repeat during the test what happens when the dashboard is opened on the prod when the user opens it, and we do not cover what it affects with synthetic scripts. This allows you to by default test nuances that we did not even anticipate. Thus, we are approaching the creation of an infrastructure test from the side of business logic.
We used this logic to efficiently load all other blocks of the service. At the same time, each individual block from the point of view of the logic of using the functional may not be realistic; it is important that it gives a realistic metric load on the servers. And then we can create a script from these blocks that imitates the real work of users.

It is worth considering that data is also part of the script, and the logic of the code itself is very dependent on the data. When building a large database for the test - and it obviously should be large for a large infrastructure test - we need to learn how to create data that will not give a roll during the execution of the script. If you dump junk data, the script may turn out to be unrealistic, and a large database will be difficult to fix. Therefore, we started using the Rest API to create data in the same way as our users do.
For example, to create boards with the available data, we execute API requests to load boards from the backup. As a result, we get honest real data - different boards of different sizes. At the same time, the database is being filled quite quickly due to the fact that we are pulling requests in the script multithreaded. In speed, this is comparable to the generation of garbage data.
Scheme of tools for feeding the load:
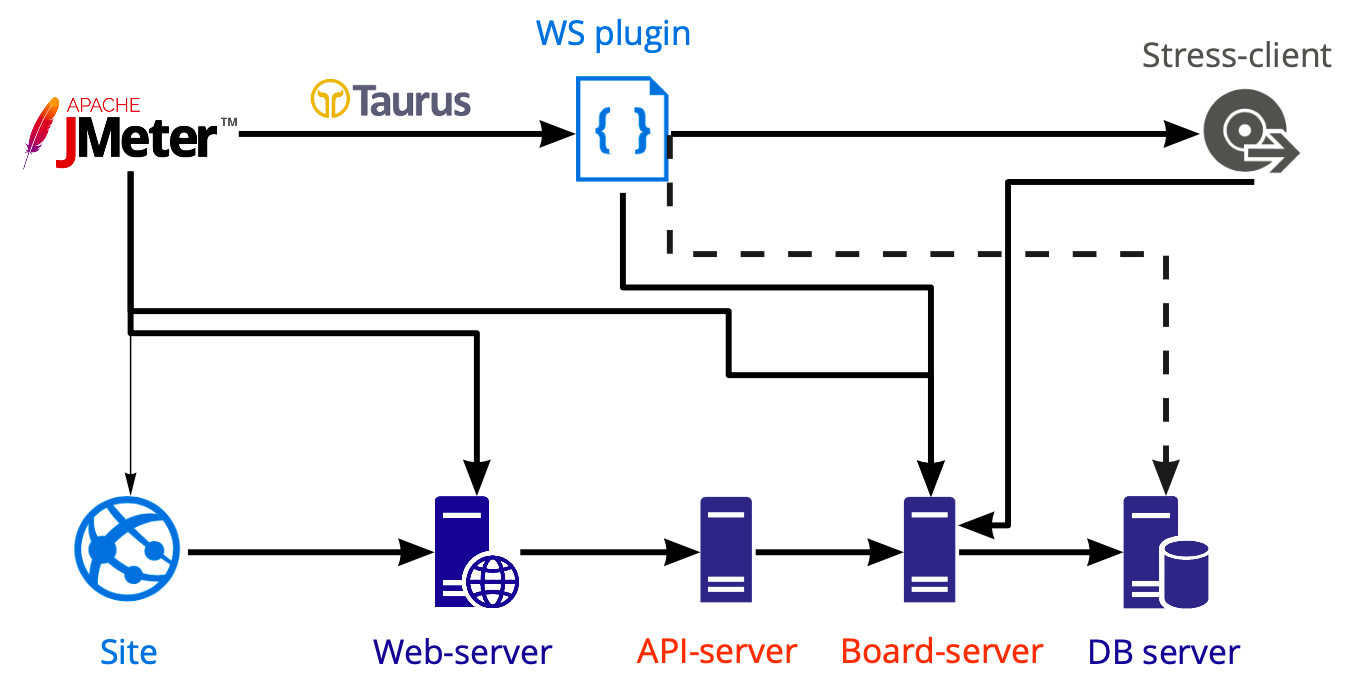
In Jmeter, we create a script that we launch using Taurus and load various servers with it: web, api, board servers. We perform database tests separately using Postgresql, not Jmeter, so the dashed line is shown in the diagram.
Work on the board occurs inside the WS-connection, and it is on the board that multi-user work is possible. Now in the Jmeter box inside the plug-in manager there are several plug-ins for working with the web socket. The logic is the same everywhere - plugins simply open a web socket connection, but all the actions that occur inside, in any case, you need to write yourself. Why? Because we can’t work the same way as with http-requests, that is, we can’t write a script, pull out dynamic values with extractors and skip them further.
The work inside the web socket is usually very custom: you invoke certain methods with certain data custom and, accordingly, you yourself need to understand whether the request was executed correctly and how long it took to execute. The Listener inside this plugin is also written independently; we did not find a good ready-made solution.
We want to as simple as possible repeat what real users do. But we do not know how to record and play back what is happening in the browser inside WS. If we write everything inside WS from scratch, then we will get a new client, and not the one that real users use. I don’t feel like writing a new client if we already have a working one.
Therefore, we decided to place our client inside Jmeter. And faced with a number of difficulties. For example, running js inside Jmeter is a separate story, as This is an absolutely specific version of the supported features. And if you want to use your existing client code, you most likely will not succeed, because new-fangled constructions cannot be launched here, they will have to be rewritten.
The second difficulty is that we do not want to support the entire client code for load tests. Therefore, we removed everything superfluous from the client and left only client-server interaction. This allowed us to use client-server methods and do everything that our client can do. The plus is that client-server interaction changes extremely rarely, which means that support for code inside the script is rarely required. For example, over the past six months, I have never made any changes to the code, because it works great.
The third difficulty - the appearance of large scripts significantly complicates the script. Firstly, it can become a bottleneck in the test. Secondly, we most likely will not be able to start a large number of threads from one machine. Now we can only launch 730 threads.
Our Amazon Instance Example
Next, the question arises: 730 threads from one machine, and we want 50K. Where to raise so many servers? We are creating a cloud solution, so buying servers for testing a cloud solution seems strange. Plus, it is always a certain slowness in the process of buying new iron. Therefore, we need to raise them also in the cloud, so we ultimately choose between cloud providers and cloud load tools.
We did not use cloud load tools like Blazemeter and RedLine13, because they have usage restrictions that did not suit us. We have different test sites, so we wanted to find a universal solution that would allow 90% of developments to be used, including in local tests.
As a result, we chose between cloud providers.
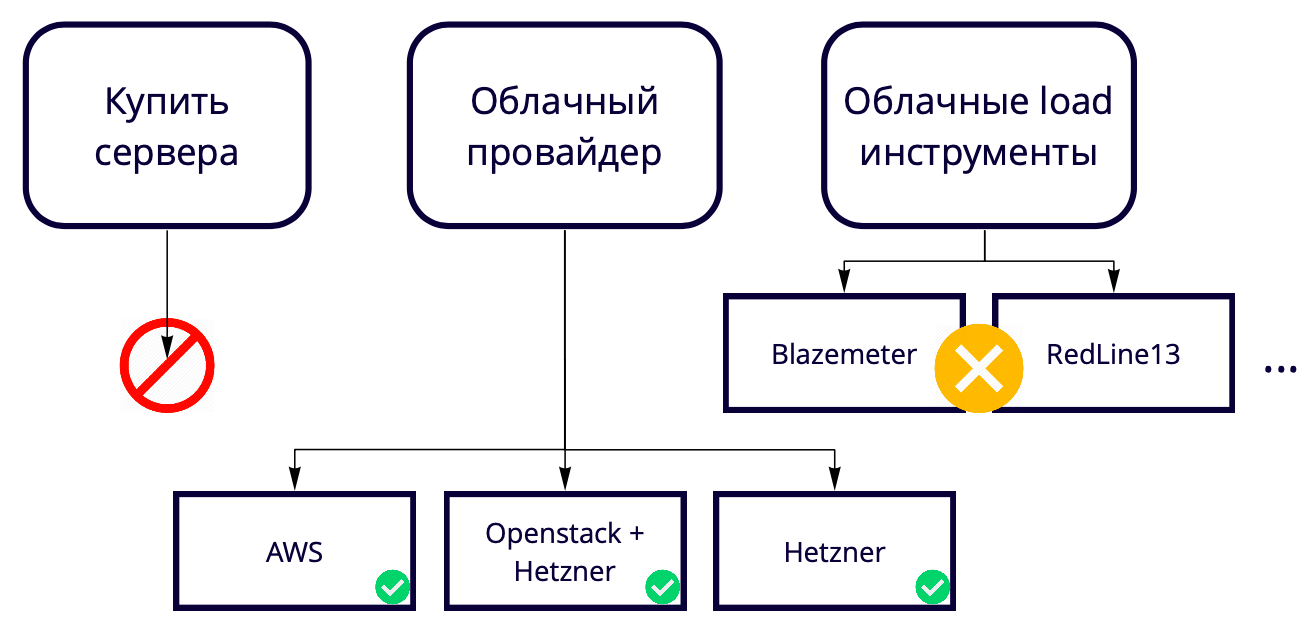
Our production is on AWS, so we are testing mainly there, and we want the test bench to be as similar as possible to the production stand. Amazon has many paid features, some of which we use in the product, for example, balancers. If these features are not needed in AWS, then you can use them 17 times cheaper in Hetzner. Or you can keep the server in Hetzner, use Openstack and write balancers and other features yourself, since using Openstack you can repeat the entire infrastructure. We have succeeded.
Testing 50K users with 69 instances in AWS costs us approximately $ 3K per month. How to save? For example, AWS has temporary instances - spot instances. Their coolness is that we do not store them constantly, we only raise them for the duration of the tests and they cost much cheaper. The nuance is that someone else can buy them at a higher price right at the time of our test. Fortunately, this has never happened before, but we already save at least 60% of the cost at their expense.
We use the Jmeter box cluster. It works great, it does not need to be modified in any way. It has several launch options. We use the simplest one, when one wizard starts N instances, and there may be hundreds of them.
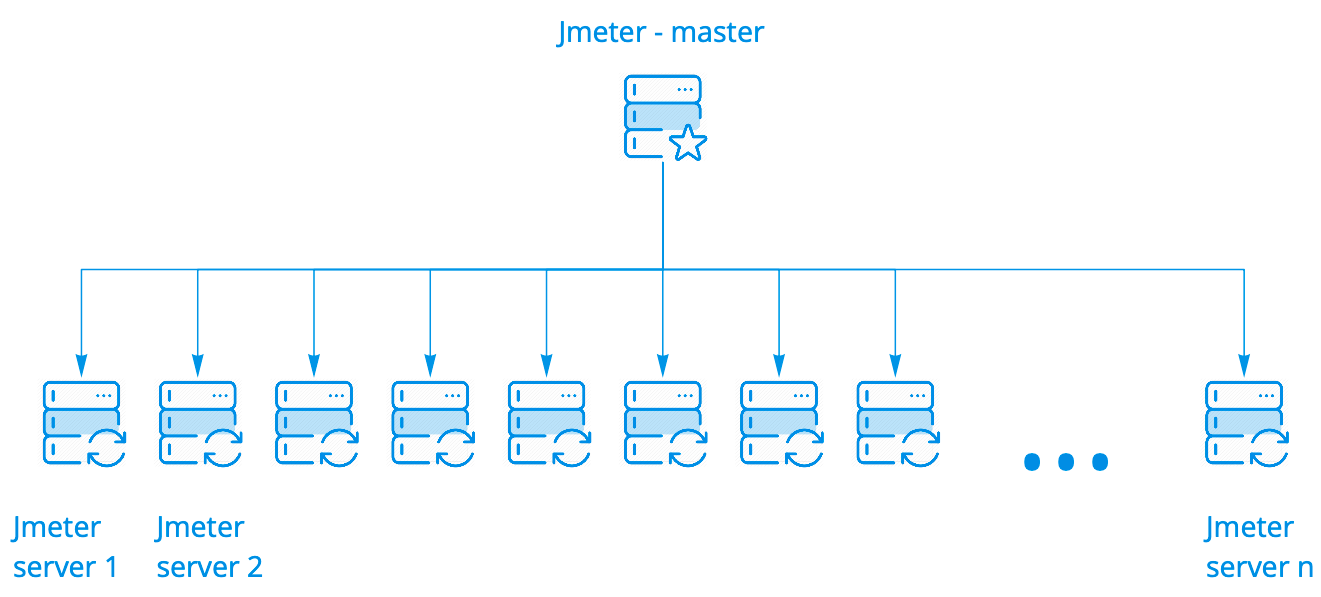
The wizard runs the script on Jmeter servers, while keeping in touch with them, collects general statistics from all instances in real time and displays it in the console. All this looks exactly the same as running the script on one server, although we see the results of the launch on a hundred servers.
For a detailed analysis of the results of script execution on all instances, we use Kibana. Parsim logs using Filebeat.

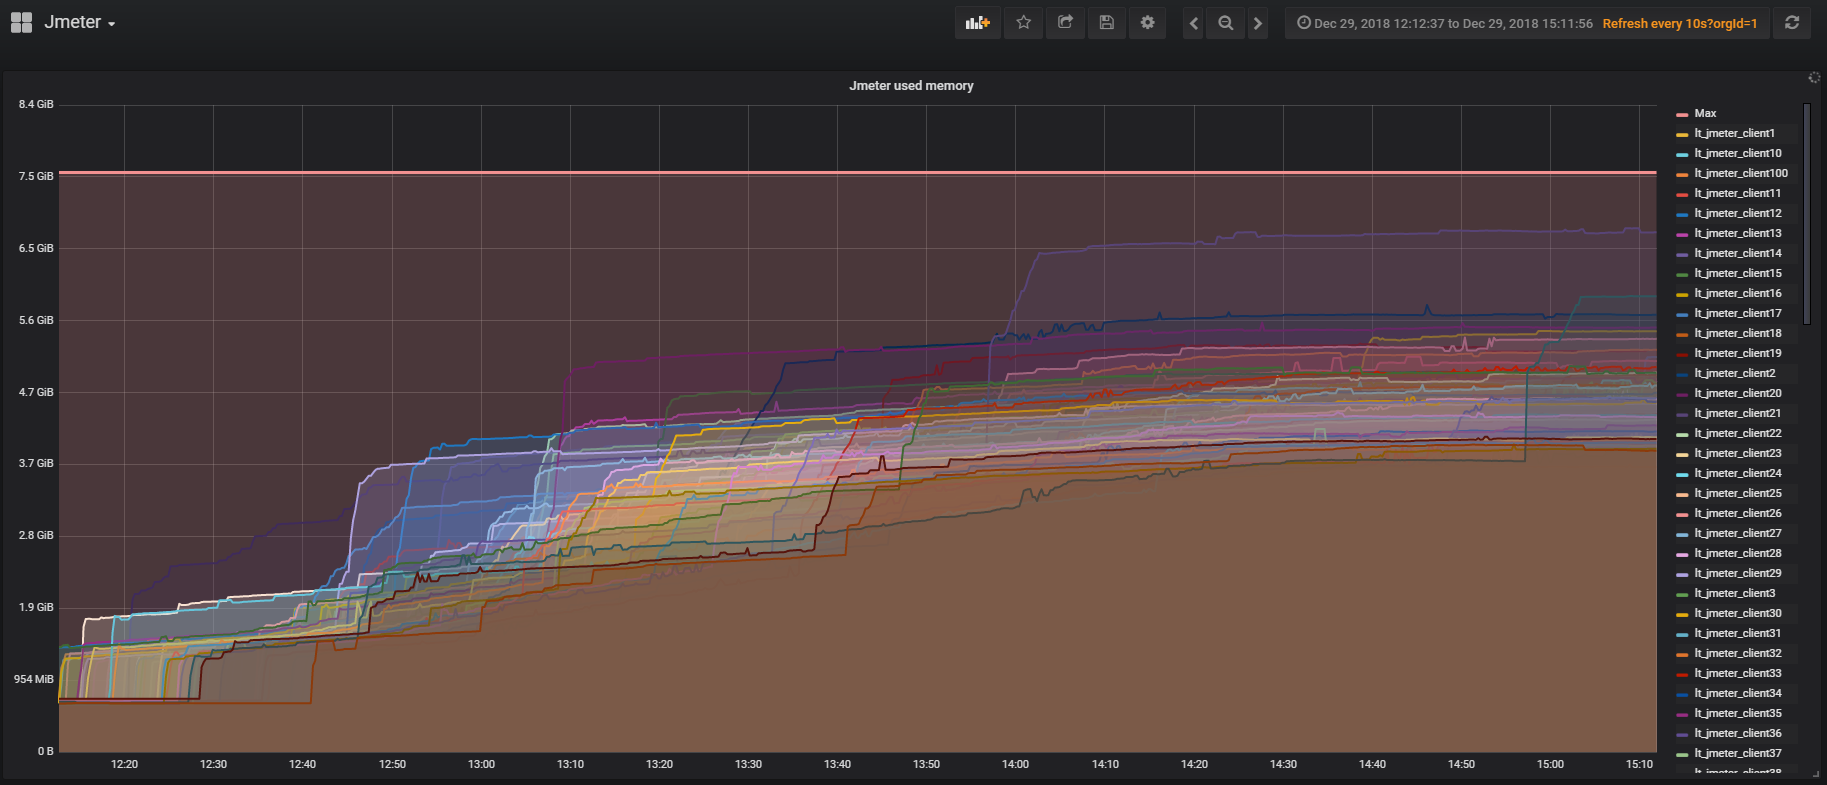
Jmeter has a plugin for working with Prometheus , which out of the box gives all the statistics on the use of JVM and threads inside the test. This allows you to see how often users log in, log out, and so on. The plugin can be customized to send data on the script to Prometheus and see them in real time in Grafana.
We want to solve a number of current problems with Taurus, but have not yet dealt with it:
The whole story above is largely about creating a realistic scenario for a service limit test. The examples below show how you can reuse the infrastructure of load tests to solve local problems. I will talk in detail about two tests, but in general we periodically conduct about 10 types of load tests.
What can we load test in the database? Heavy queries are unlikely, because we can test them in single-threaded mode, if we just look at the query plans.
An interesting situation is when we run the test and see the load on the disk. The graph shows how iowait rises.
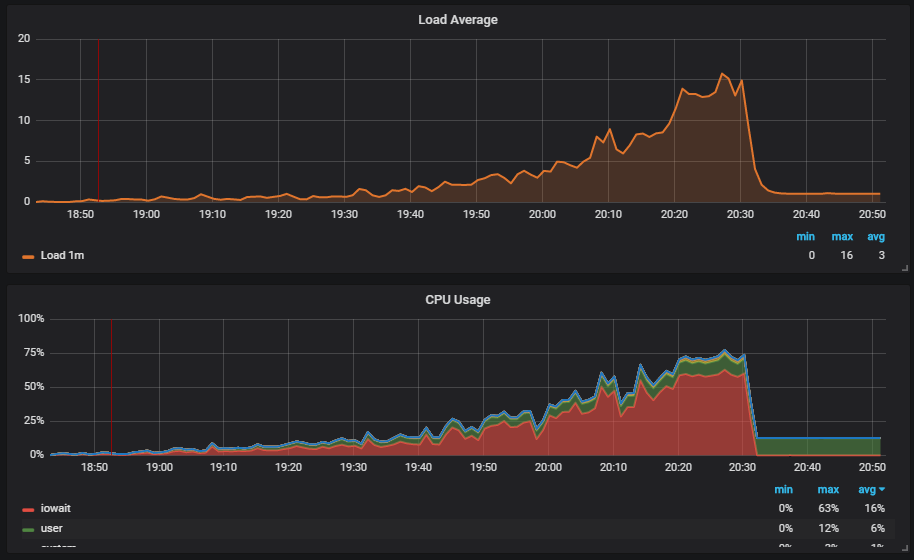
Further we see that this affects users.
We understand the reason: Vacuum did not work and did not delete garbage data from the database. If you haven’t worked with Postgresql, then Vacuum is just like the Garbage collector in Java.

Further we see that Checkpoint began to work out of schedule. For us, this is a signal that Postgresql configs do not correspond to the intensity of work with the database.
Our task is to properly configure the database so that such situations do not recur. The same Postgresql has many settings. For fine tuning, you need work in short iterations: corrected the config, launched, checked, corrected the config, launched, checked. Of course, for this you need to apply a good load to the base, but for this you just need big infrastructure tests.
The peculiarity is that in order for the test to accelerate normally and not fall where it is not needed, the acceleration must be lengthy. It takes us about three hours to test, and this no longer looks like short iterations.
We are looking for a solution. We find one of the Postgresql tools - Pg_replay . He can multithreadedly reproduce exactly what is recorded in the logs and exactly as it happened at the time of their recording. How can we use it effectively? We collapse the database dump, then log everything that happens to the database after saving to the logs, and then we have the opportunity to deploy the dump and play everything that happened with the database multithreaded.
Where to write logs? A popular solution for recording logs is to collect them on the prod, as this gives the most realistic reproducible script. But there are a number of problems:
Our approach to big tests helps us here. We take a dump on the test environment, run a large test and write the logs of everything that happens at the time the realistic script is executed. Next we use nancy_cli to test the database:
When running nancy_cli, we can pass a small number of parameters that can be changed, for example, the intensity of the script.
In the end, we use our realistic script to create a test, and then play the test without using a large cluster. It is important to consider that for testing any sql data base the script must be uneven, otherwise the database itself will behave differently from the prod.
For degradation tests, we use our realistic scenario. The idea is that we need to ensure that the service does not work more slowly after the next release. If our developers change in the code what leads to an increase in the execution time of requests, we can compare the new values with the reference ones and signal if there is an error in the build. For reference values, we take the current values that suit us.
Controlling query execution time is useful, but we went further. We wanted to see that the response time during the work of real users after the release did not become longer. We thought that at the time of stress tests, we probably can go in and check something, but these will be only dozens of cases. It’s more efficient to run existing functional tests and see a thousand cases in the same time.

How does it work for us? There is a master who, after assembly, is deployed to a test bench. Then, functional tests are automatically run in parallel with the load tests. After we get a report in Allure about how the functional tests went under load.
In this report, for example, we see that the comparison test with the reference value has fallen.
Also in functional tests, we can measure the execution time of an operation in a browser. Or, a functional test simply does not succeed due to an increase in the time it takes to complete the operation under load, because the client will time out.
The irony of fate is that at the same time as the test was launched, we reached the limits on the prod, as a result of which the service fell by 2 hours. This additionally encouraged us to start moving from conducting tests from case to case to creating an effective load-bearing infrastructure. By infrastructure I mean all the tools for working with the load: tools for launching and autostart, a cluster for loading the load, a cluster, a similar product, services for collecting metrics and for preparing reports, code for managing all this and services for scaling.
This is how simplified the miro.com scheme looks: a lot of different servers that somehow interact with each other, while each performs specific tasks. It seems that to build the infrastructure of load tests, it was enough for us to draw such a scheme, take into account all the relationships and begin to cover each block sequentially with scripts. This approach is good, but it would take many months, which was not suitable for us due to rapid growth - over the past six months we have grown from 12K to 20K online users working in the service at the same time. In addition, we did not know how the infrastructure of our service will respond to an increase in load: which of the blocks will become a bottleneck, and which we will be able to scale linearly.
As a result, we decided to test the service with the help of virtual users, simulating their realistic work, that is, build a production clone and do a big test, which:
- load a cluster that is identical to production in structure, but ahead of it in power;
- will give us all the data to make decisions;
- will show that the entire infrastructure is able to withstand the right load;
- will be the basis for stress tests that we may need in the future.
The only minus of such a test is its cost price, because for it we need an environment that will be larger than the production environment.
I’ll tell you about creating a realistic scenario, plug-ins - WS, Stress-client, Taurus, - a load delivery cluster, a sales cluster and show examples of using tests.
Create a realistic scenario
To create a realistic scenario, we need:
- analyze the work of users on the prod, and for this, determine the metrics that are important to us, start collecting them regularly and analyze the jumps;
- make convenient custom blocks with which we can effectively load the necessary part of the business logic;
- Verify script realism with server metrics.
Now more about each item.
Analysis of user work on prod
In our service, users can create boards and work on them with different content: photos, texts, mocapas, stickers, diagrams, etc. The first metric we need to collect is the number of boards and the distribution of content on them.
On the same board at the same moment in time, some users can actively do something - create, delete, edit - and some simply view the created material. This is also an important metric - the ratio of the number of users changing the content on the board to the total number of users of one board. This we can get on the basis of statistics on working with the database.
In our backend we use the component approach. Components we call models. We break our code into models so that a certain model is responsible for each part of the business logic. We can calculate the number of database calls that occur through each model and understand which part of the logic loads the database the most.
Convenient custom blocks
For example, we need to add a block to the script that loads our service identically to how it happens when you open a dashboard page with a list of user boards. During the loading of this page, http-requests with a large set of data are sent: the number of boards, the accounts that the user has access to, all users of the account, and so on.
How to load a dashboard effectively? When analyzing production behavior, we saw load spikes in the database during the opening of the dashboard of a large account. We can recreate an identical account and change the intensity of the use of its data in the script, effectively loading the dashboard with a small number of hits. We can also create an uneven load for greater realism.
At the same time, it is important for us that the number of virtual users and the load created by them are as similar as possible to users and the load on production. To do this, we also recreate in the test the background load on the average dashboard. Thus, most virtual users work on small average dashboards, and only a few users create a disastrous load, as happens in production.
Initially, we did not want to cover each server role and each relationship with a separate script. This can be seen in the example with the dashboard - we simply repeat during the test what happens when the dashboard is opened on the prod when the user opens it, and we do not cover what it affects with synthetic scripts. This allows you to by default test nuances that we did not even anticipate. Thus, we are approaching the creation of an infrastructure test from the side of business logic.
We used this logic to efficiently load all other blocks of the service. At the same time, each individual block from the point of view of the logic of using the functional may not be realistic; it is important that it gives a realistic metric load on the servers. And then we can create a script from these blocks that imitates the real work of users.
Data is part of the script.
It is worth considering that data is also part of the script, and the logic of the code itself is very dependent on the data. When building a large database for the test - and it obviously should be large for a large infrastructure test - we need to learn how to create data that will not give a roll during the execution of the script. If you dump junk data, the script may turn out to be unrealistic, and a large database will be difficult to fix. Therefore, we started using the Rest API to create data in the same way as our users do.
For example, to create boards with the available data, we execute API requests to load boards from the backup. As a result, we get honest real data - different boards of different sizes. At the same time, the database is being filled quite quickly due to the fact that we are pulling requests in the script multithreaded. In speed, this is comparable to the generation of garbage data.
Results for this part
- Use realistic scenarios if you want to check everything at once;
- Analyze real user behavior to design your script structure;
- Immediately create convenient blocks for customization;
- Configure by real server metrics, not by usage analytics;
- Remember that data is part of the script.
Load cluster
Scheme of tools for feeding the load:
In Jmeter, we create a script that we launch using Taurus and load various servers with it: web, api, board servers. We perform database tests separately using Postgresql, not Jmeter, so the dashed line is shown in the diagram.
Custom work inside web-socket
Work on the board occurs inside the WS-connection, and it is on the board that multi-user work is possible. Now in the Jmeter box inside the plug-in manager there are several plug-ins for working with the web socket. The logic is the same everywhere - plugins simply open a web socket connection, but all the actions that occur inside, in any case, you need to write yourself. Why? Because we can’t work the same way as with http-requests, that is, we can’t write a script, pull out dynamic values with extractors and skip them further.
The work inside the web socket is usually very custom: you invoke certain methods with certain data custom and, accordingly, you yourself need to understand whether the request was executed correctly and how long it took to execute. The Listener inside this plugin is also written independently; we did not find a good ready-made solution.
Stress-client
We want to as simple as possible repeat what real users do. But we do not know how to record and play back what is happening in the browser inside WS. If we write everything inside WS from scratch, then we will get a new client, and not the one that real users use. I don’t feel like writing a new client if we already have a working one.
Therefore, we decided to place our client inside Jmeter. And faced with a number of difficulties. For example, running js inside Jmeter is a separate story, as This is an absolutely specific version of the supported features. And if you want to use your existing client code, you most likely will not succeed, because new-fangled constructions cannot be launched here, they will have to be rewritten.
The second difficulty is that we do not want to support the entire client code for load tests. Therefore, we removed everything superfluous from the client and left only client-server interaction. This allowed us to use client-server methods and do everything that our client can do. The plus is that client-server interaction changes extremely rarely, which means that support for code inside the script is rarely required. For example, over the past six months, I have never made any changes to the code, because it works great.
The third difficulty - the appearance of large scripts significantly complicates the script. Firstly, it can become a bottleneck in the test. Secondly, we most likely will not be able to start a large number of threads from one machine. Now we can only launch 730 threads.
Our Amazon Instance Example
Jmeter server AWS: m5.large ($0.06 per Hour) vCPU: 2 Mem (GiB): 8 Dedicated EBS Bandwidth (Mbps): Up to 3,500 Network Performance (Gbps): Up to 10 → ~730
Where to get hundreds of servers and how to save
Next, the question arises: 730 threads from one machine, and we want 50K. Where to raise so many servers? We are creating a cloud solution, so buying servers for testing a cloud solution seems strange. Plus, it is always a certain slowness in the process of buying new iron. Therefore, we need to raise them also in the cloud, so we ultimately choose between cloud providers and cloud load tools.
We did not use cloud load tools like Blazemeter and RedLine13, because they have usage restrictions that did not suit us. We have different test sites, so we wanted to find a universal solution that would allow 90% of developments to be used, including in local tests.
As a result, we chose between cloud providers.
Our production is on AWS, so we are testing mainly there, and we want the test bench to be as similar as possible to the production stand. Amazon has many paid features, some of which we use in the product, for example, balancers. If these features are not needed in AWS, then you can use them 17 times cheaper in Hetzner. Or you can keep the server in Hetzner, use Openstack and write balancers and other features yourself, since using Openstack you can repeat the entire infrastructure. We have succeeded.
Testing 50K users with 69 instances in AWS costs us approximately $ 3K per month. How to save? For example, AWS has temporary instances - spot instances. Their coolness is that we do not store them constantly, we only raise them for the duration of the tests and they cost much cheaper. The nuance is that someone else can buy them at a higher price right at the time of our test. Fortunately, this has never happened before, but we already save at least 60% of the cost at their expense.
Load cluster
We use the Jmeter box cluster. It works great, it does not need to be modified in any way. It has several launch options. We use the simplest one, when one wizard starts N instances, and there may be hundreds of them.
The wizard runs the script on Jmeter servers, while keeping in touch with them, collects general statistics from all instances in real time and displays it in the console. All this looks exactly the same as running the script on one server, although we see the results of the launch on a hundred servers.
For a detailed analysis of the results of script execution on all instances, we use Kibana. Parsim logs using Filebeat.
A Prometheus Listener for Apache JMeter
Jmeter has a plugin for working with Prometheus , which out of the box gives all the statistics on the use of JVM and threads inside the test. This allows you to see how often users log in, log out, and so on. The plugin can be customized to send data on the script to Prometheus and see them in real time in Grafana.
Taurus
We want to solve a number of current problems with Taurus, but have not yet dealt with it:
- Configs instead of script clones. If you tested on Jmeter, then you probably faced the need to run scripts with different sets of source parameters, for which you had to create their clones. In Taurus it is possible to have one scenario, and with the help of configurations to control the launch parameters;
- Configs for managing Jmeter-servers when working with a cluster;
- An online results analyzer that allows you to collect results separately from Jmeter threads and not burden the script itself;
- Convenient integration with CI;
- The ability to test a distributed system.
The results of this part
- If we use the code inside Jmeter, then it’s better to immediately think about its performance, because otherwise we can test Jmeter, not our product;
- The Jmeter cluster is a wonderful thing: it is easy to configure, monitoring is easily screwed to it;
- A large cluster can be kept on spot instances, it will be much cheaper;
- Be careful with listeners inside the Jmeter so that the script does not slow down the work on a large number of servers.
Examples of using infrastructure tests
The whole story above is largely about creating a realistic scenario for a service limit test. The examples below show how you can reuse the infrastructure of load tests to solve local problems. I will talk in detail about two tests, but in general we periodically conduct about 10 types of load tests.
Database testing
What can we load test in the database? Heavy queries are unlikely, because we can test them in single-threaded mode, if we just look at the query plans.
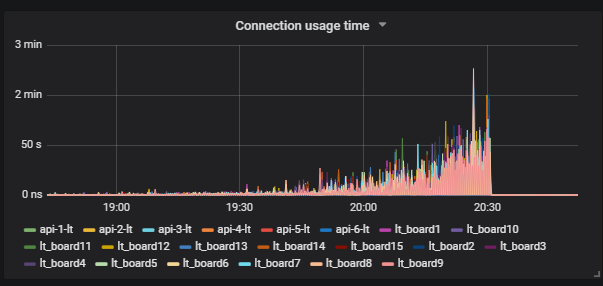
An interesting situation is when we run the test and see the load on the disk. The graph shows how iowait rises.
Further we see that this affects users.
We understand the reason: Vacuum did not work and did not delete garbage data from the database. If you haven’t worked with Postgresql, then Vacuum is just like the Garbage collector in Java.
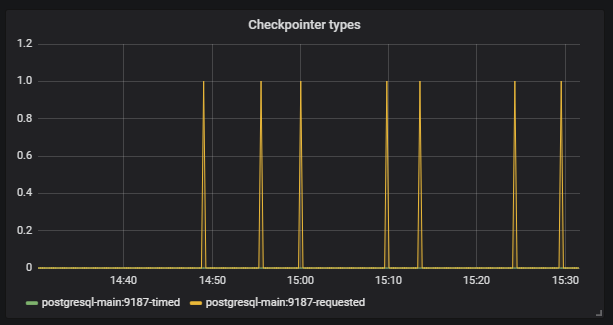
Further we see that Checkpoint began to work out of schedule. For us, this is a signal that Postgresql configs do not correspond to the intensity of work with the database.
Our task is to properly configure the database so that such situations do not recur. The same Postgresql has many settings. For fine tuning, you need work in short iterations: corrected the config, launched, checked, corrected the config, launched, checked. Of course, for this you need to apply a good load to the base, but for this you just need big infrastructure tests.
The peculiarity is that in order for the test to accelerate normally and not fall where it is not needed, the acceleration must be lengthy. It takes us about three hours to test, and this no longer looks like short iterations.
We are looking for a solution. We find one of the Postgresql tools - Pg_replay . He can multithreadedly reproduce exactly what is recorded in the logs and exactly as it happened at the time of their recording. How can we use it effectively? We collapse the database dump, then log everything that happens to the database after saving to the logs, and then we have the opportunity to deploy the dump and play everything that happened with the database multithreaded.
Where to write logs? A popular solution for recording logs is to collect them on the prod, as this gives the most realistic reproducible script. But there are a number of problems:
- For the test you need to use the sales data, which is not always possible;
- The process uses an expensive syslog operation;
- The disk is loading.
Our approach to big tests helps us here. We take a dump on the test environment, run a large test and write the logs of everything that happens at the time the realistic script is executed. Next we use nancy_cli to test the database:
- An instance is created in AWS;
- The dump we need is deployed;
- Pg_replay is launched and plays the necessary logs;
- The script generates an html report based on the pg_stat _... system tables
When running nancy_cli, we can pass a small number of parameters that can be changed, for example, the intensity of the script.
In the end, we use our realistic script to create a test, and then play the test without using a large cluster. It is important to consider that for testing any sql data base the script must be uneven, otherwise the database itself will behave differently from the prod.
Degradation monitoring
For degradation tests, we use our realistic scenario. The idea is that we need to ensure that the service does not work more slowly after the next release. If our developers change in the code what leads to an increase in the execution time of requests, we can compare the new values with the reference ones and signal if there is an error in the build. For reference values, we take the current values that suit us.
Controlling query execution time is useful, but we went further. We wanted to see that the response time during the work of real users after the release did not become longer. We thought that at the time of stress tests, we probably can go in and check something, but these will be only dozens of cases. It’s more efficient to run existing functional tests and see a thousand cases in the same time.
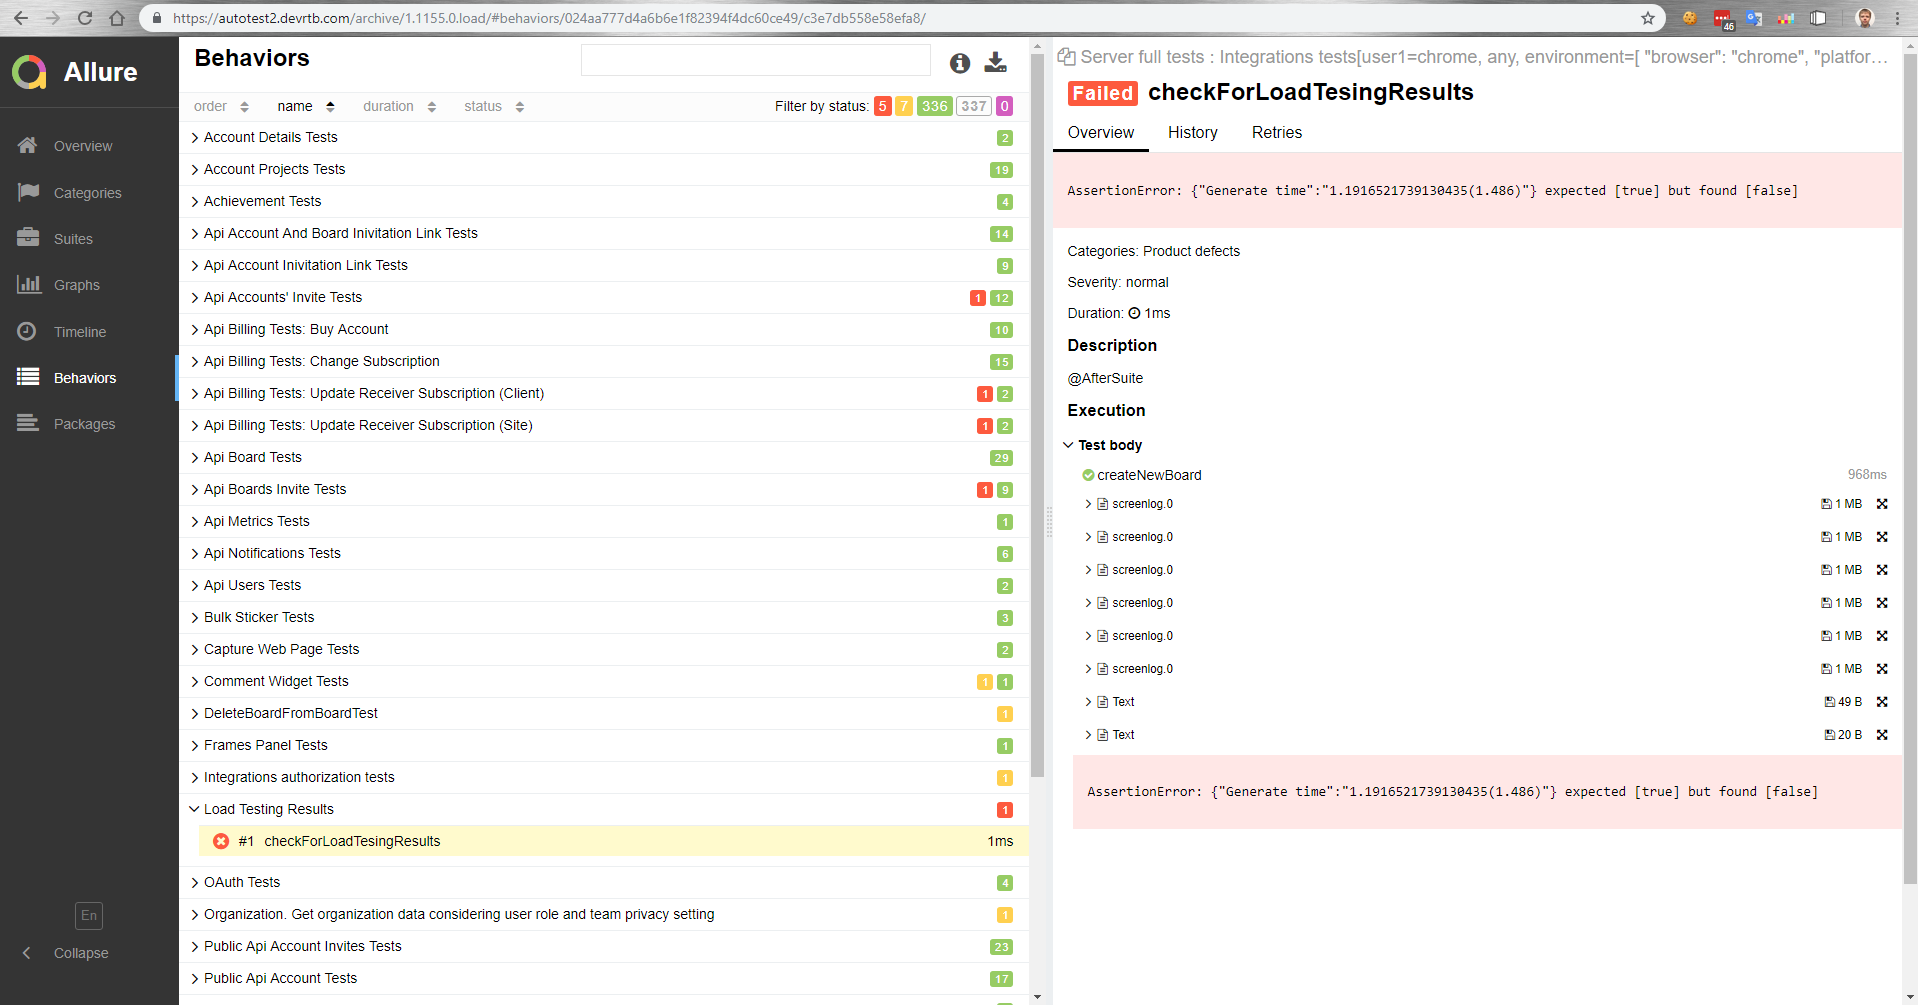
How does it work for us? There is a master who, after assembly, is deployed to a test bench. Then, functional tests are automatically run in parallel with the load tests. After we get a report in Allure about how the functional tests went under load.
In this report, for example, we see that the comparison test with the reference value has fallen.
Also in functional tests, we can measure the execution time of an operation in a browser. Or, a functional test simply does not succeed due to an increase in the time it takes to complete the operation under load, because the client will time out.
Results for this part
- A realistic test allows you to cheaply test the database and easily configure it;
- Functional testing under load is possible.
All Articles