uWSGI to help metrics. Yandex Report
The other day, Moscow Python Meetup # 66 was held - the community continues to discuss relevant tools that enhance the language and adapt it to different environments. Including at the meeting, my report was voiced. My name is Nail, I'm doing Yandex.Connect.

The story I prepared was about uWSGI. This is a multifunctional web application server, and every modern application is accompanied by metrics. I tried to show how the capabilities of uWSGI can help in collecting metrics.
- Hello everyone, I'm glad to welcome you all to the walls of Yandex. It's nice that so many people came to see my and other reports, that so many people are interested and live in Python. What is my report about? It is called "uWSGI to help metrics." I’ll tell you a little about myself. I've been doing Python for the past six years, I work in the Yandex.Connect team, we are writing a business platform that provides Yandex services developed internally for outside users, that is, for everyone. Any person or organization can use the products developed by Yandex for themselves, for their own purposes.
We’ll talk about metrics, how to get these metrics, how we use in our team uWSGI as a tool to get metrics, how it helps us. Then I’ll tell you a little optimization story.
A few words about metrics. As you know, the development of a modern application is impossible without tests. It is strange if someone develops their applications without tests. At the same time, it seems to me that the operation of a modern application is impossible without metrics. Our application is a living organism. A person can take some metrics, such as pressure, heart rate, - the application also has indicators that we are interested in and would like to observe. Unlike a person who usually takes these vital metrics when they feel bad, in the case of an application, we can always take them.

Why are we shooting metrics? By the way, who uses metrics? I hope that after my report, there will be more hands, and people will be interested and start collecting metrics, they will understand that this is necessary and useful.
So why do we need metrics? First of all, we see what is happening with the system, we highlight some normative indicators for our system and understand whether we go beyond these indicators in the process of the application or not. You can see some abnormal behavior of the system, for example, an increase in the number of errors, understand what is wrong with the system, before our users and receive messages about incidents not from users, but from the monitoring system. Based on metrics, we can set up alerts and receive sms, letters, calls, as you like.

What, as a rule, are metrics? These are some numbers, perhaps a counter that grows monotonously. For example, the number of requests. Some unit values that change in time increase or decrease. An example is the number of tasks in a queue. Or histograms - values that fall into some intervals, the so-called baskets. As a rule, it is convenient to read this time-related data and find out in which time interval how many values fit.
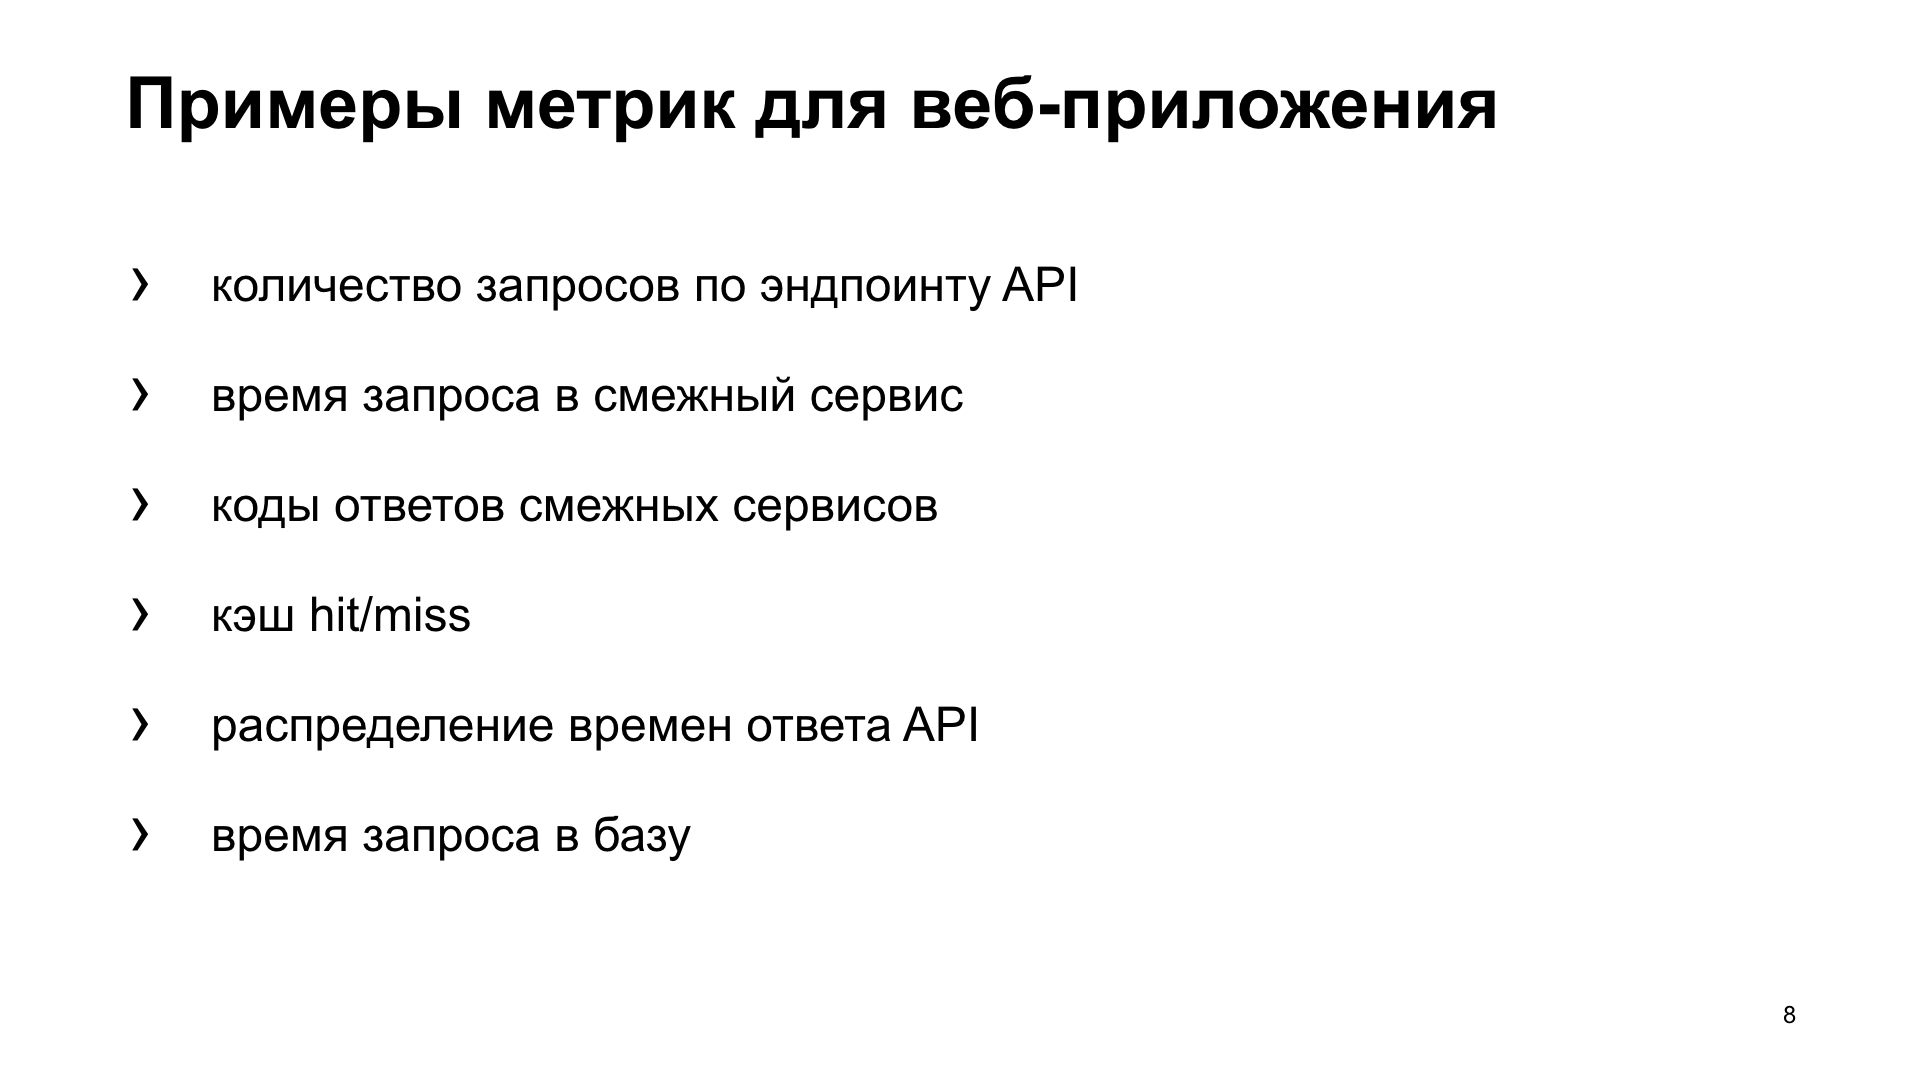
What kind of metrics can we take? I will focus on the development of web applications, as it is closer to me. For example, we can shoot the number of requests, our endpoints, the response time of our endpoints, the response codes of related services, if we go to them and we have a microservice architecture. If we use the cache, we can understand how efficient the miss or hit cache is, understand the distribution of response times of both third-party servers, and, for example, the database. But in order to see the metrics, you need to somehow collect them.

How can we collect them? There are several options. I want to tell you about the first option - a push scheme. What does it consist of?
Suppose we receive a request from a user. Locally, with our application, we install some kind, usually a push agent. Let's say we have a Docker, there is an application in it, and a push agent still stands in parallel. The push agent receives the metric value locally from us, somehow it buffers them, makes batches and sends them to the metrics storage system.
What is the advantage of using push schemes? We can send some metric directly from the application to the metric system, but at the same time we get some kind of network interaction, latency, overhead to collect metrics. In the case of a local push client, this is leveled.
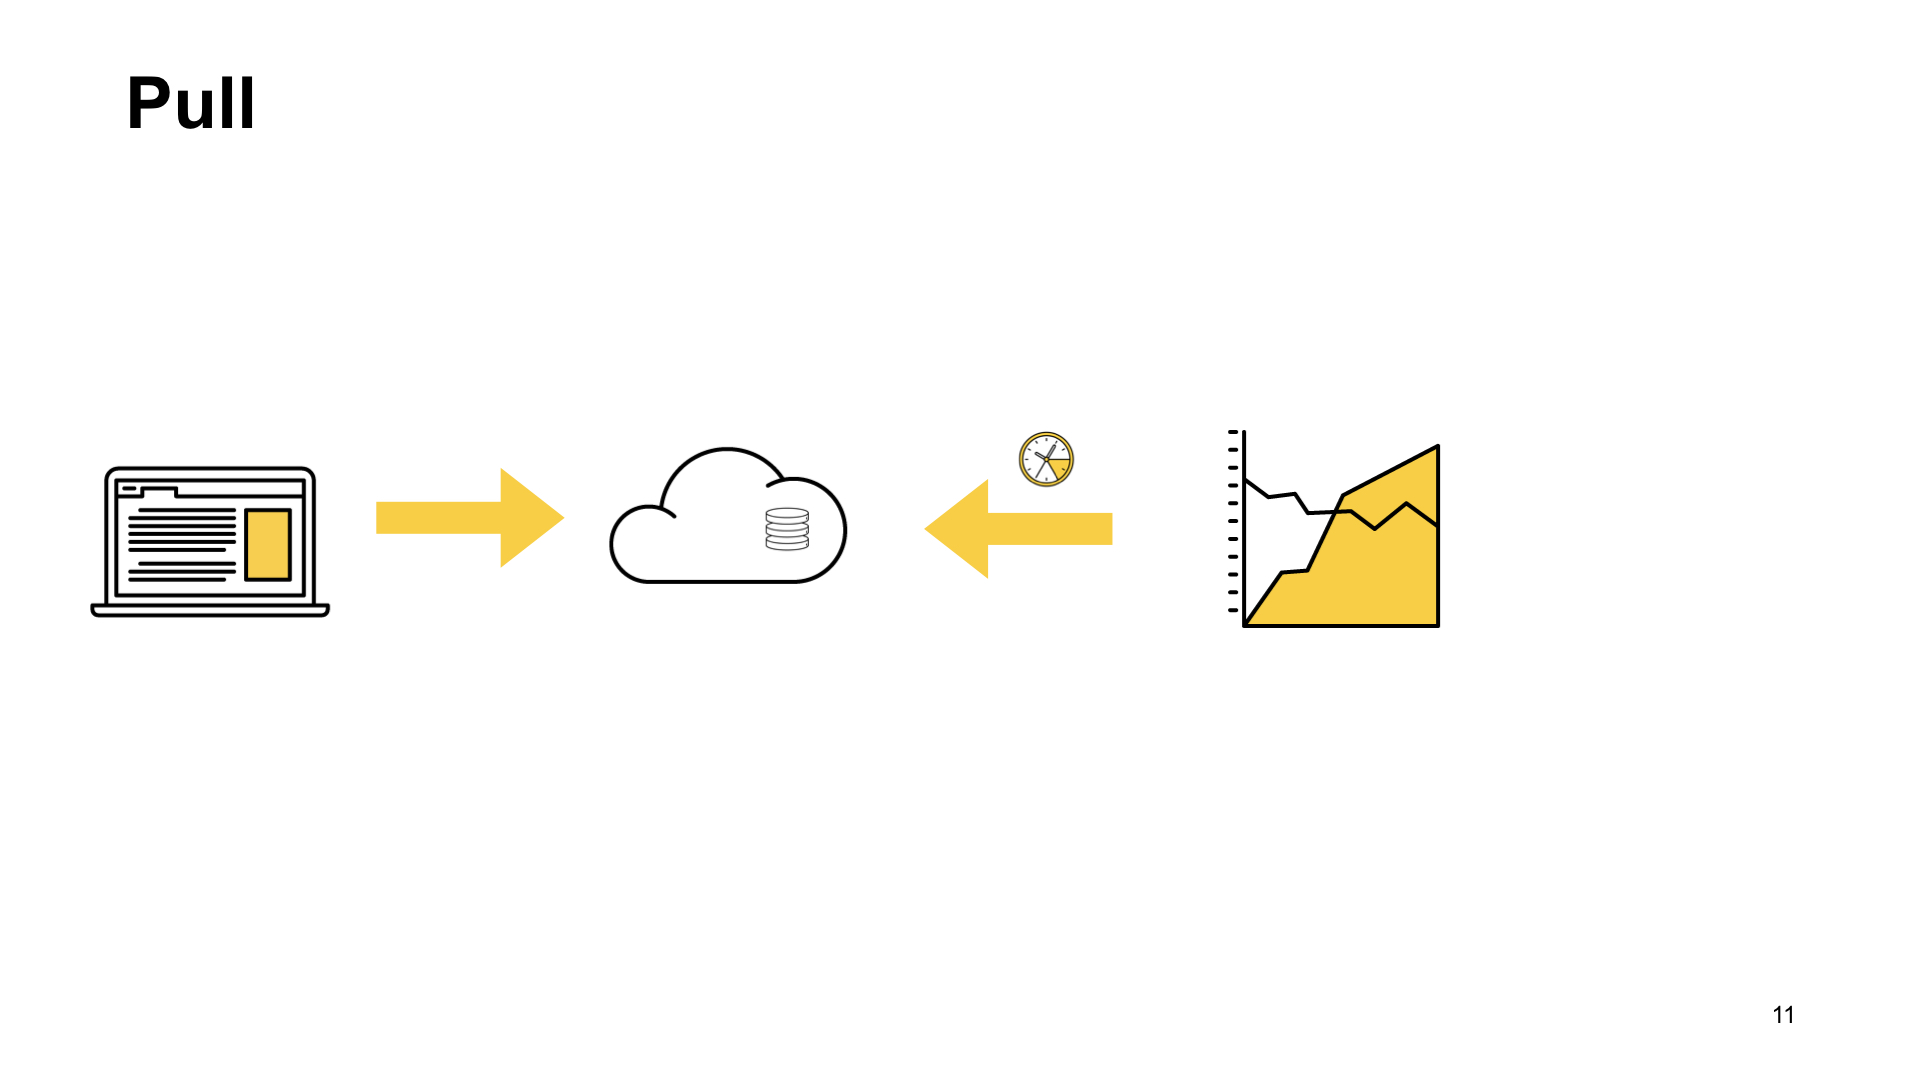
Another option is a pull scheme. With the pull scheme, we have the same scenario. A request from the user comes to us, we somehow keep it at home. And then with a certain frequency - once a second, once a minute, as it suits you - the metrics collection system comes to a special endpoint of our application and takes these indicators.

Another option is the logs. We all write logs and send them somewhere. Nothing prevents us from taking these logs, somehow processing them and getting metrics based on the logs.
For example, we write the fact of the user’s request in the log, then we take the logs, hop-hop, counted. A typical example is ELK (Elasticsearch, Logstash, Kibana).
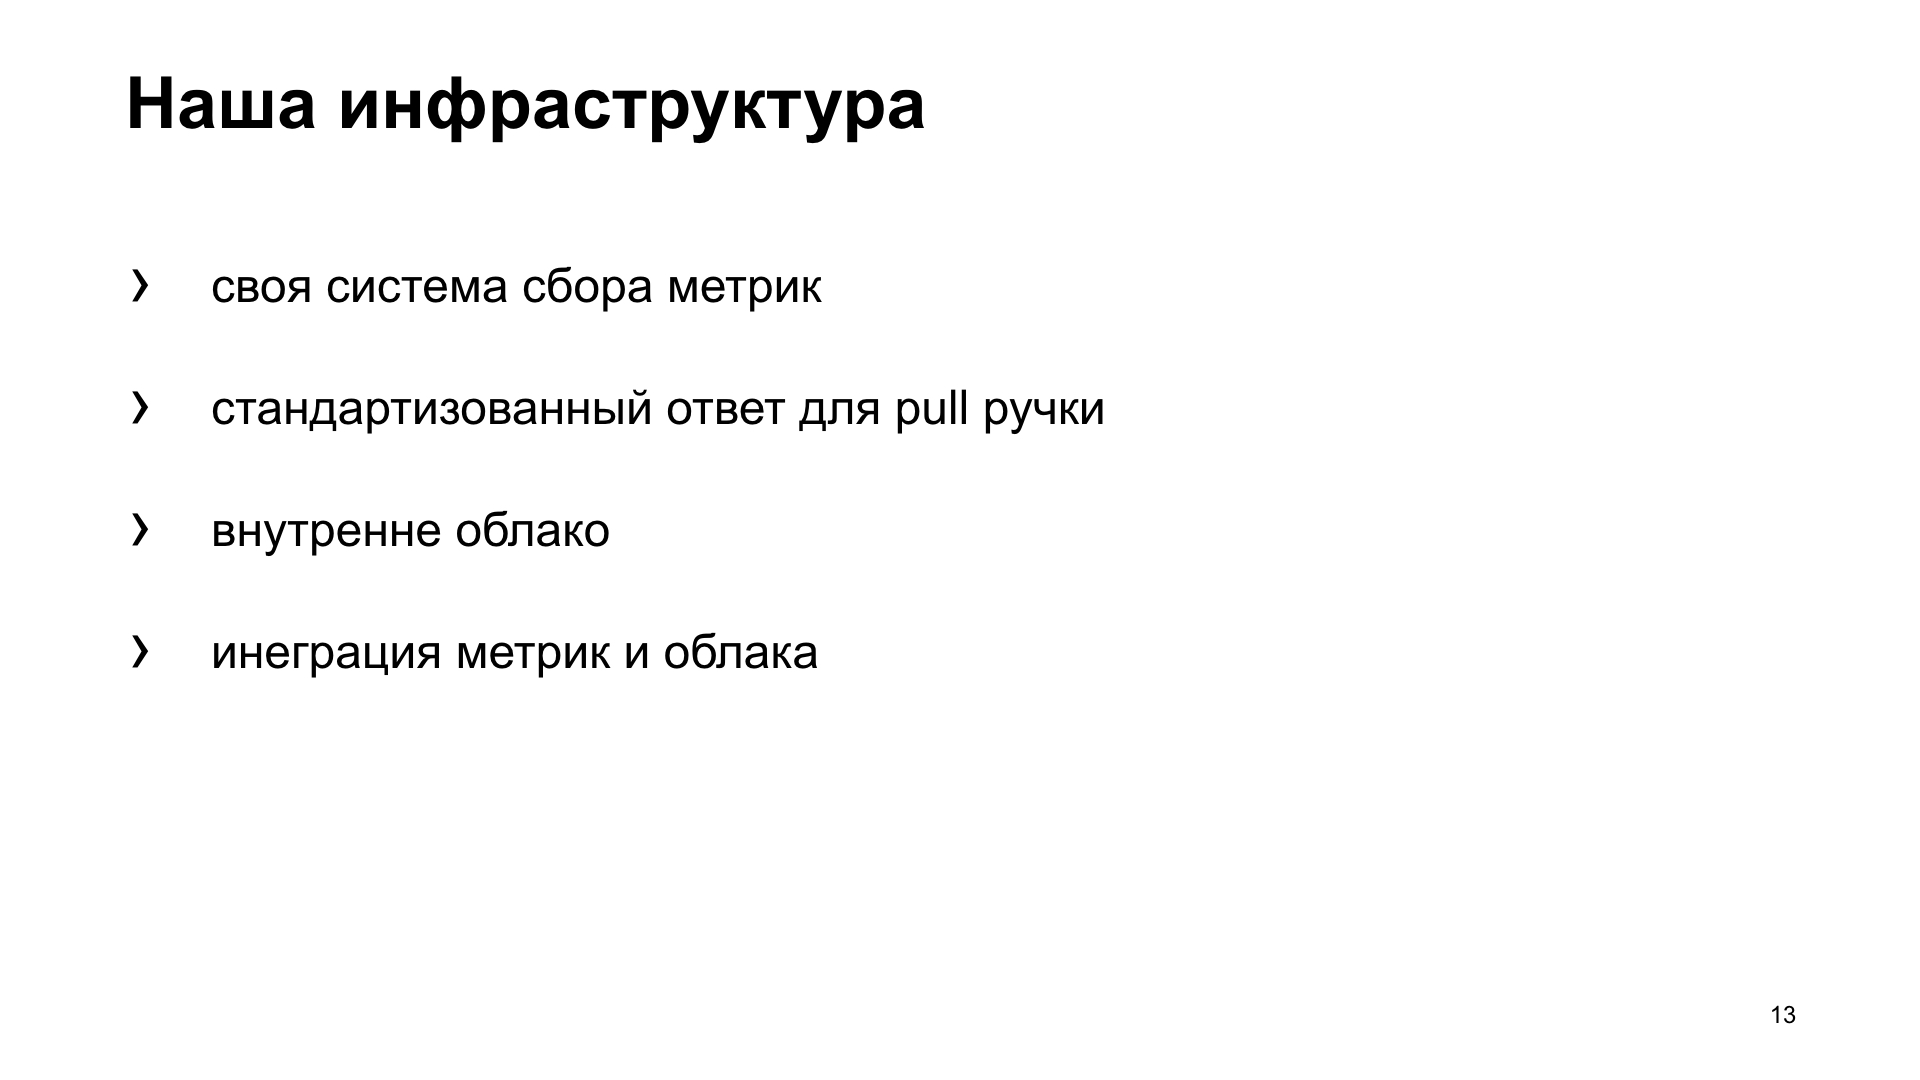
How does it work with us? Yandex has its own infrastructure, its own metrics collection system. She expects a standardized response for a handle that implements a pull scheme. Plus we have an internal cloud where we launch our application. And all this is integrated into a single system. When uploading to the cloud, we simply indicate: "Go to this pen and get metrics."
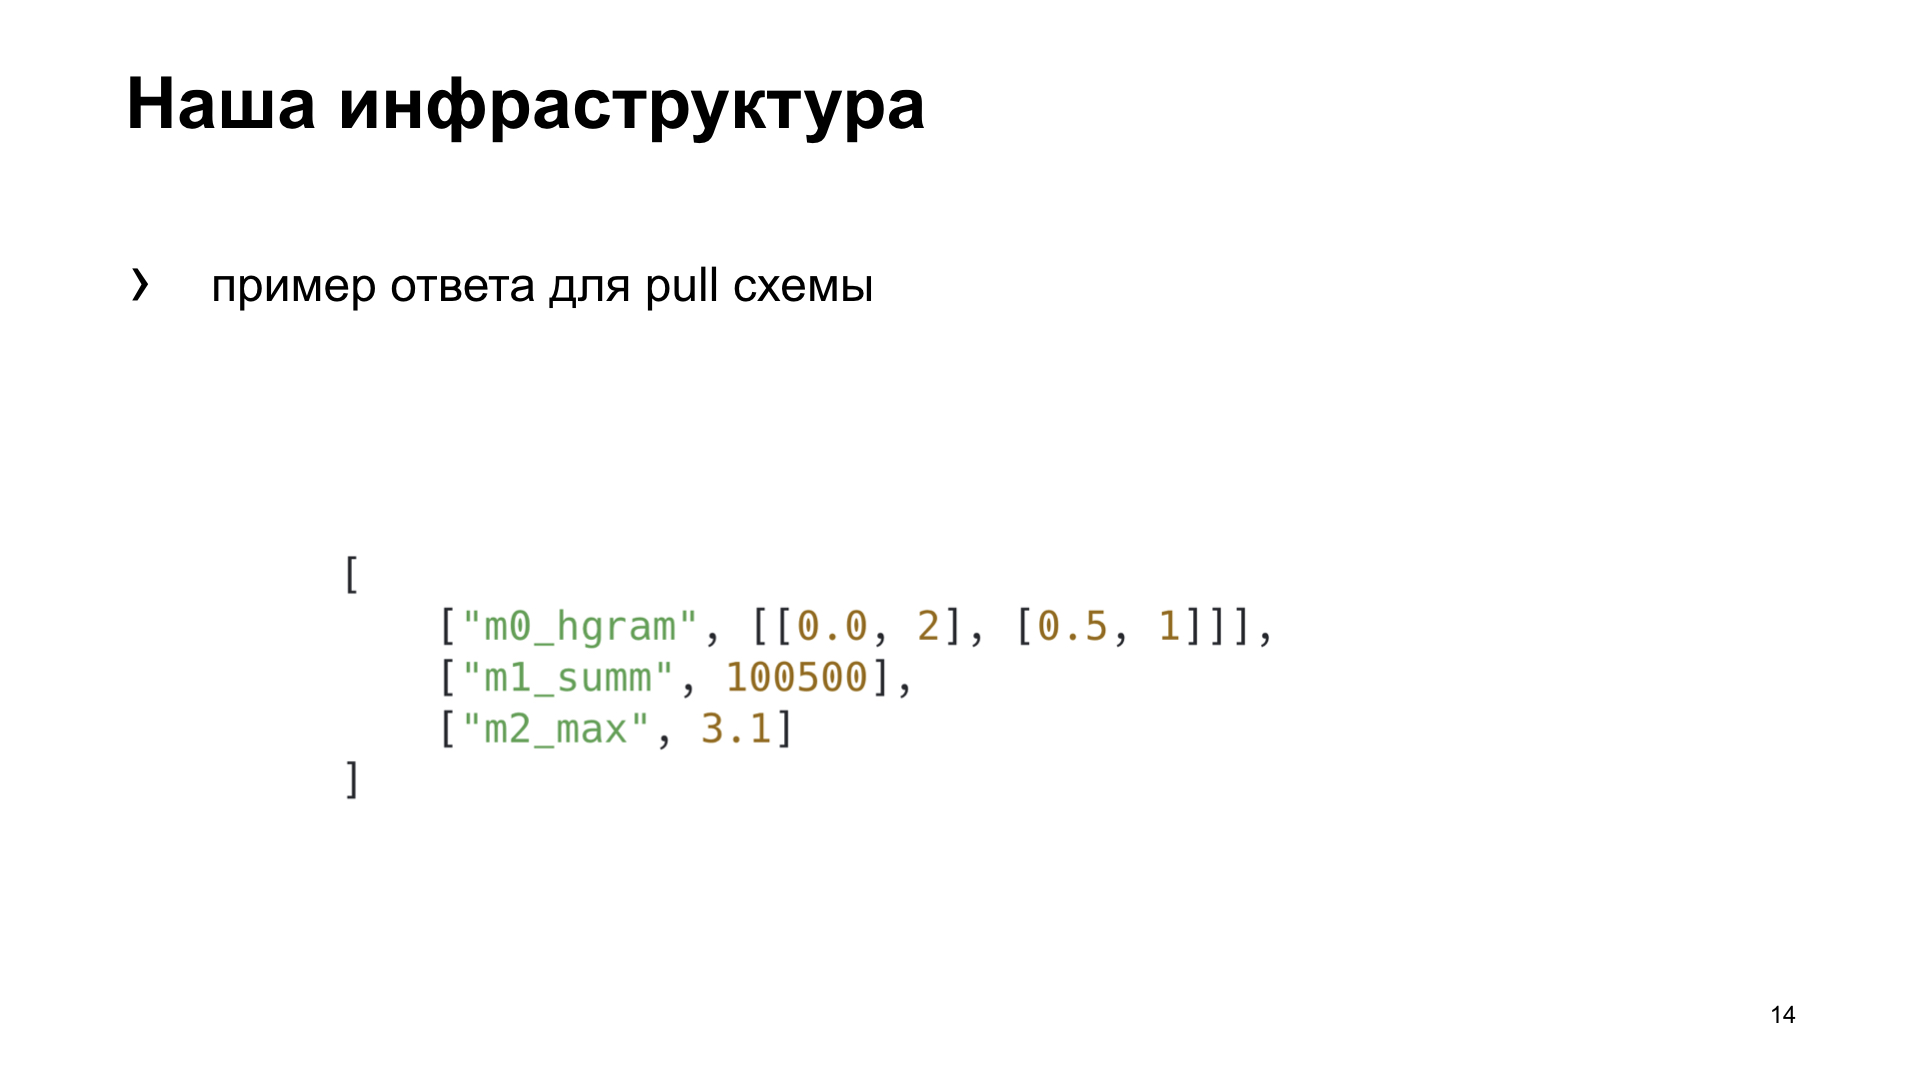
Here is an example response for the pull scheme that our metric collection system expects.
For ourselves in the team, we decided to choose a more suitable way for us, to highlight several criteria by which we will choose the best option for us. Efficiency is how quickly we can get in the metric system a reflection of the fact of any action. Dependence - whether we need to install additional tools or somehow configure the infrastructure to get the metric. And versatility - how this method is suitable for different types of applications.
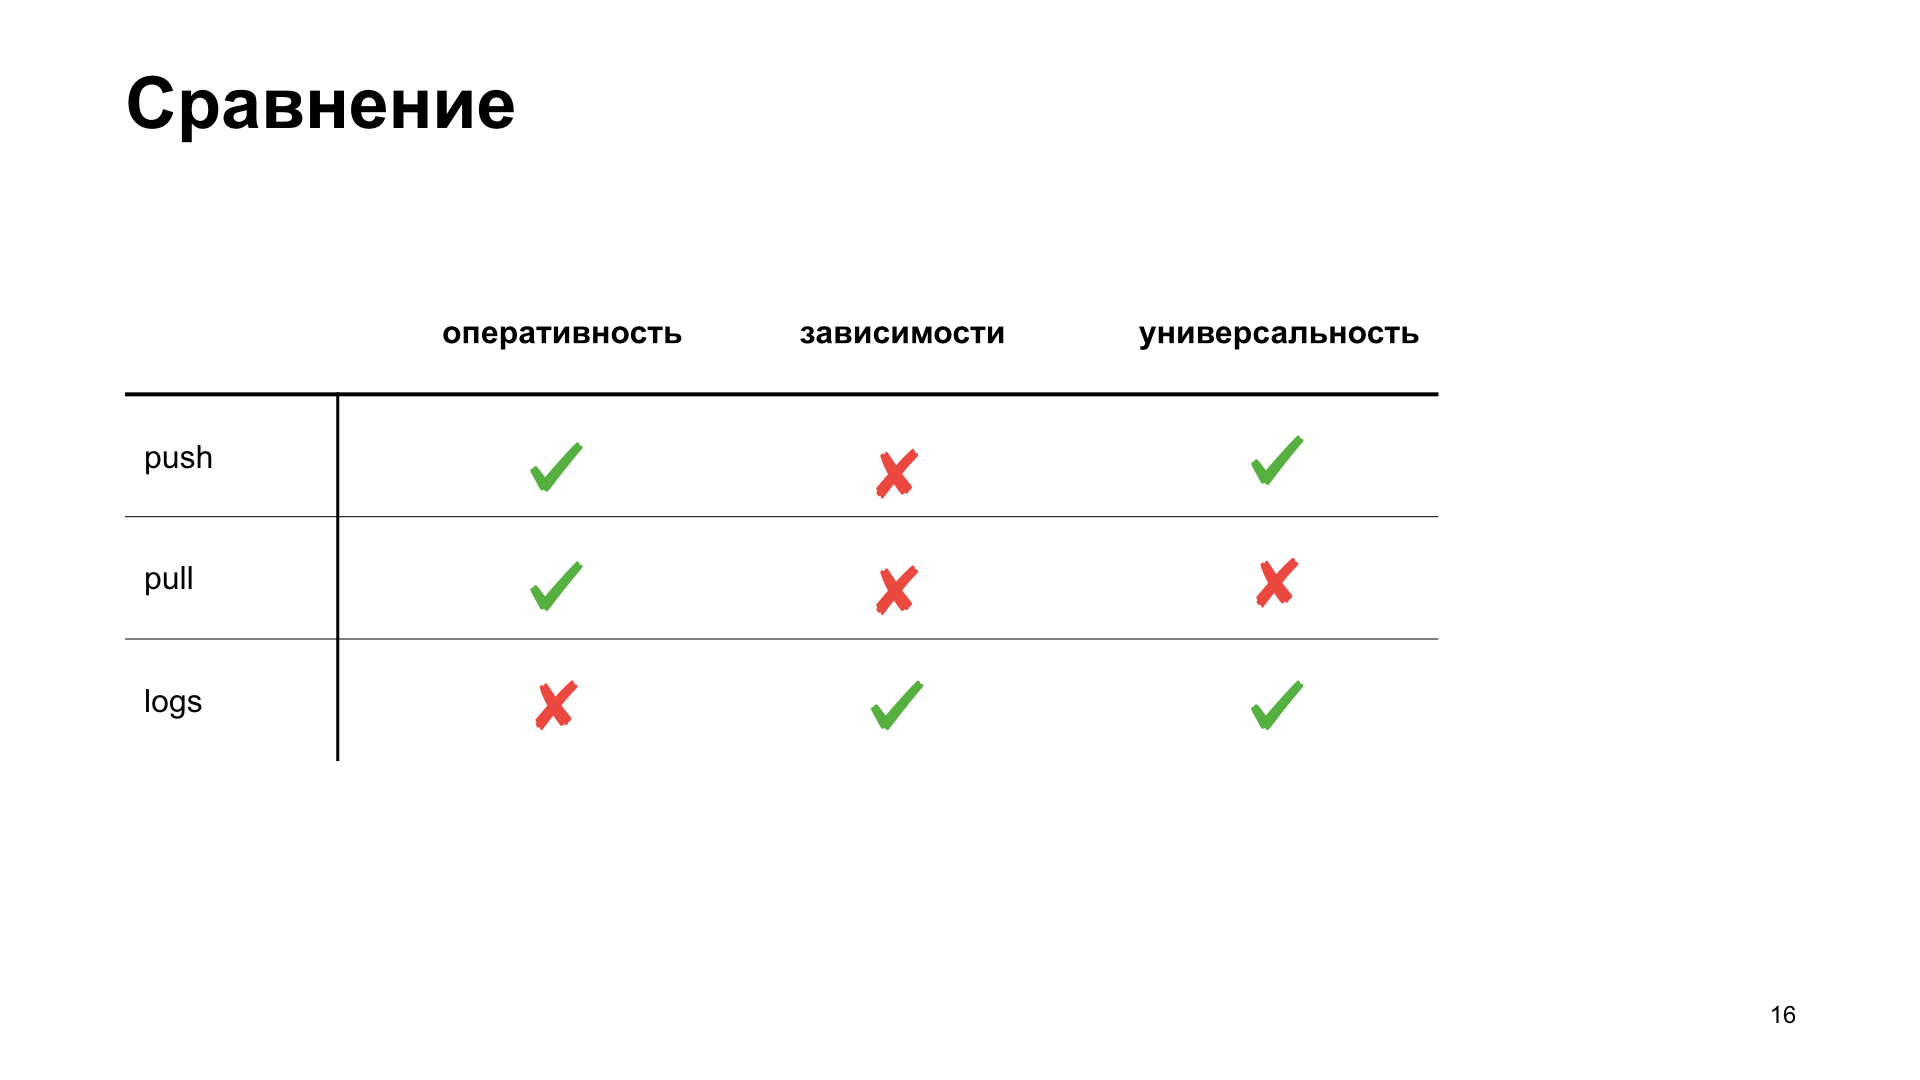
That's what we got in the end. Although, according to the criteria of efficiency and versatility, the push scheme will win. But we are developing a web application, and our cloud already has a ready-made infrastructure for working with this task, so we decided to choose a pull-scheme for ourselves. We’ll talk about her.
In order to give something to the pull-scheme, we need to pre-aggregate it somewhere, save it. Our monitoring system goes into pull-handles every five seconds. Where can we save? Locally in your memory or in a third-party storage.
If we save locally, then as a rule, this is suitable for the case with one process. And we, in our uWSGI, run several processes in parallel. Or we can use some kind of shared storage. What comes to our mind with the word “shared storage”? This is some kind of Redis, Memcached, relational or non-relational databases, or even a file.
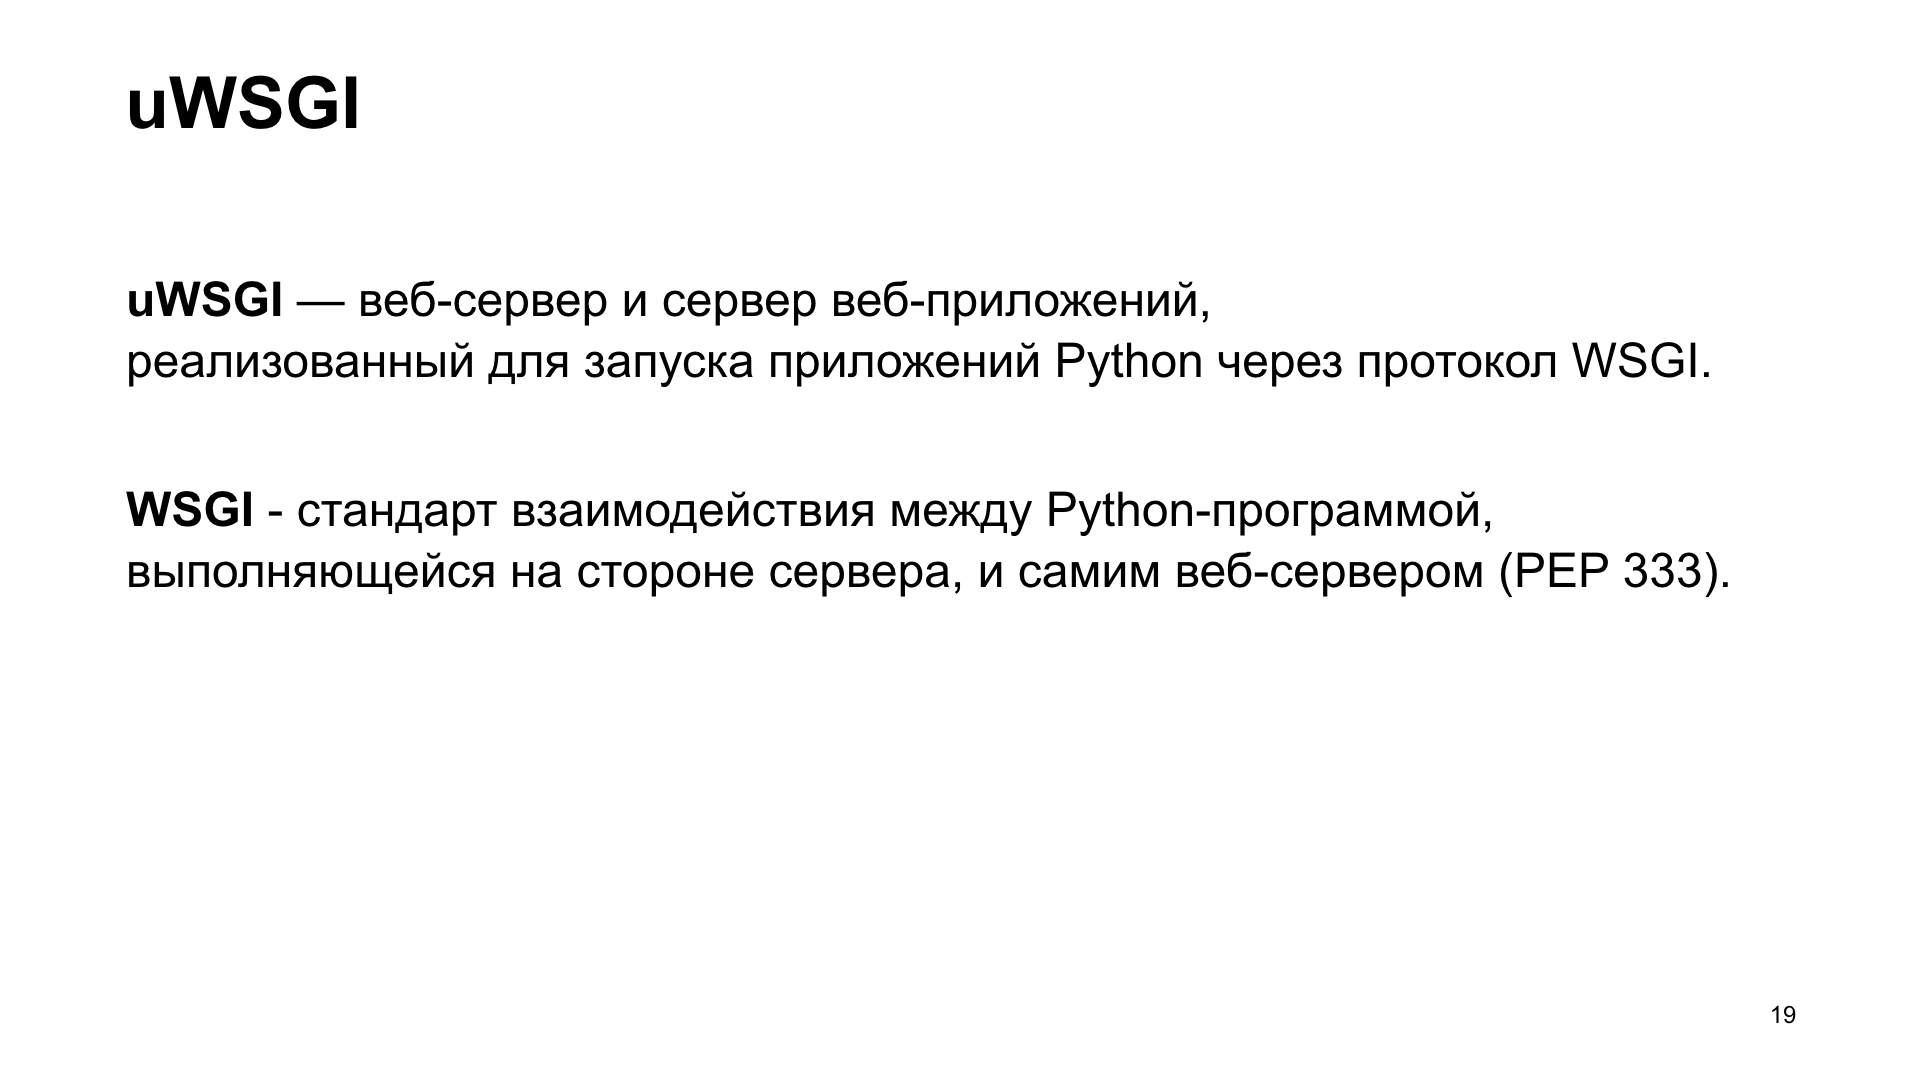
About uWSGI. Let me remind those who use it little or rarely: uWSGI is an application web server that allows you to run Python applications under you. It implements the interface, the uWSGI protocol. This protocol is described in PEP 333, who are interested, you can read.
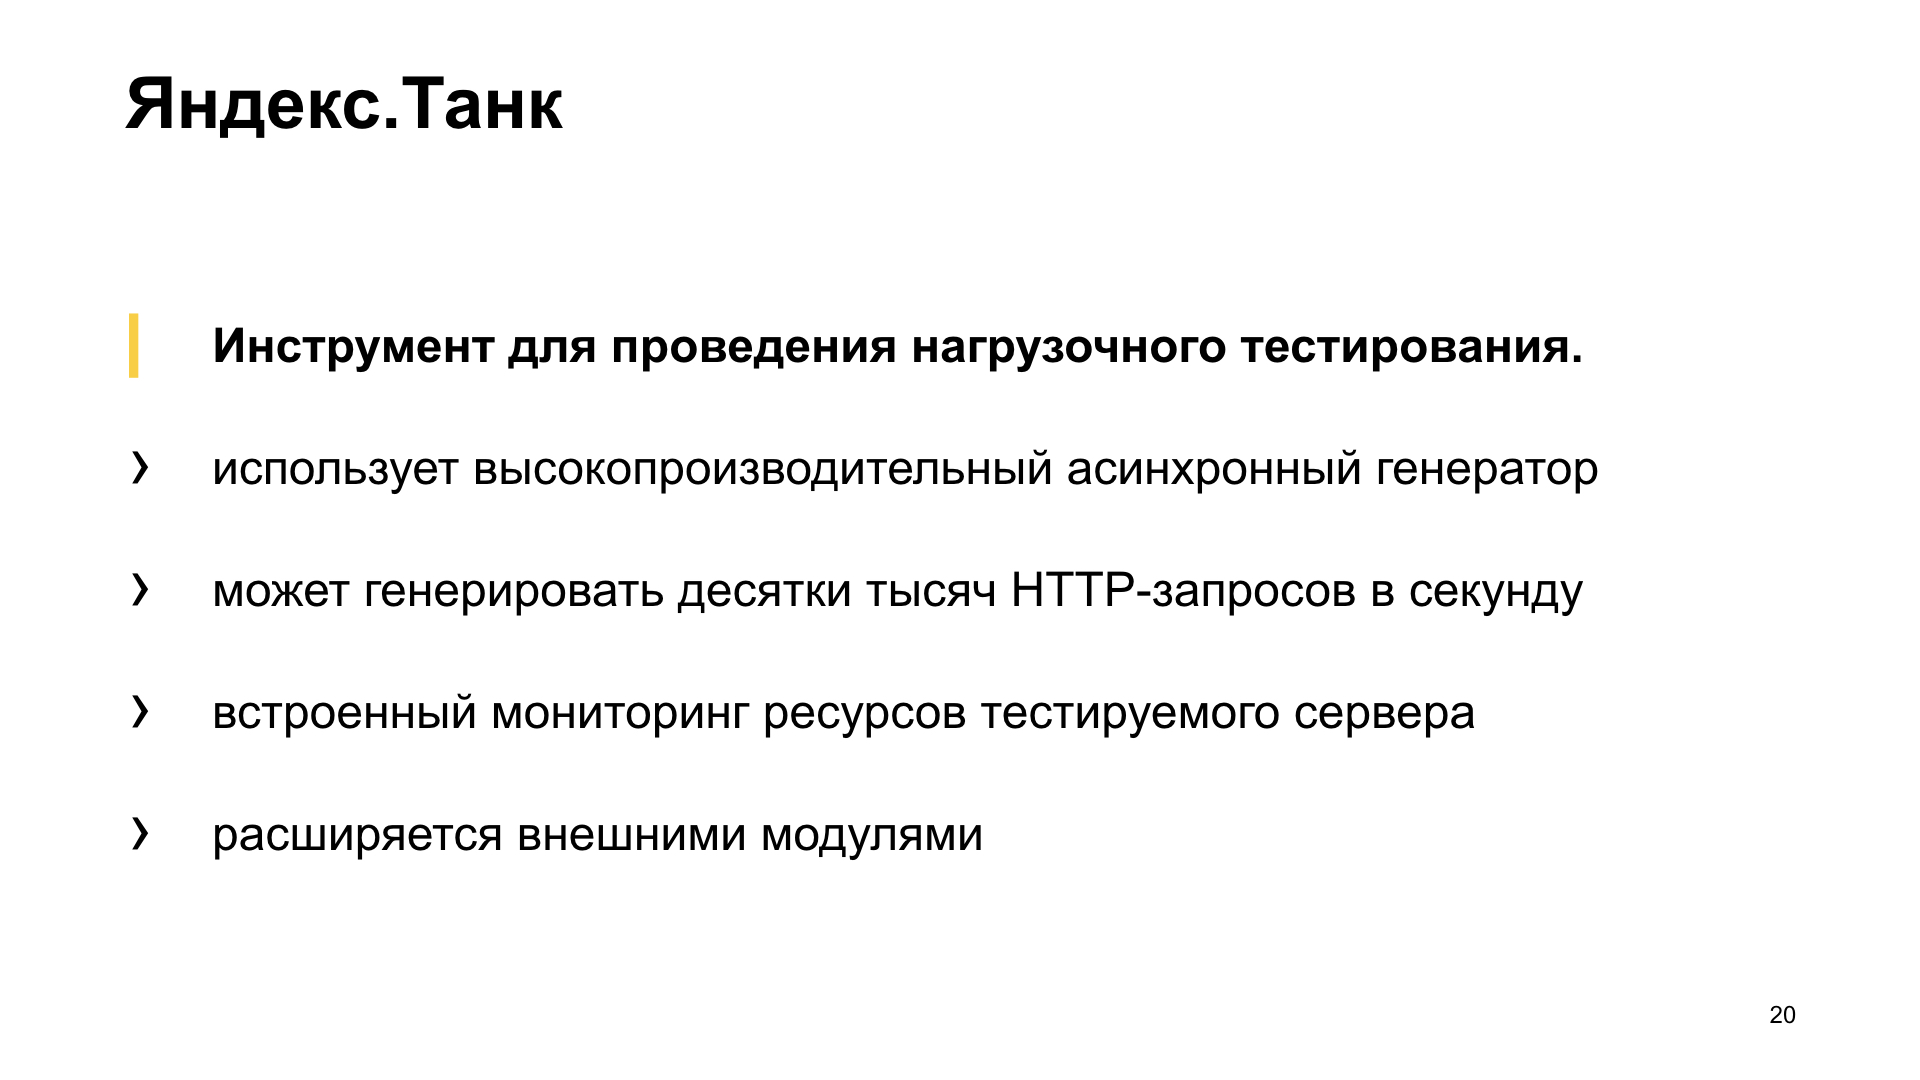
It will also help us to choose the best Yandex.Tank solution. This is a load testing tool, allows you to shell our application with various load profiles and builds beautiful graphics. Or it works in the console as you like.

The experiments. We will create a synthetic application for our synthetic tests, we will shell it with a tank. The uWSGI application will have a simple conflict with 10 workers.
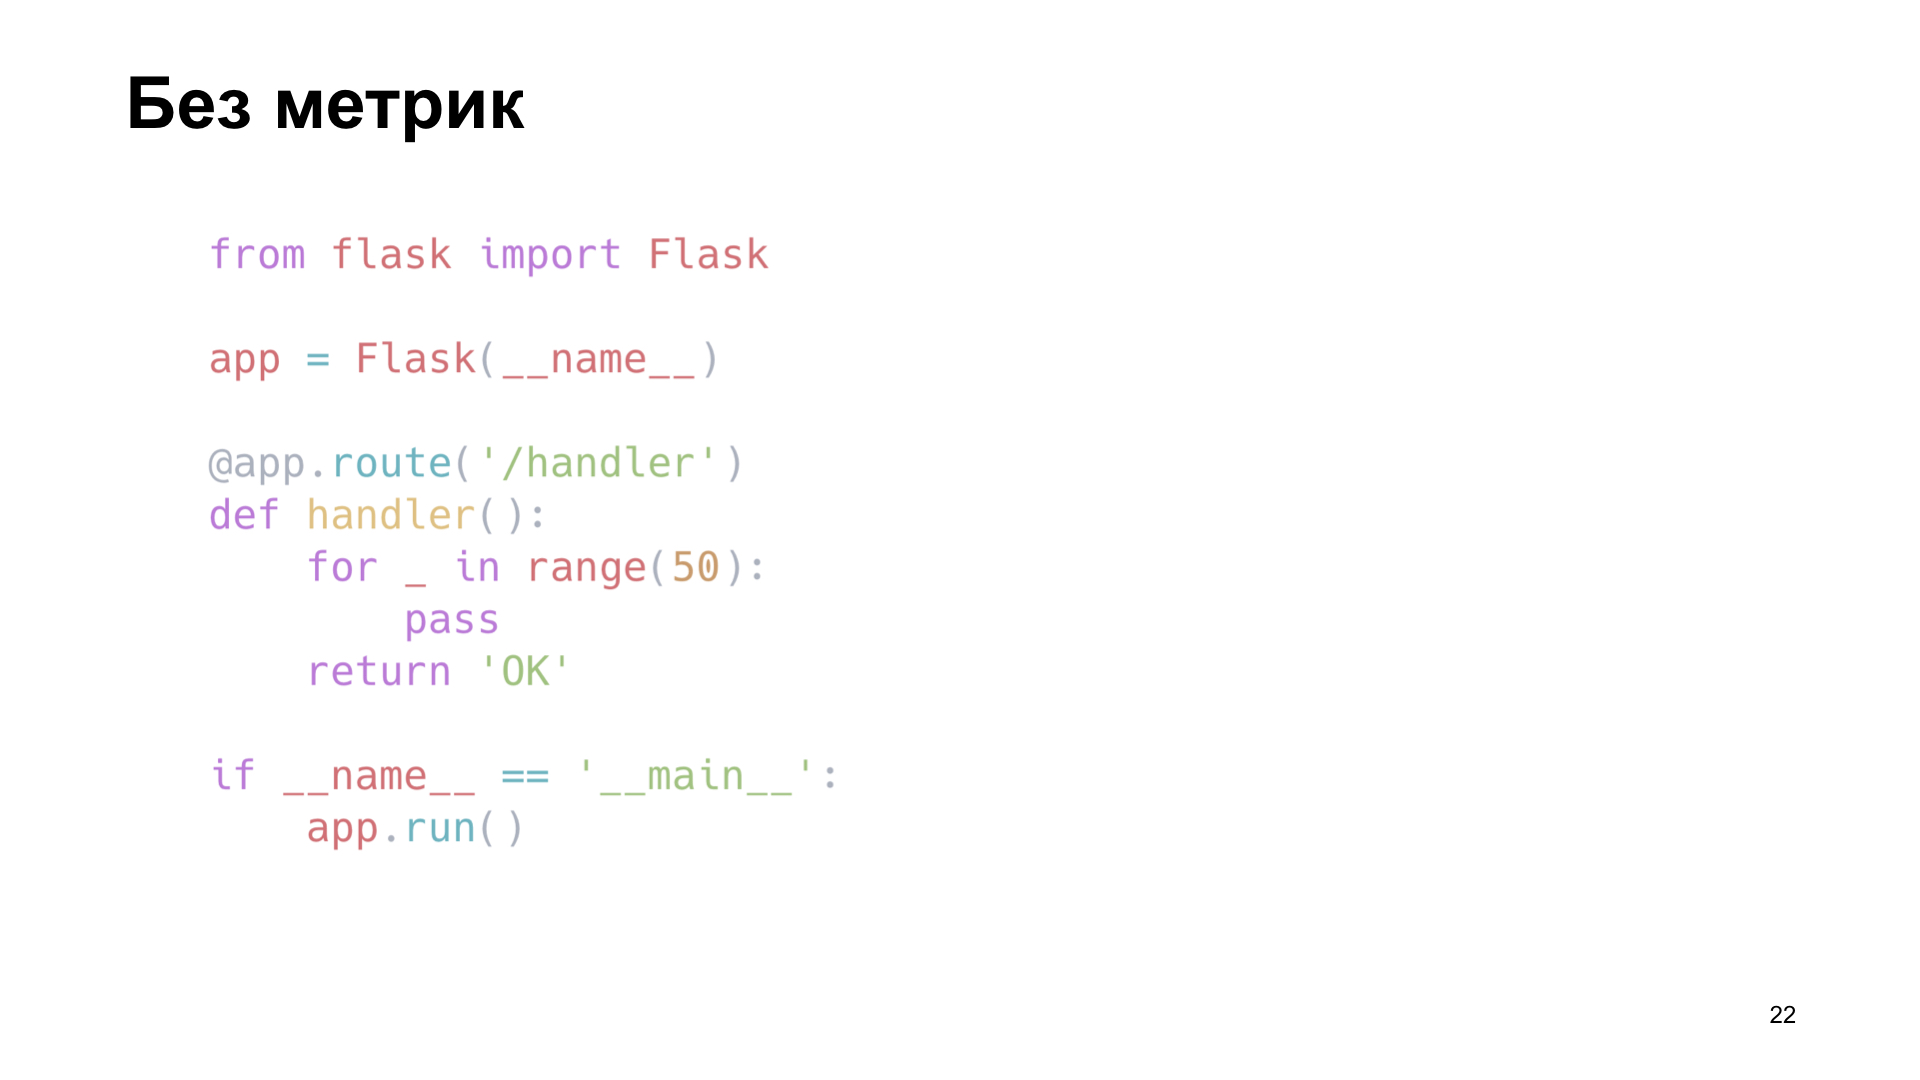
Here is our Flask app. The payload that our application performs, we will emulate an empty loop.

We fire, and Yandex.Tank gives us one of these graphs. What is he showing? Percentiles of response times. The slant line is the RPS that are growing, and the histograms are what percentiles our web server fit into under such a load.
We will take this option as a reference and look at how different options for storing metrics affect performance.
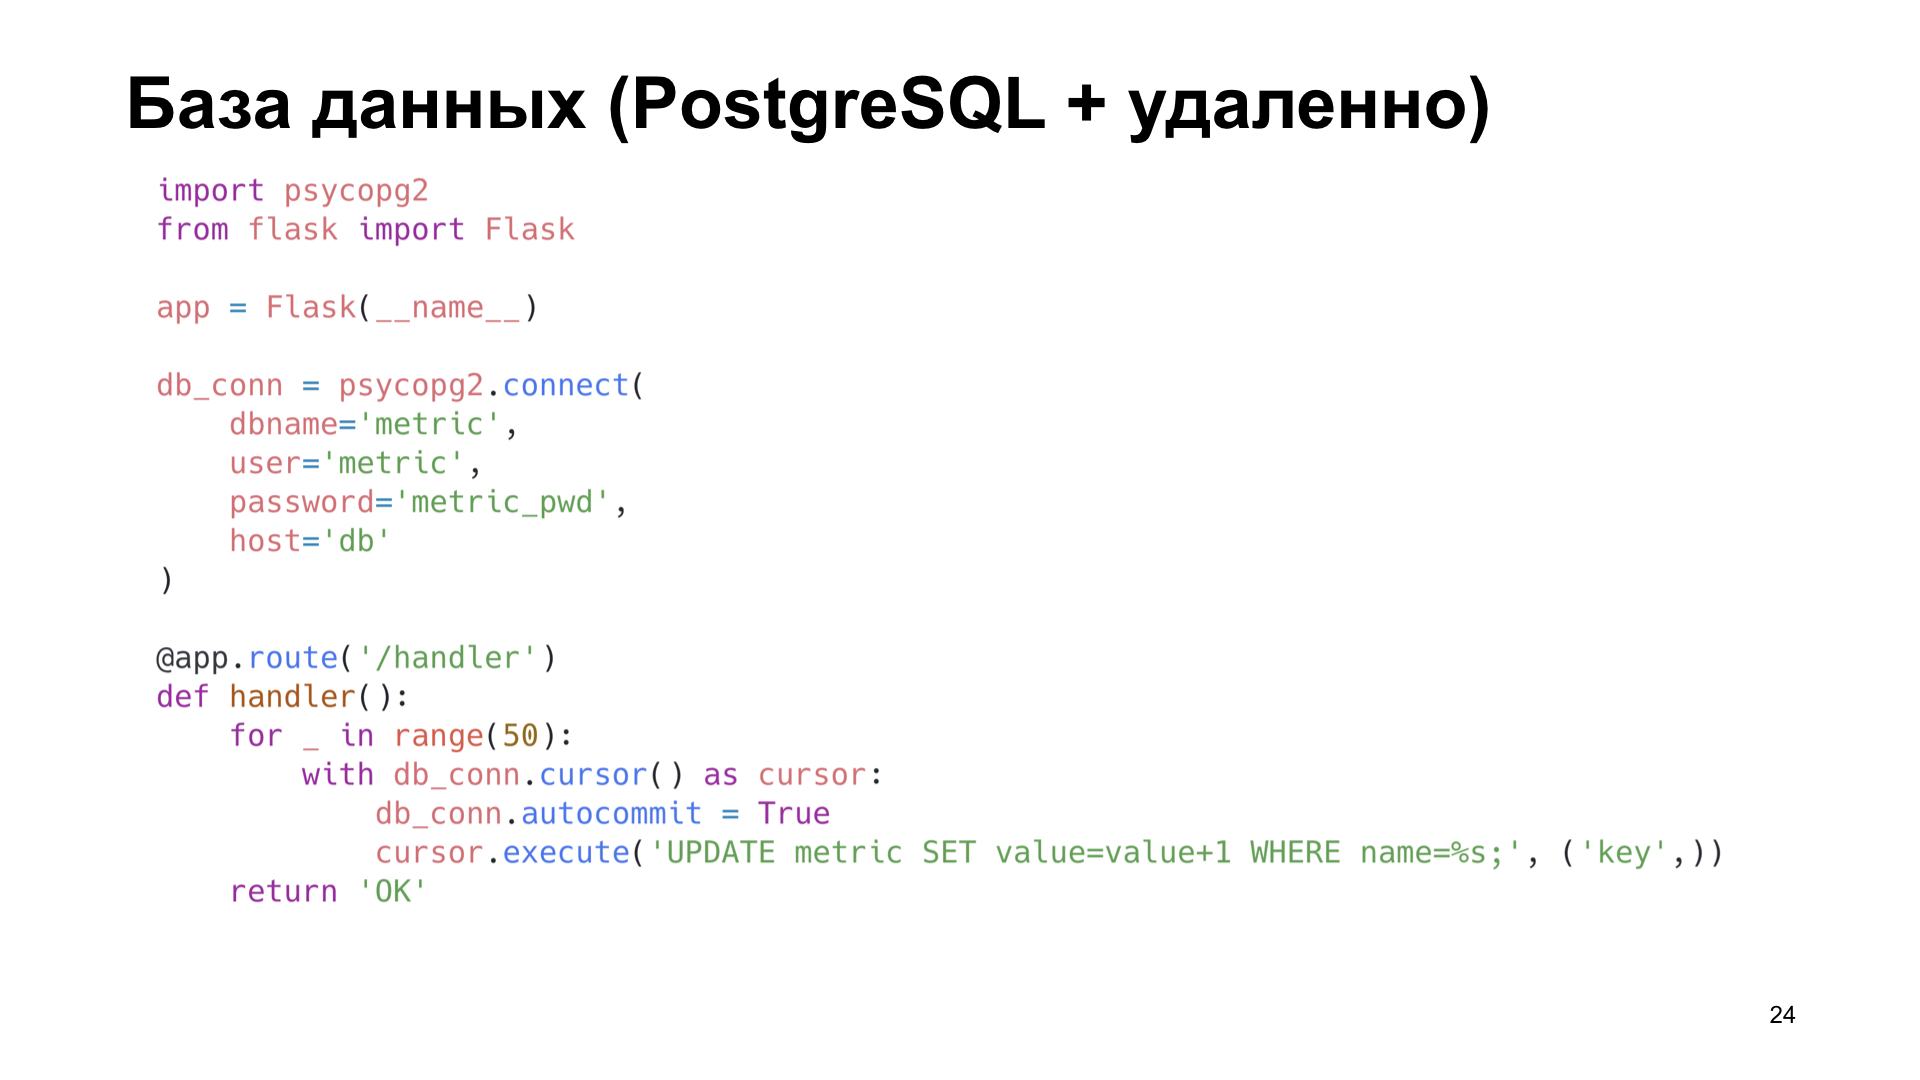
The simplest option is to use PostgreSQL. Because we work with PostgreSQL, we have it. Let's use what is already ready.
Let's say we have a label in PostgreSQL in which we simply increment the counter.

Already on small amounts of RPS we see a strong performance degradation. It can be said simply huge.
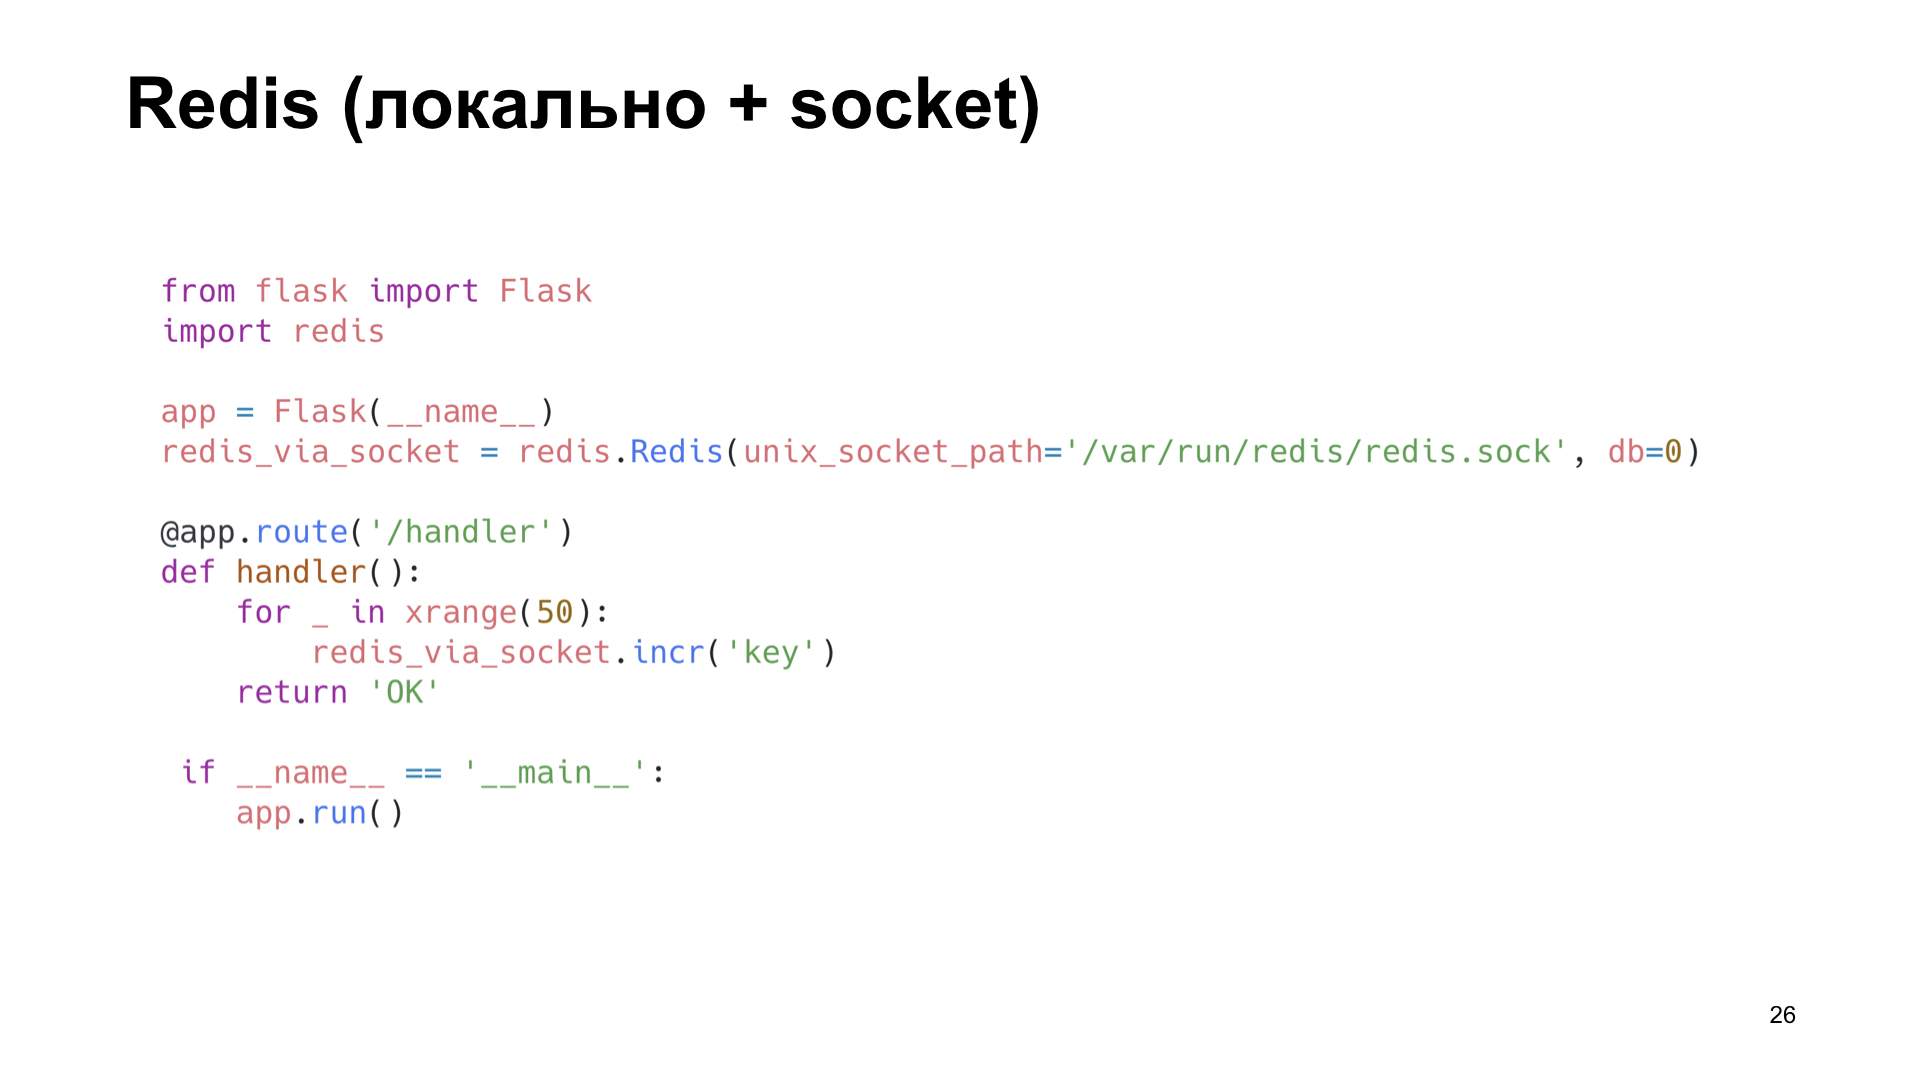
The next option is Redis. But here we are doing smarter: we install it locally and go to it not over the network, but through the Unix socket. Also increase the counter.
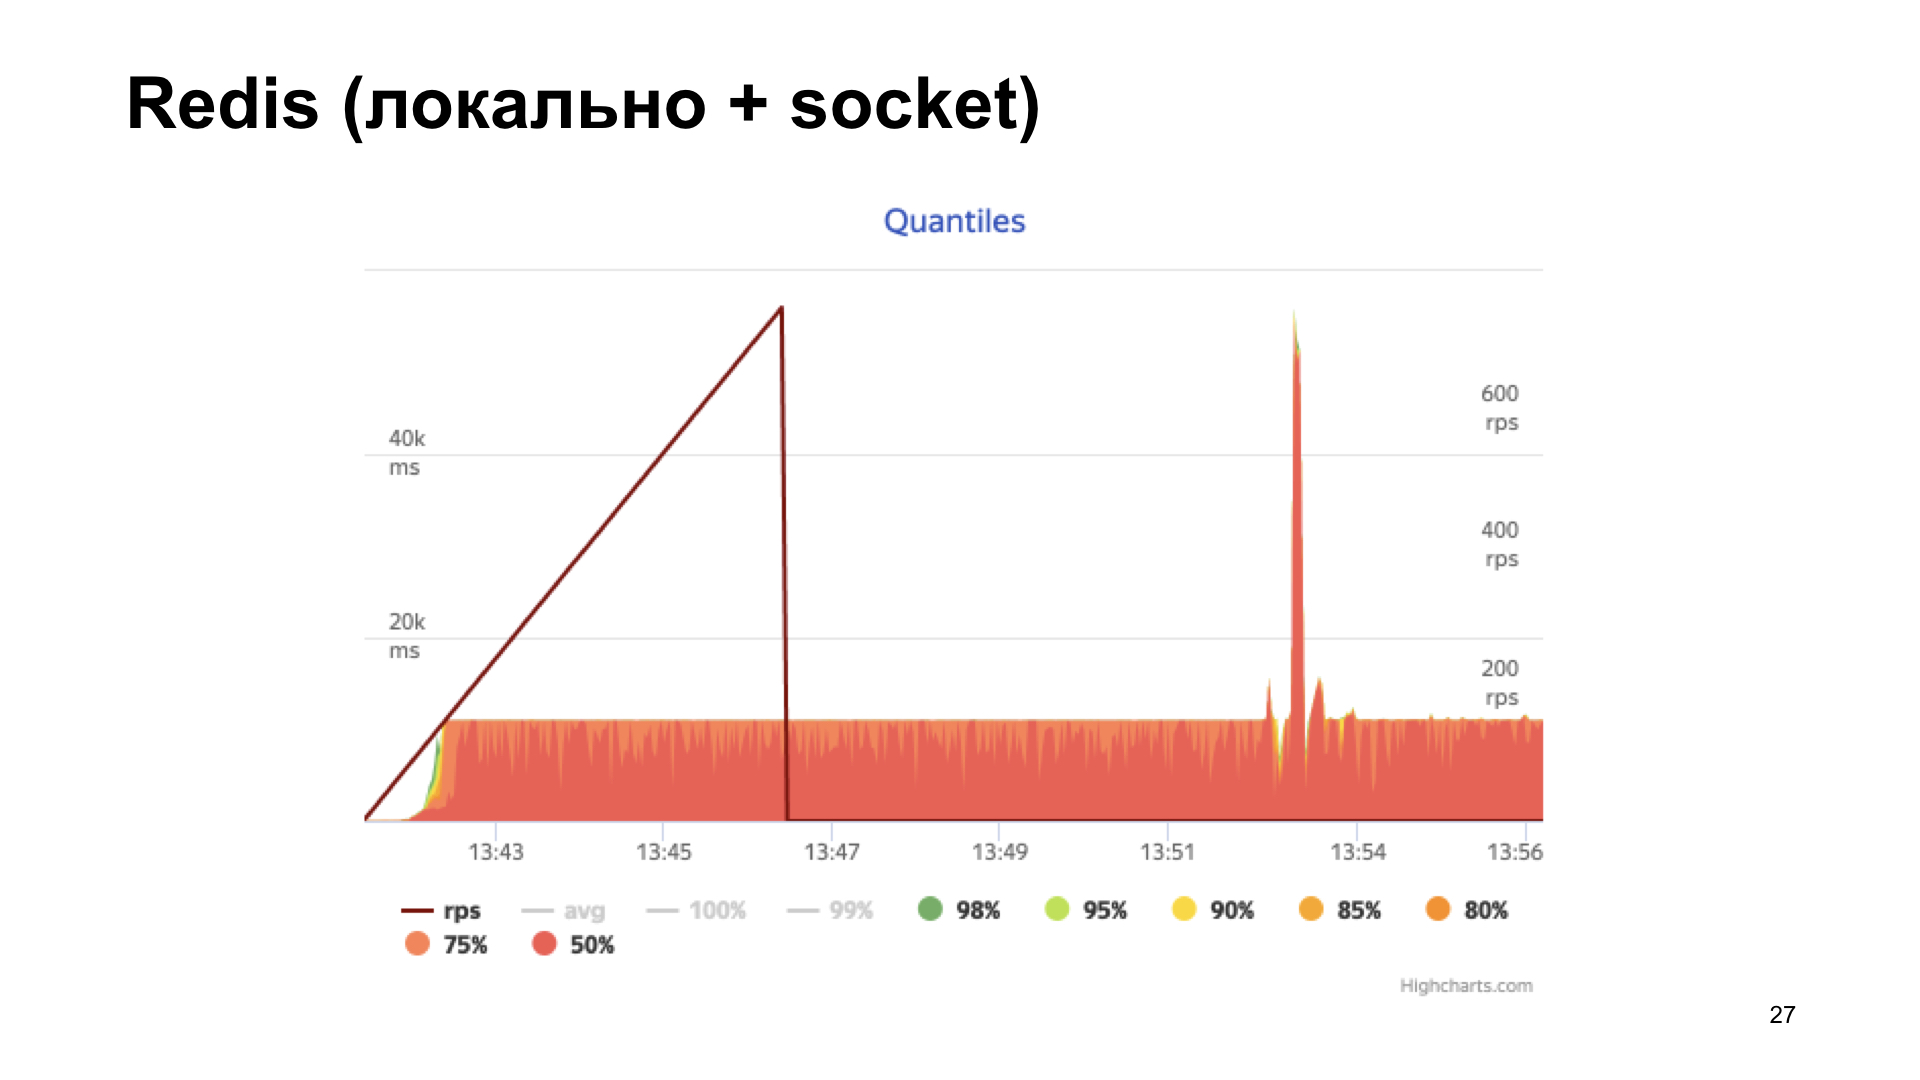
We get the histogram of response times at the output. We see that things are better here, but at some point we run into a shelf, and then productivity is no longer growing. This option seems more optimal, but we want to do even better.
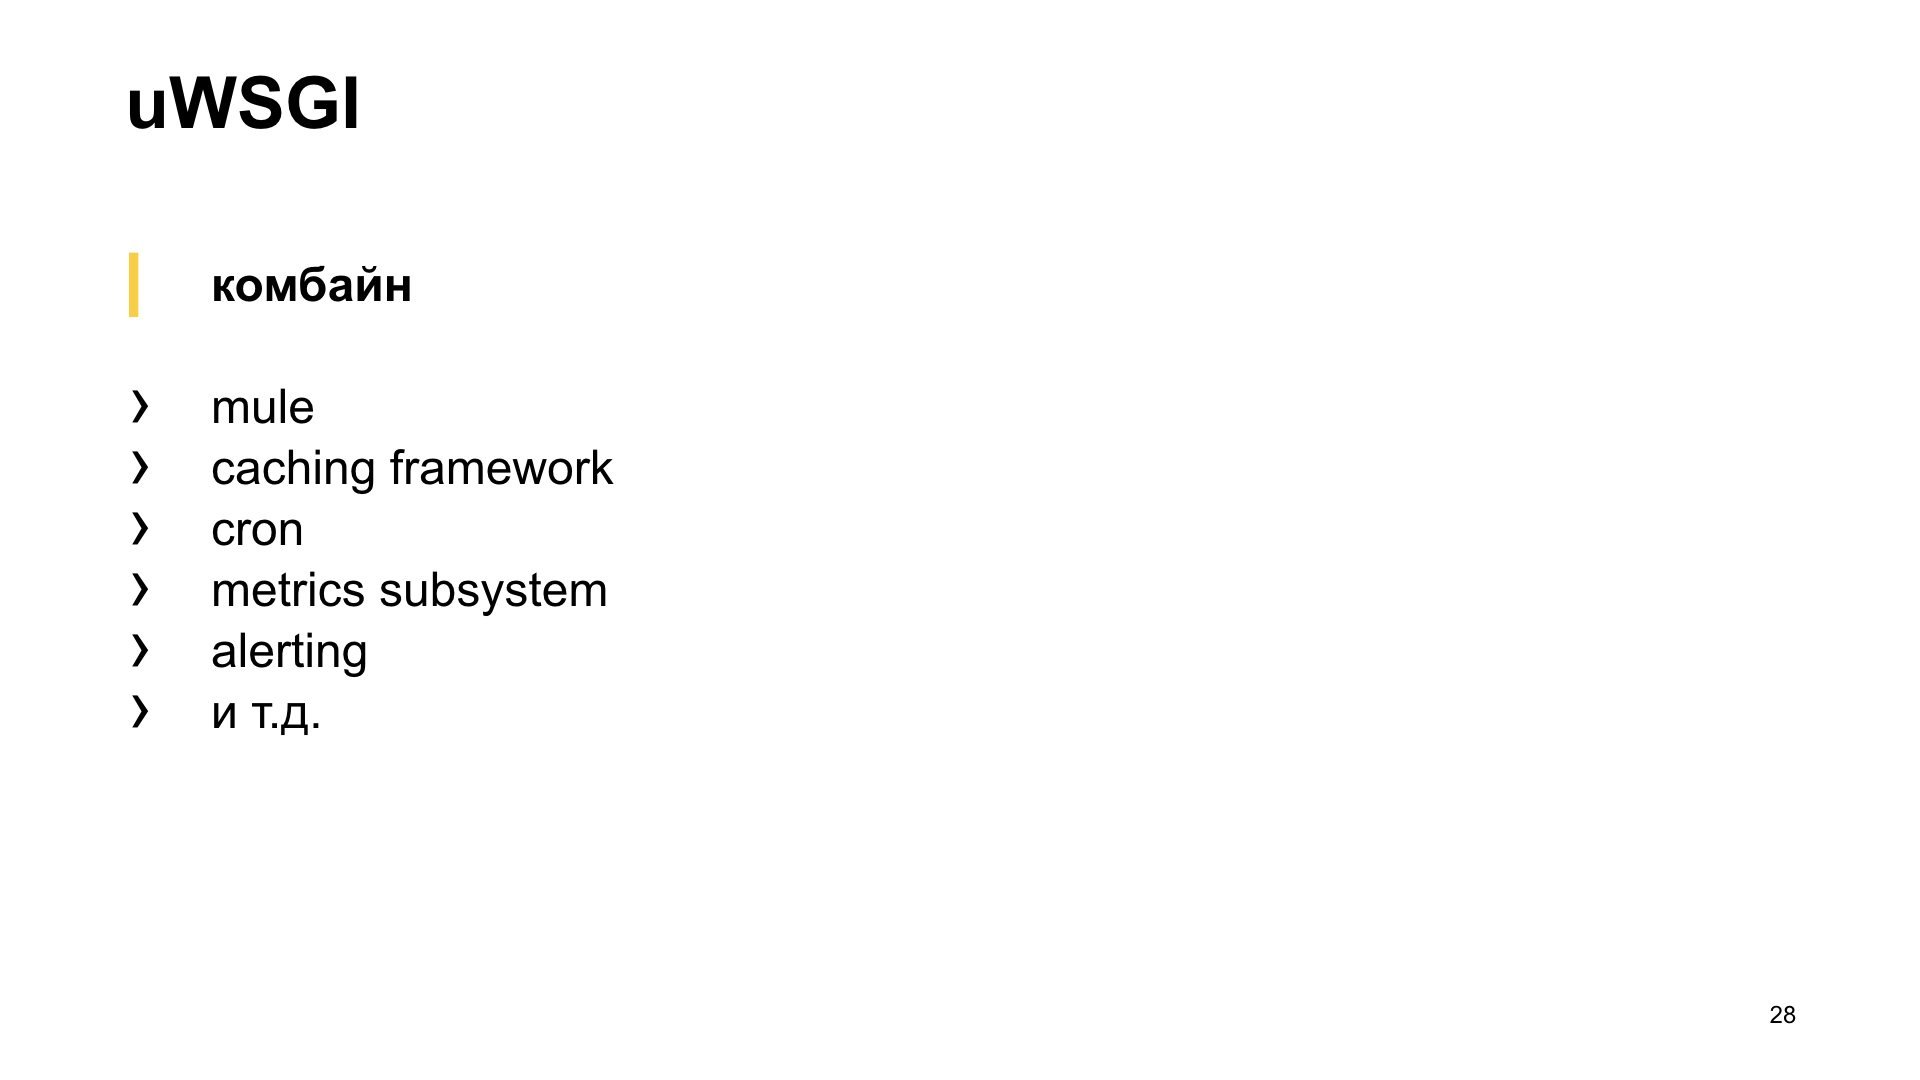
Here uWSGI, a real combine, comes to our aid. There are many different modules. Mule for running subprocesses, caching framework, cron, metrics subsystem and alerting system. "Subsystem metrics system" - sounds promising.

She knows how to add some kind of metrics, increase the counter, decrease the counter, multiply, divide - whatever your heart desires.
The only metric subsystem is not able to give exactly the metrics built into it.
Why is this important to us? As you saw earlier, we have a handle for giving statistics in a specific format, and several workers are running. We don’t know which of the workers will receive the request, but in order to return all the metrics, we need to create some kind of registry of names and somehow scramble it between the processes. This is some big deal, I want to avoid this. What else do we have?
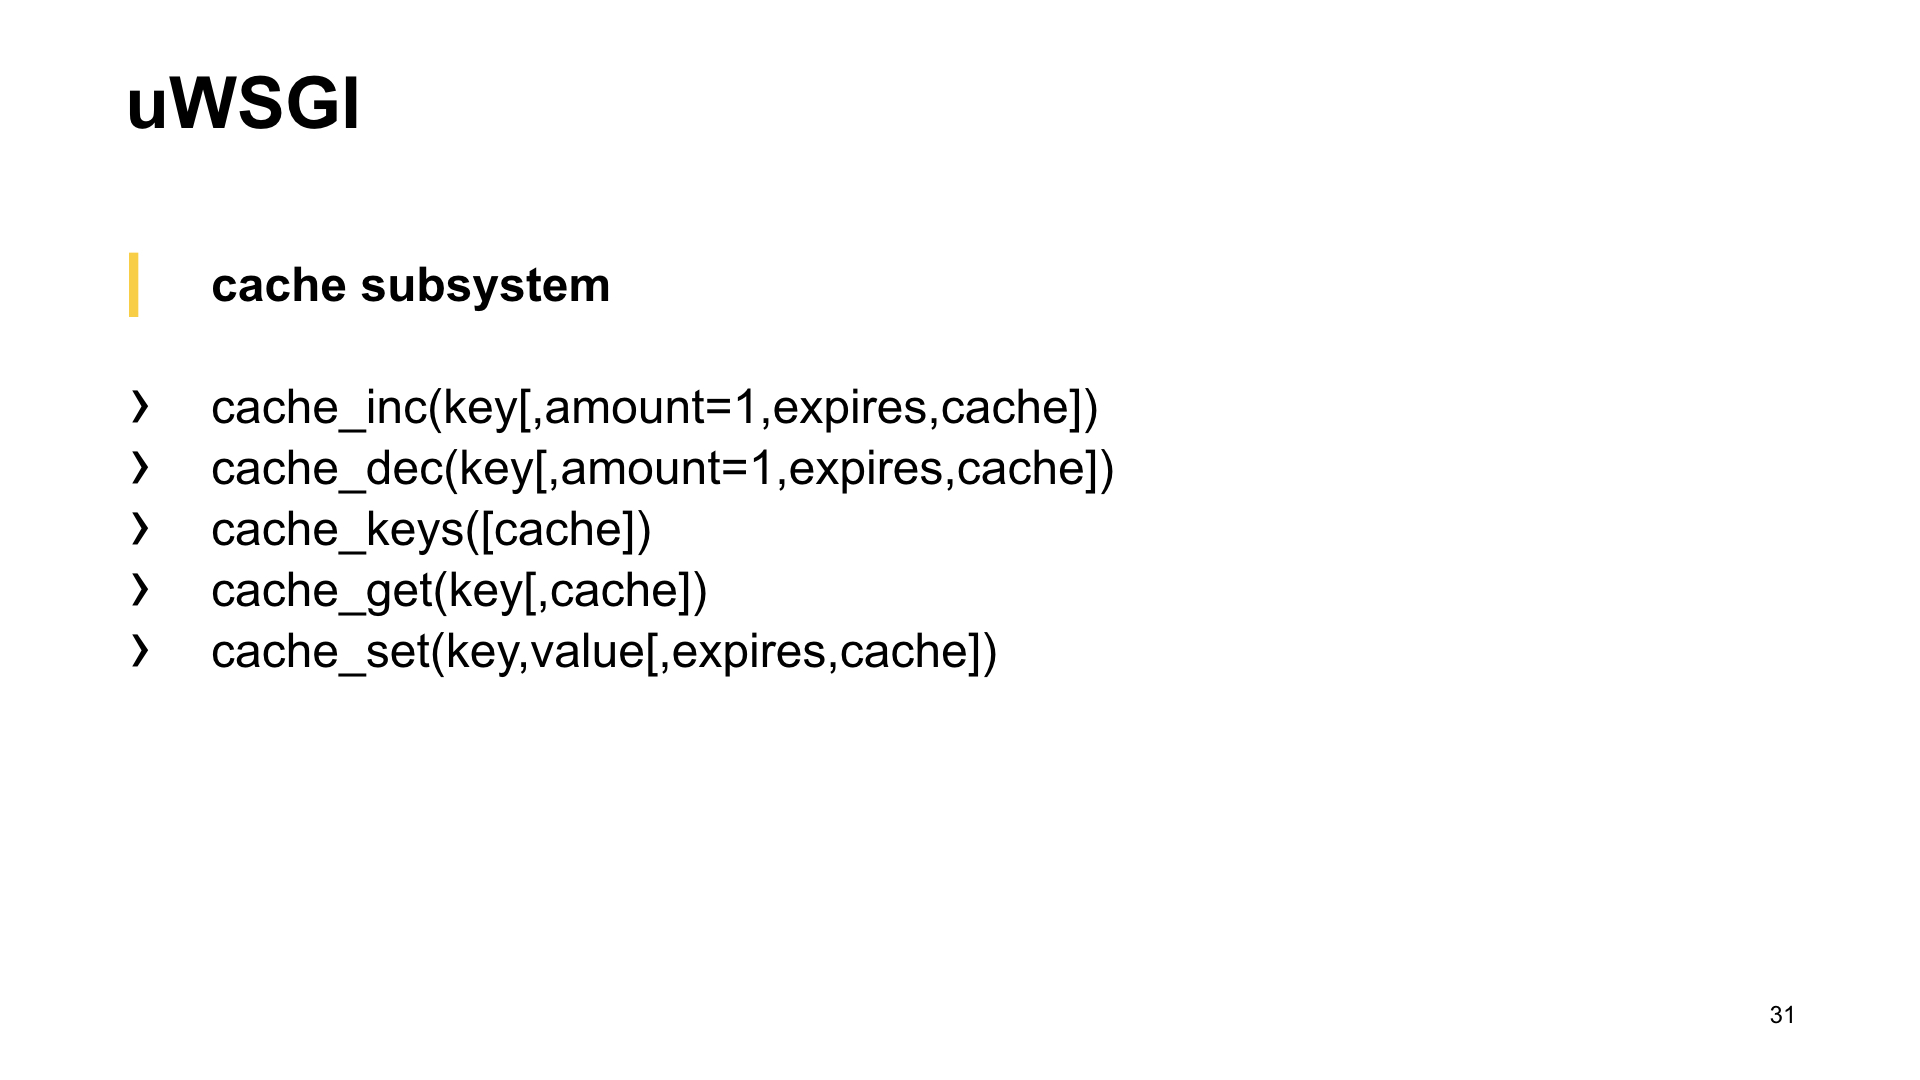
Of course, cache subsystem. And here we see: he can do almost the same thing, and he is also able to give the names of keys stored in the cache. This is what you need.
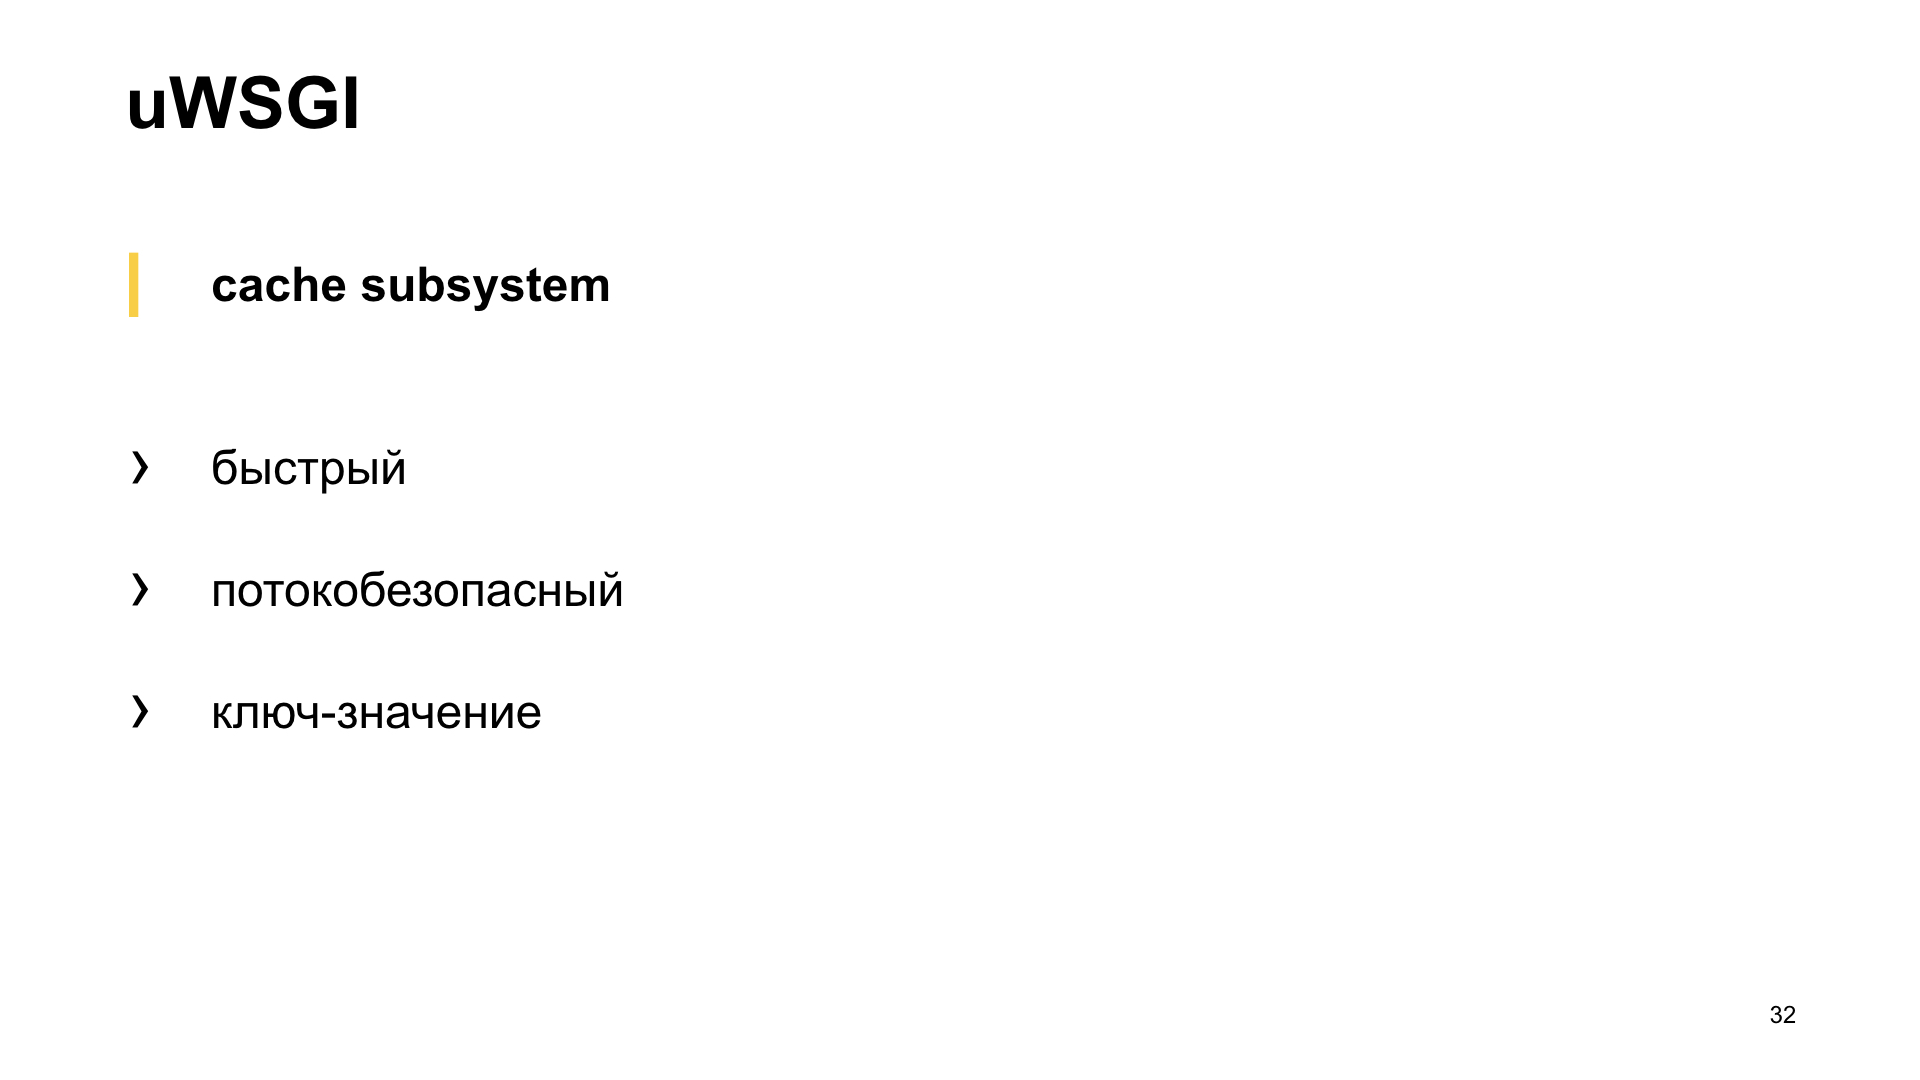
Cache subsystem is a cache built into uWSGI. A fast and thread-safe module, which is an ordinary key-value storage.
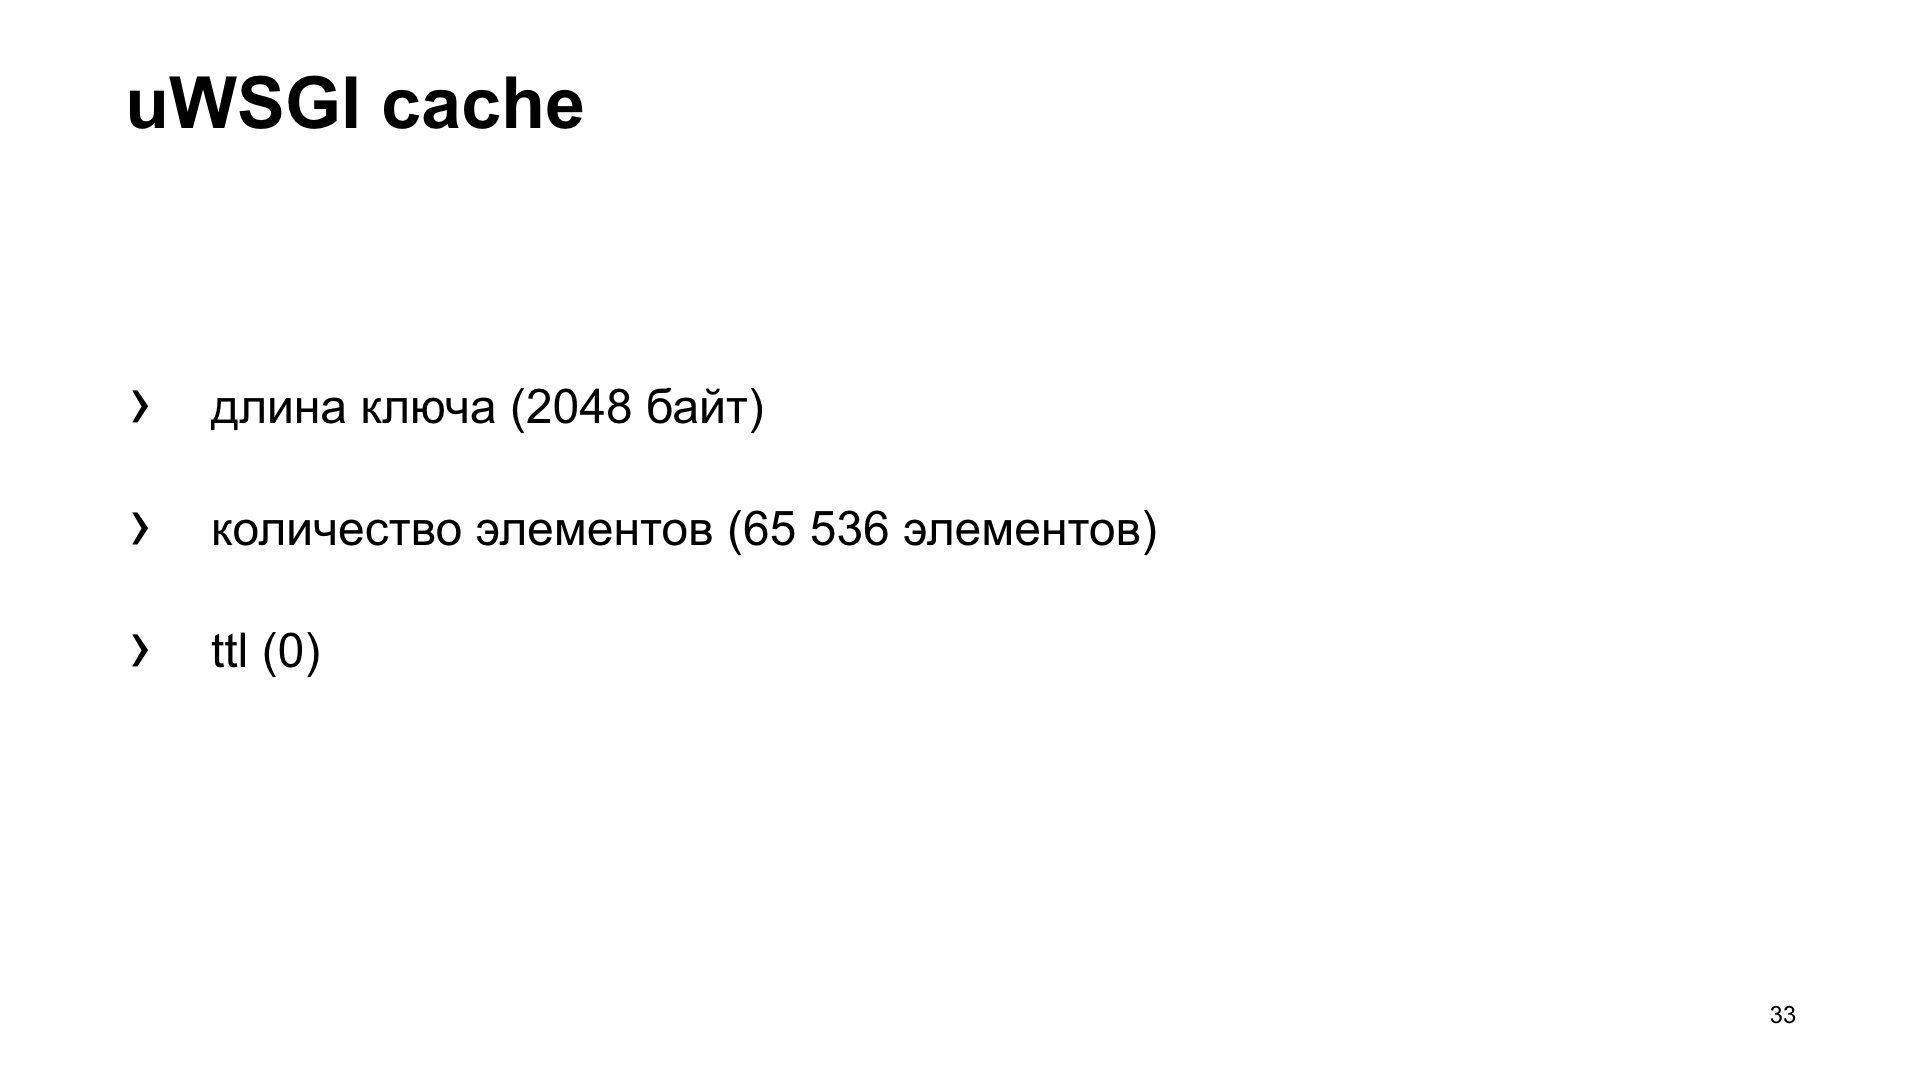
But since this is a cache, there is a well-known second problem: how to name a variable and how to invalidate the cache? In our case, let's see what the default cache settings are. It has restrictions on the length of the key. In our case, this is the name of the metric. The default is 2048 bytes. And you can increase the config if necessary. The number of elements that it stores by default is 65,536. It seems that this value should be enough for everyone. It is unlikely that anyone will collect such a number of metrics from their application.
And ttl by default is 0. That is, the values of the stored caches are not time-invalidated. So, we can get them from the cache and send them to the metrics system.

Again, the option is an application that uses the uWSGI box.
Here are the results of shelling this application.

The result without metrics, if with uWSGI, with a stretch it looks almost the same.
As you can see, in the case of uWSGI we lose only 5% of the performance relative to the "vanilla" version without metrics. Other options have a fairly significant drawdown, and therefore, as a result of spectator voting, uWSGI wins.
How did we apply this? We wrote a small library, a wrapper around uWSGI. For example, we install an instance of our library and here we add the metric “Database query time” as an example.

We are also interested in monitoring how the cache works. We simply redefine the methods of the client memcache, save time for receiving data, time for loading and the number of cache hit and cache miss.

How do we do this inside the library? To ship the values, we get the names of the keys stored in the cache, run through them and simply give them in the desired format to the endpoint.
As a result, we get a graph, in this case it is the 99th percentile of the cache access time, reading and writing.

Or, as an option, the number of third-party service requests to our API.

We have stories of both failure and success. We began to add more and more metrics and saw a drop in performance. The metrics themselves helped us. If you collect metrics, then you can see that something is wrong. Therefore, I also recommend that you retrospectively look at the metrics that you have accumulated over the week, month, six months. And see what trend your application is showing in which indicators. We realized that we began to rest on the calculation of metrics.
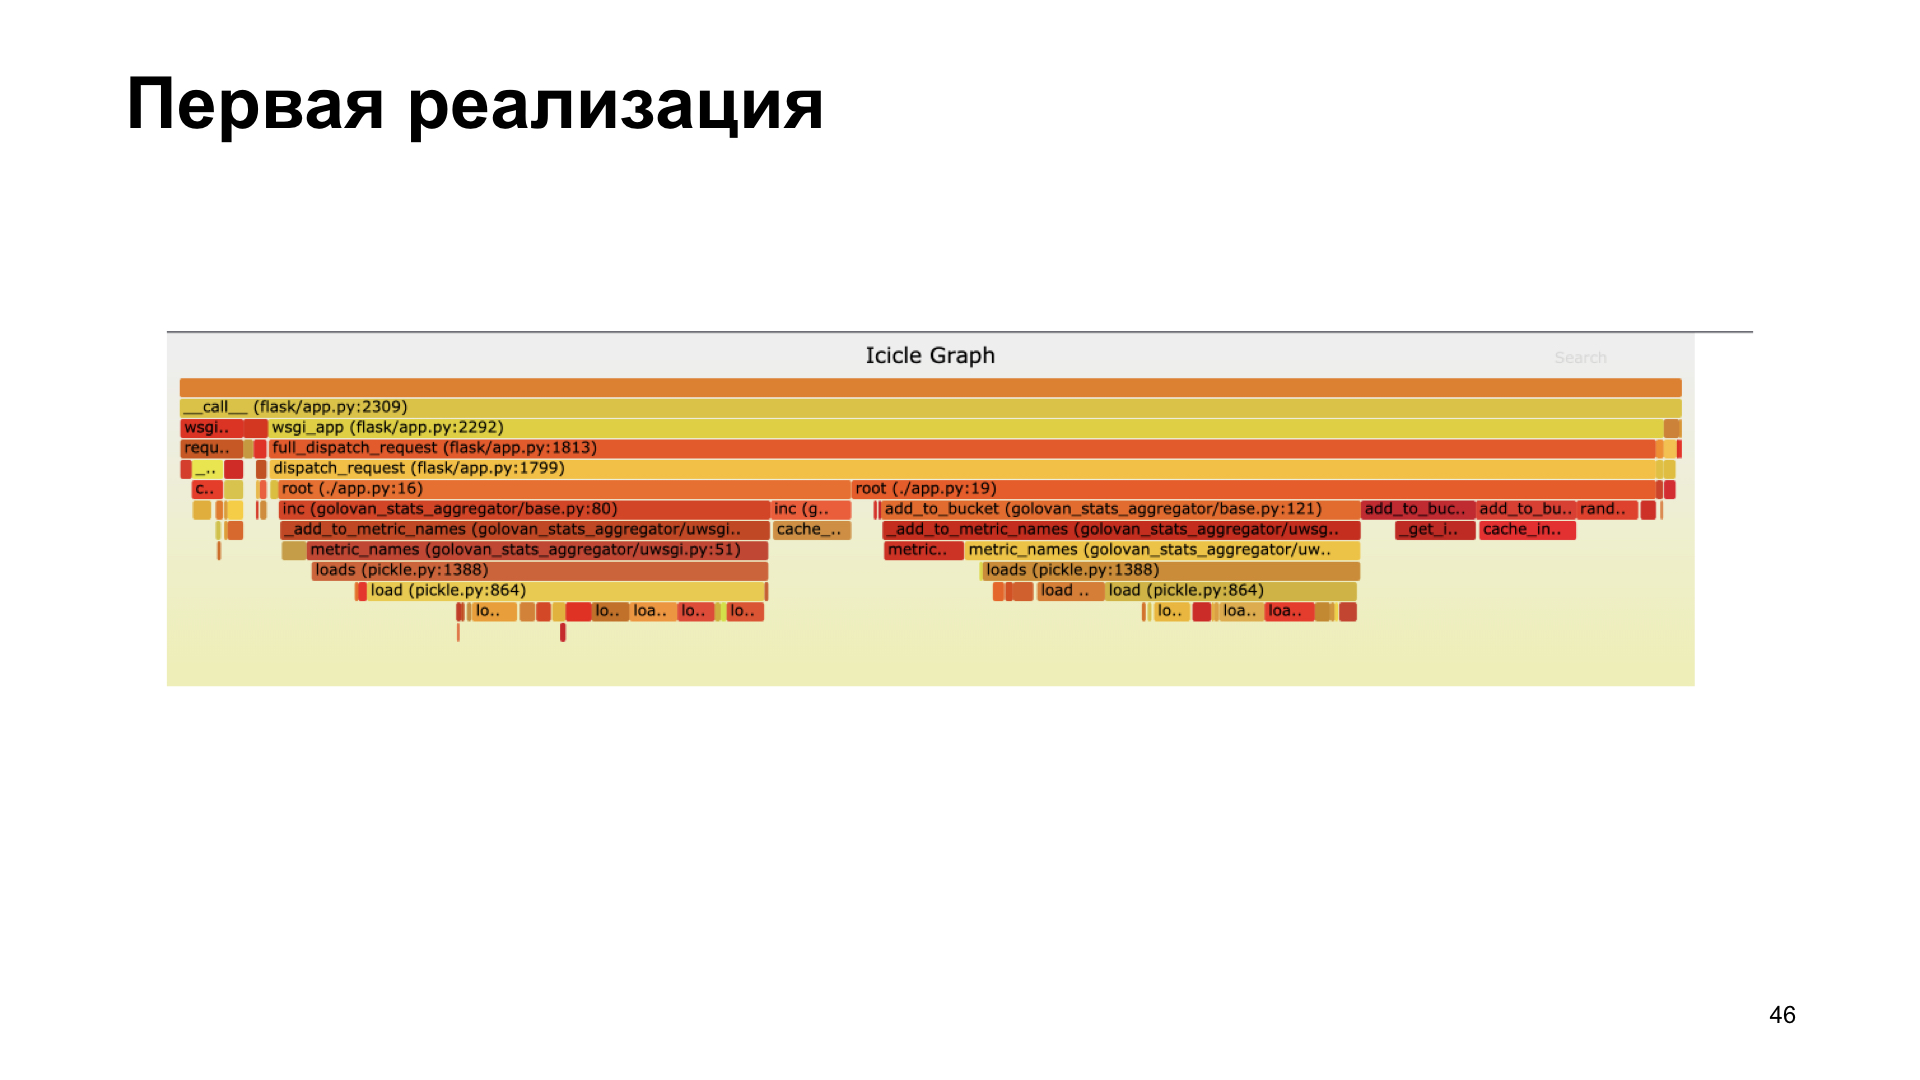
Profiling helped us. Here you see a flamegraph, it visually shows us how many calls of certain functions took during the process, which calls made the greatest contribution in time. We realized that we did not do very well in the first version using pickle. Inside our library, she spent a considerable amount of time pickling.

We refused pickling, transferred to cashe inc, measured everything, it became faster.

In the new implementation, we spend most of our time working with the cache, not pickling.

Why am I telling you this? I urge you to start collecting metrics, looking at metrics, and focusing on metrics. When choosing a possible metric collection option, compare the options, see which one is best for you. And, of course, profiling is good. If you see that something is wrong, something is slowing down - profile.
Thanks to all! As I promised, references:
The story I prepared was about uWSGI. This is a multifunctional web application server, and every modern application is accompanied by metrics. I tried to show how the capabilities of uWSGI can help in collecting metrics.
- Hello everyone, I'm glad to welcome you all to the walls of Yandex. It's nice that so many people came to see my and other reports, that so many people are interested and live in Python. What is my report about? It is called "uWSGI to help metrics." I’ll tell you a little about myself. I've been doing Python for the past six years, I work in the Yandex.Connect team, we are writing a business platform that provides Yandex services developed internally for outside users, that is, for everyone. Any person or organization can use the products developed by Yandex for themselves, for their own purposes.
We’ll talk about metrics, how to get these metrics, how we use in our team uWSGI as a tool to get metrics, how it helps us. Then I’ll tell you a little optimization story.
A few words about metrics. As you know, the development of a modern application is impossible without tests. It is strange if someone develops their applications without tests. At the same time, it seems to me that the operation of a modern application is impossible without metrics. Our application is a living organism. A person can take some metrics, such as pressure, heart rate, - the application also has indicators that we are interested in and would like to observe. Unlike a person who usually takes these vital metrics when they feel bad, in the case of an application, we can always take them.
Why are we shooting metrics? By the way, who uses metrics? I hope that after my report, there will be more hands, and people will be interested and start collecting metrics, they will understand that this is necessary and useful.
So why do we need metrics? First of all, we see what is happening with the system, we highlight some normative indicators for our system and understand whether we go beyond these indicators in the process of the application or not. You can see some abnormal behavior of the system, for example, an increase in the number of errors, understand what is wrong with the system, before our users and receive messages about incidents not from users, but from the monitoring system. Based on metrics, we can set up alerts and receive sms, letters, calls, as you like.
What, as a rule, are metrics? These are some numbers, perhaps a counter that grows monotonously. For example, the number of requests. Some unit values that change in time increase or decrease. An example is the number of tasks in a queue. Or histograms - values that fall into some intervals, the so-called baskets. As a rule, it is convenient to read this time-related data and find out in which time interval how many values fit.
What kind of metrics can we take? I will focus on the development of web applications, as it is closer to me. For example, we can shoot the number of requests, our endpoints, the response time of our endpoints, the response codes of related services, if we go to them and we have a microservice architecture. If we use the cache, we can understand how efficient the miss or hit cache is, understand the distribution of response times of both third-party servers, and, for example, the database. But in order to see the metrics, you need to somehow collect them.
How can we collect them? There are several options. I want to tell you about the first option - a push scheme. What does it consist of?
Suppose we receive a request from a user. Locally, with our application, we install some kind, usually a push agent. Let's say we have a Docker, there is an application in it, and a push agent still stands in parallel. The push agent receives the metric value locally from us, somehow it buffers them, makes batches and sends them to the metrics storage system.
What is the advantage of using push schemes? We can send some metric directly from the application to the metric system, but at the same time we get some kind of network interaction, latency, overhead to collect metrics. In the case of a local push client, this is leveled.
Another option is a pull scheme. With the pull scheme, we have the same scenario. A request from the user comes to us, we somehow keep it at home. And then with a certain frequency - once a second, once a minute, as it suits you - the metrics collection system comes to a special endpoint of our application and takes these indicators.
Another option is the logs. We all write logs and send them somewhere. Nothing prevents us from taking these logs, somehow processing them and getting metrics based on the logs.
For example, we write the fact of the user’s request in the log, then we take the logs, hop-hop, counted. A typical example is ELK (Elasticsearch, Logstash, Kibana).
How does it work with us? Yandex has its own infrastructure, its own metrics collection system. She expects a standardized response for a handle that implements a pull scheme. Plus we have an internal cloud where we launch our application. And all this is integrated into a single system. When uploading to the cloud, we simply indicate: "Go to this pen and get metrics."
Here is an example response for the pull scheme that our metric collection system expects.
For ourselves in the team, we decided to choose a more suitable way for us, to highlight several criteria by which we will choose the best option for us. Efficiency is how quickly we can get in the metric system a reflection of the fact of any action. Dependence - whether we need to install additional tools or somehow configure the infrastructure to get the metric. And versatility - how this method is suitable for different types of applications.
That's what we got in the end. Although, according to the criteria of efficiency and versatility, the push scheme will win. But we are developing a web application, and our cloud already has a ready-made infrastructure for working with this task, so we decided to choose a pull-scheme for ourselves. We’ll talk about her.
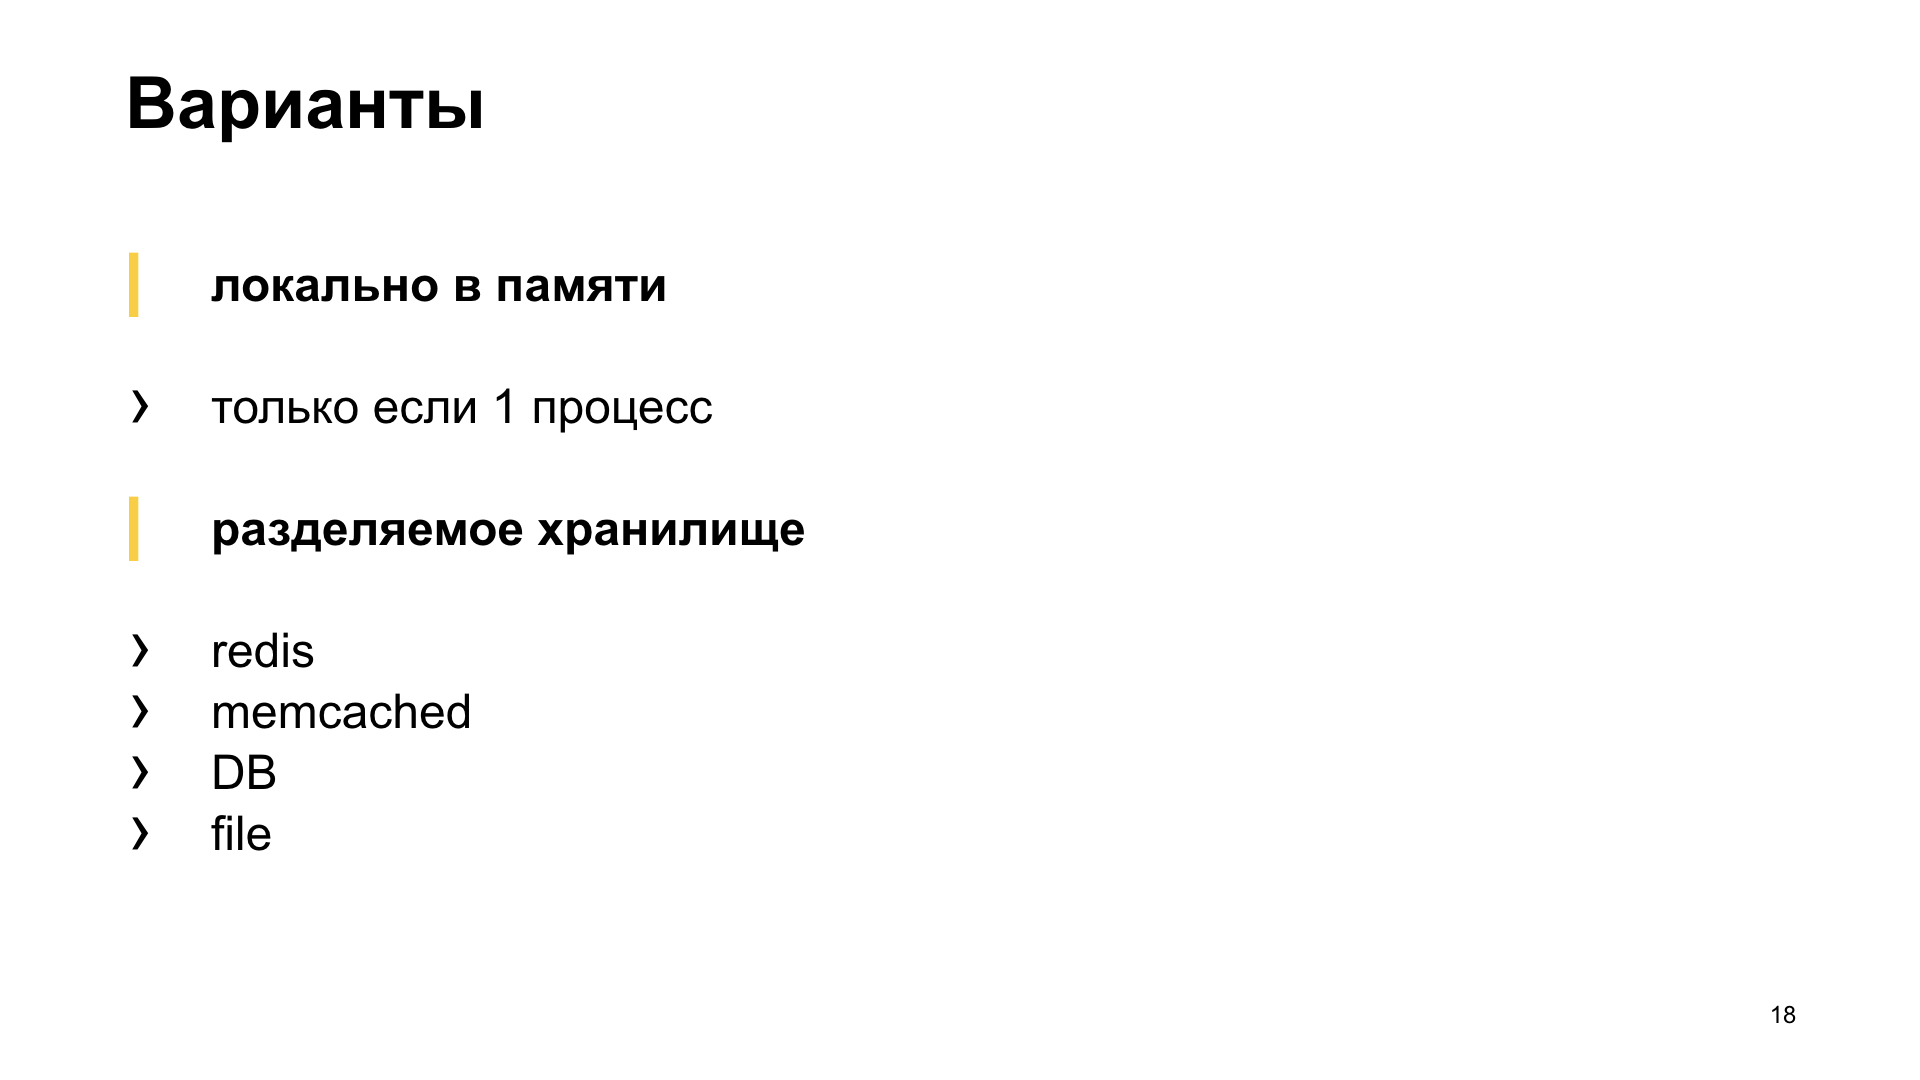
In order to give something to the pull-scheme, we need to pre-aggregate it somewhere, save it. Our monitoring system goes into pull-handles every five seconds. Where can we save? Locally in your memory or in a third-party storage.
If we save locally, then as a rule, this is suitable for the case with one process. And we, in our uWSGI, run several processes in parallel. Or we can use some kind of shared storage. What comes to our mind with the word “shared storage”? This is some kind of Redis, Memcached, relational or non-relational databases, or even a file.
About uWSGI. Let me remind those who use it little or rarely: uWSGI is an application web server that allows you to run Python applications under you. It implements the interface, the uWSGI protocol. This protocol is described in PEP 333, who are interested, you can read.
It will also help us to choose the best Yandex.Tank solution. This is a load testing tool, allows you to shell our application with various load profiles and builds beautiful graphics. Or it works in the console as you like.
The experiments. We will create a synthetic application for our synthetic tests, we will shell it with a tank. The uWSGI application will have a simple conflict with 10 workers.
Here is our Flask app. The payload that our application performs, we will emulate an empty loop.
We fire, and Yandex.Tank gives us one of these graphs. What is he showing? Percentiles of response times. The slant line is the RPS that are growing, and the histograms are what percentiles our web server fit into under such a load.
We will take this option as a reference and look at how different options for storing metrics affect performance.
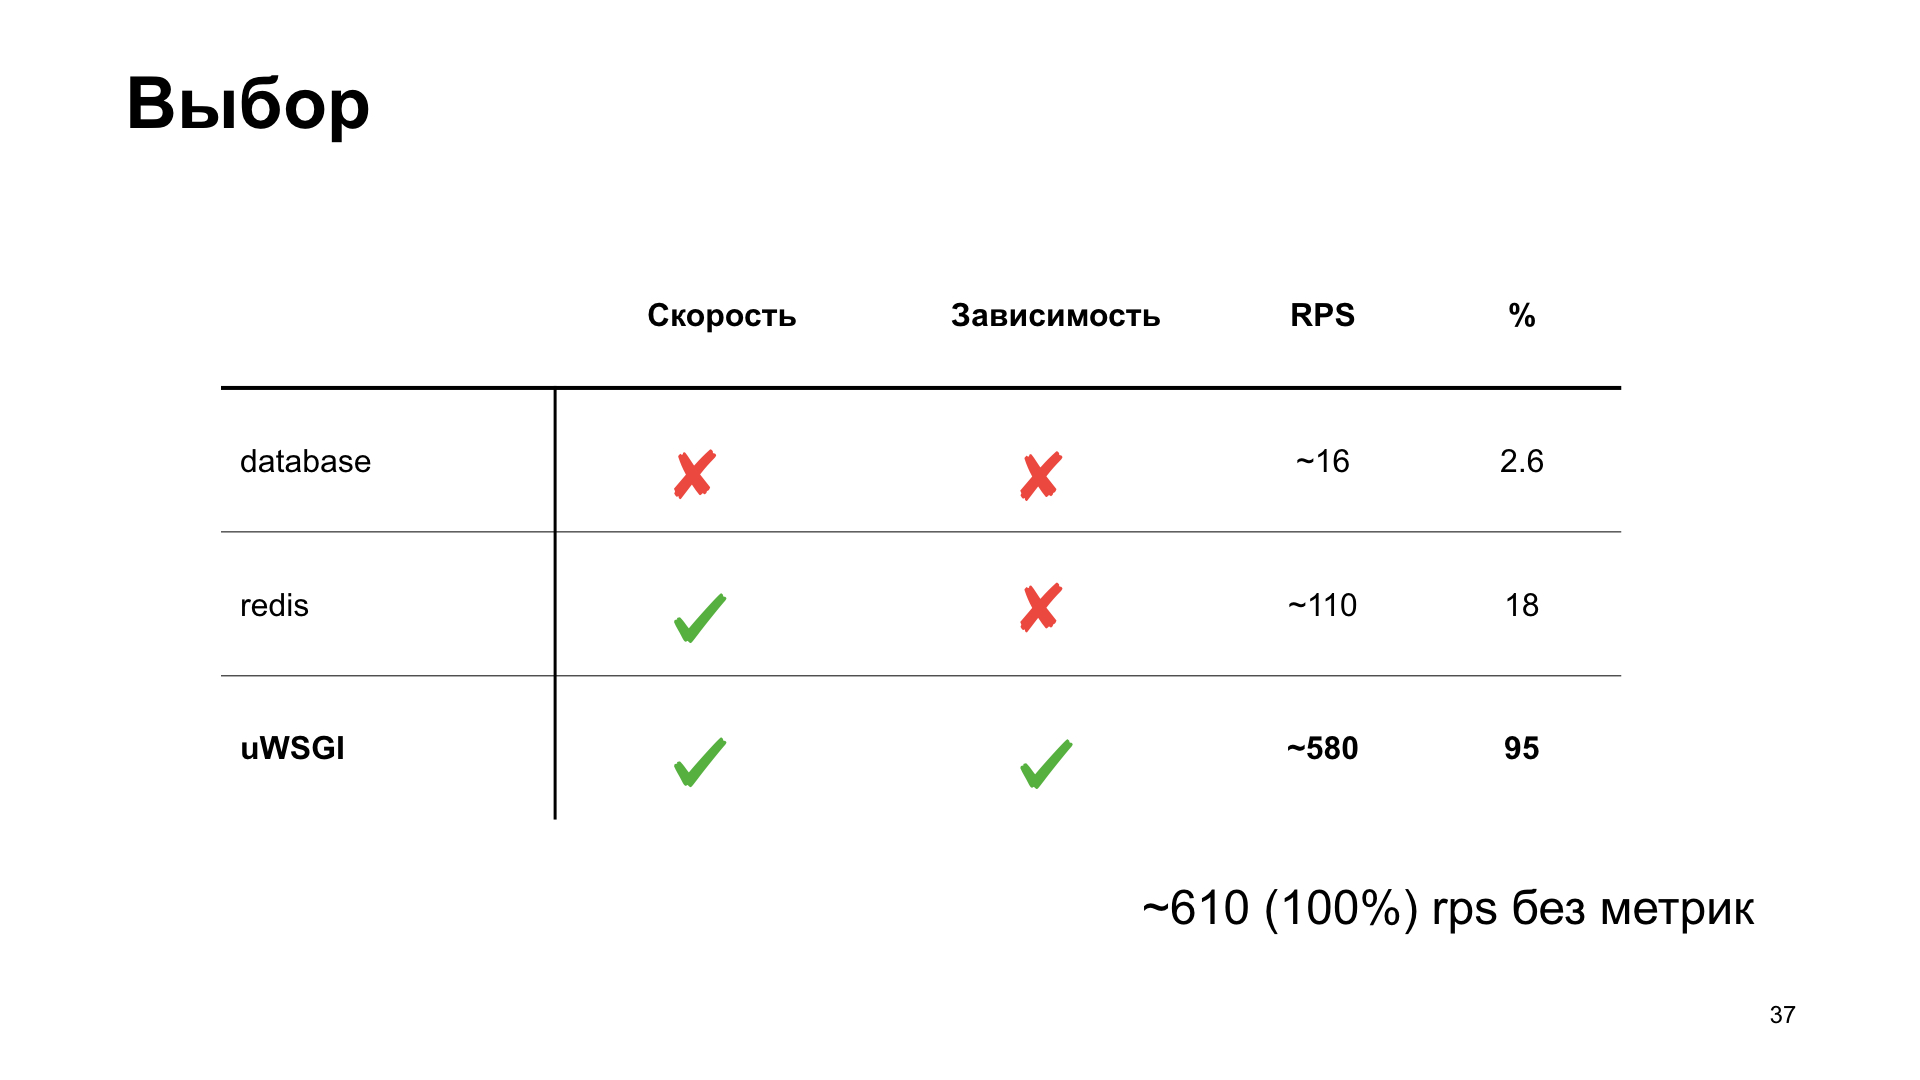
The simplest option is to use PostgreSQL. Because we work with PostgreSQL, we have it. Let's use what is already ready.
Let's say we have a label in PostgreSQL in which we simply increment the counter.
Already on small amounts of RPS we see a strong performance degradation. It can be said simply huge.
The next option is Redis. But here we are doing smarter: we install it locally and go to it not over the network, but through the Unix socket. Also increase the counter.
We get the histogram of response times at the output. We see that things are better here, but at some point we run into a shelf, and then productivity is no longer growing. This option seems more optimal, but we want to do even better.
Here uWSGI, a real combine, comes to our aid. There are many different modules. Mule for running subprocesses, caching framework, cron, metrics subsystem and alerting system. "Subsystem metrics system" - sounds promising.
She knows how to add some kind of metrics, increase the counter, decrease the counter, multiply, divide - whatever your heart desires.
The only metric subsystem is not able to give exactly the metrics built into it.
Why is this important to us? As you saw earlier, we have a handle for giving statistics in a specific format, and several workers are running. We don’t know which of the workers will receive the request, but in order to return all the metrics, we need to create some kind of registry of names and somehow scramble it between the processes. This is some big deal, I want to avoid this. What else do we have?
Of course, cache subsystem. And here we see: he can do almost the same thing, and he is also able to give the names of keys stored in the cache. This is what you need.
Cache subsystem is a cache built into uWSGI. A fast and thread-safe module, which is an ordinary key-value storage.
But since this is a cache, there is a well-known second problem: how to name a variable and how to invalidate the cache? In our case, let's see what the default cache settings are. It has restrictions on the length of the key. In our case, this is the name of the metric. The default is 2048 bytes. And you can increase the config if necessary. The number of elements that it stores by default is 65,536. It seems that this value should be enough for everyone. It is unlikely that anyone will collect such a number of metrics from their application.
And ttl by default is 0. That is, the values of the stored caches are not time-invalidated. So, we can get them from the cache and send them to the metrics system.
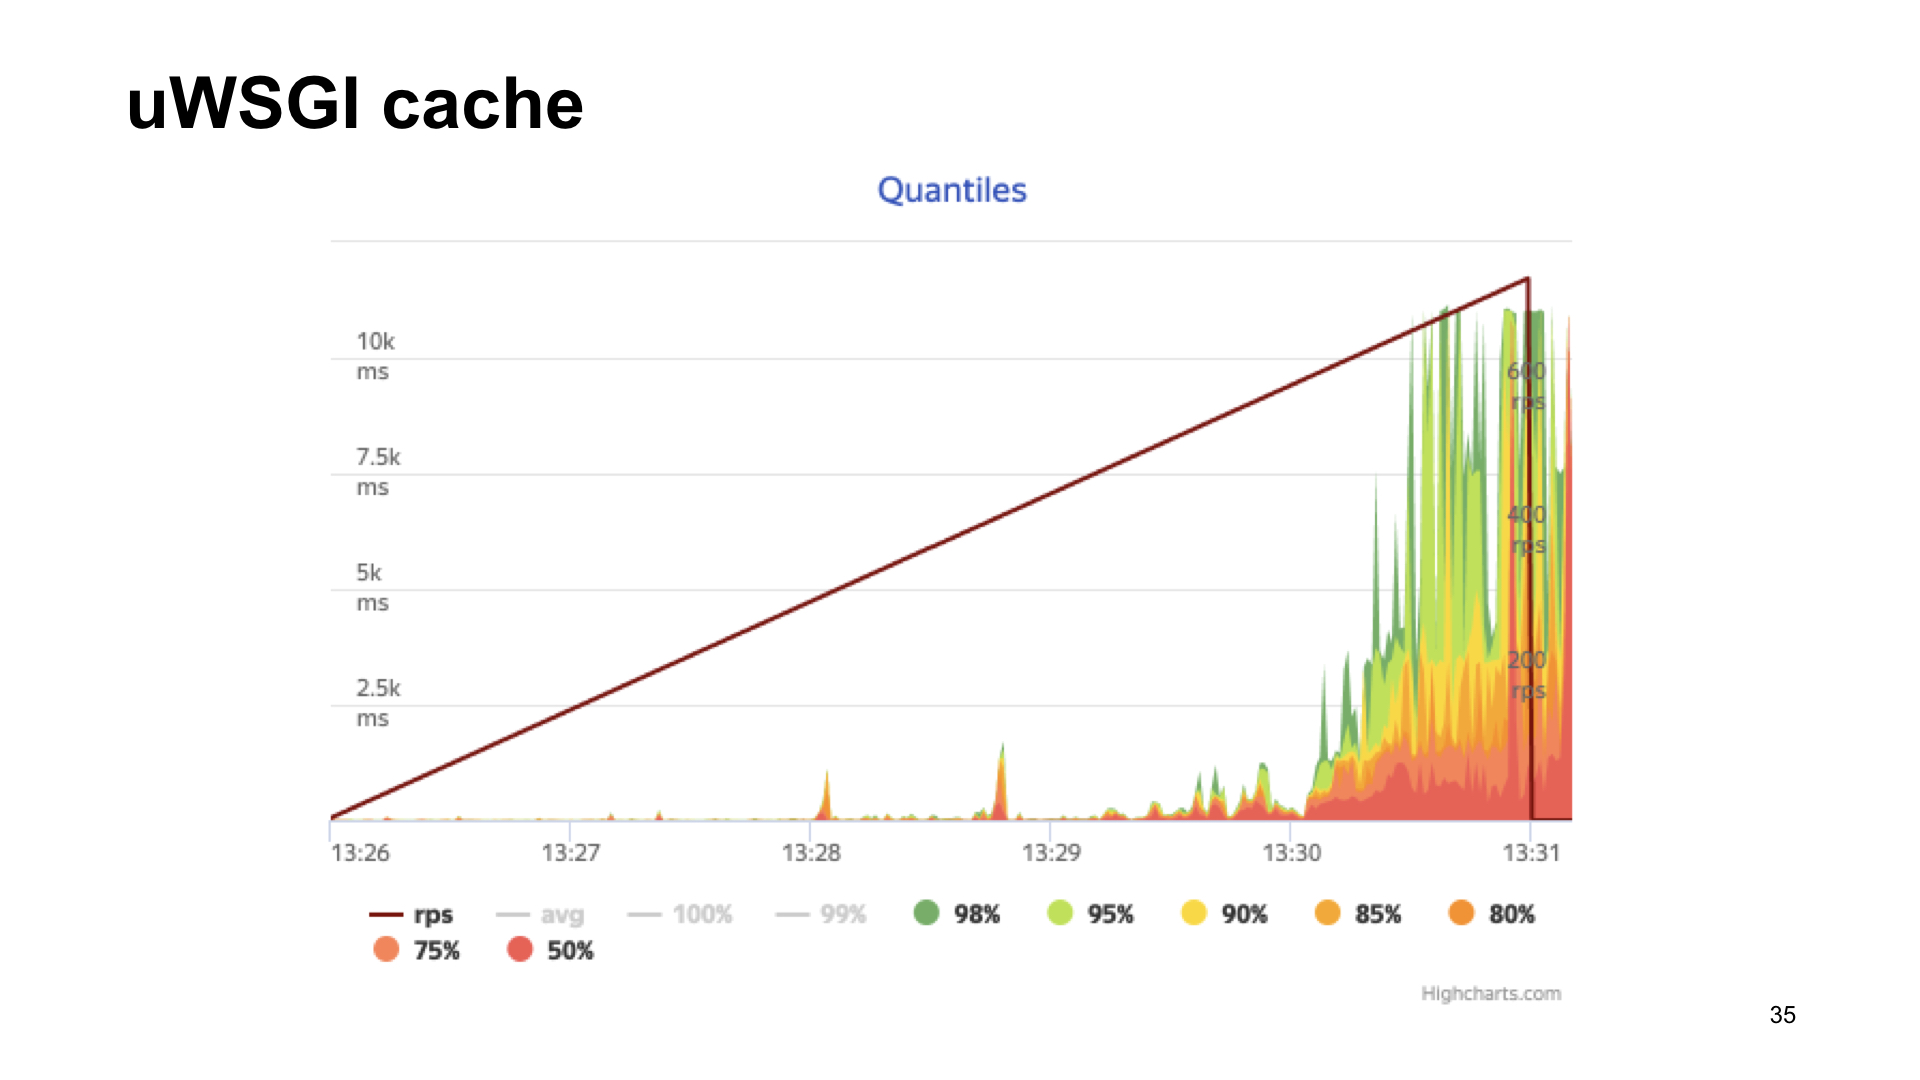
Again, the option is an application that uses the uWSGI box.
Here are the results of shelling this application.
The result without metrics, if with uWSGI, with a stretch it looks almost the same.
As you can see, in the case of uWSGI we lose only 5% of the performance relative to the "vanilla" version without metrics. Other options have a fairly significant drawdown, and therefore, as a result of spectator voting, uWSGI wins.
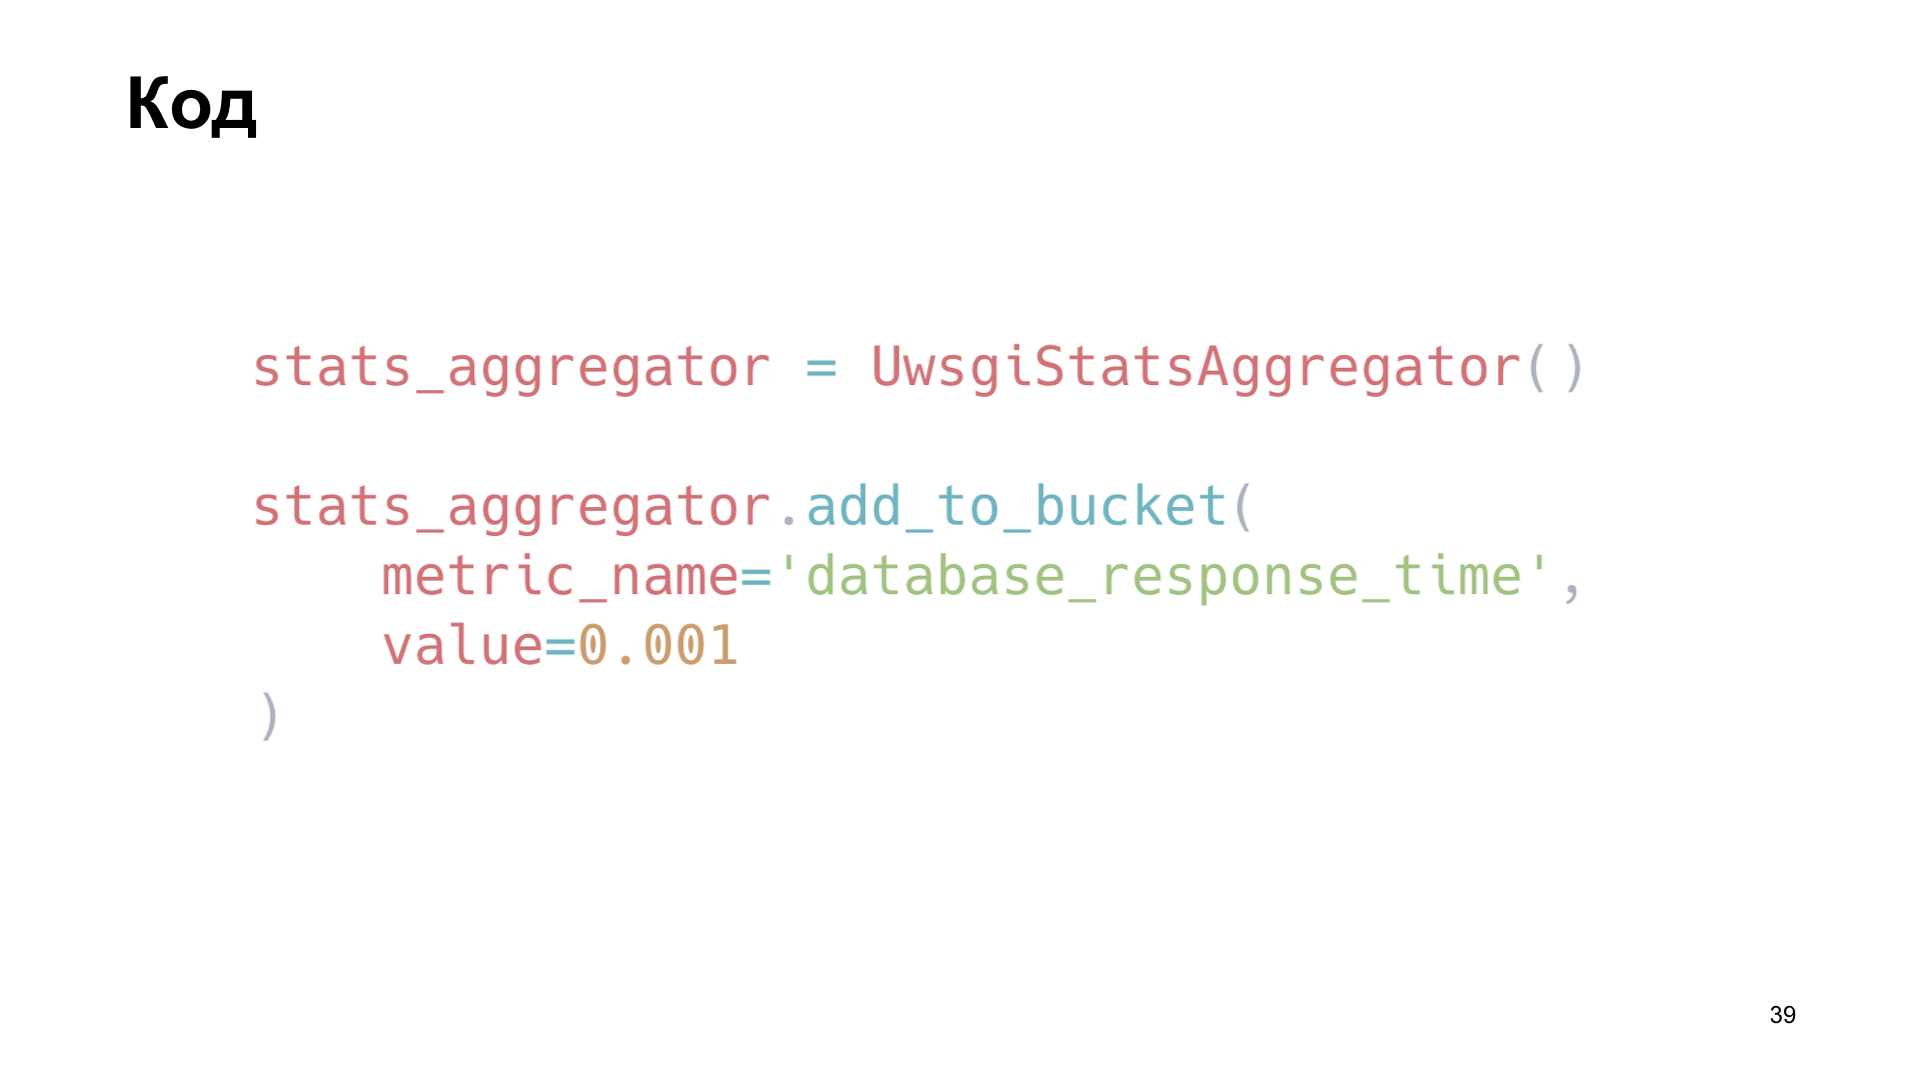
How did we apply this? We wrote a small library, a wrapper around uWSGI. For example, we install an instance of our library and here we add the metric “Database query time” as an example.
We are also interested in monitoring how the cache works. We simply redefine the methods of the client memcache, save time for receiving data, time for loading and the number of cache hit and cache miss.
How do we do this inside the library? To ship the values, we get the names of the keys stored in the cache, run through them and simply give them in the desired format to the endpoint.
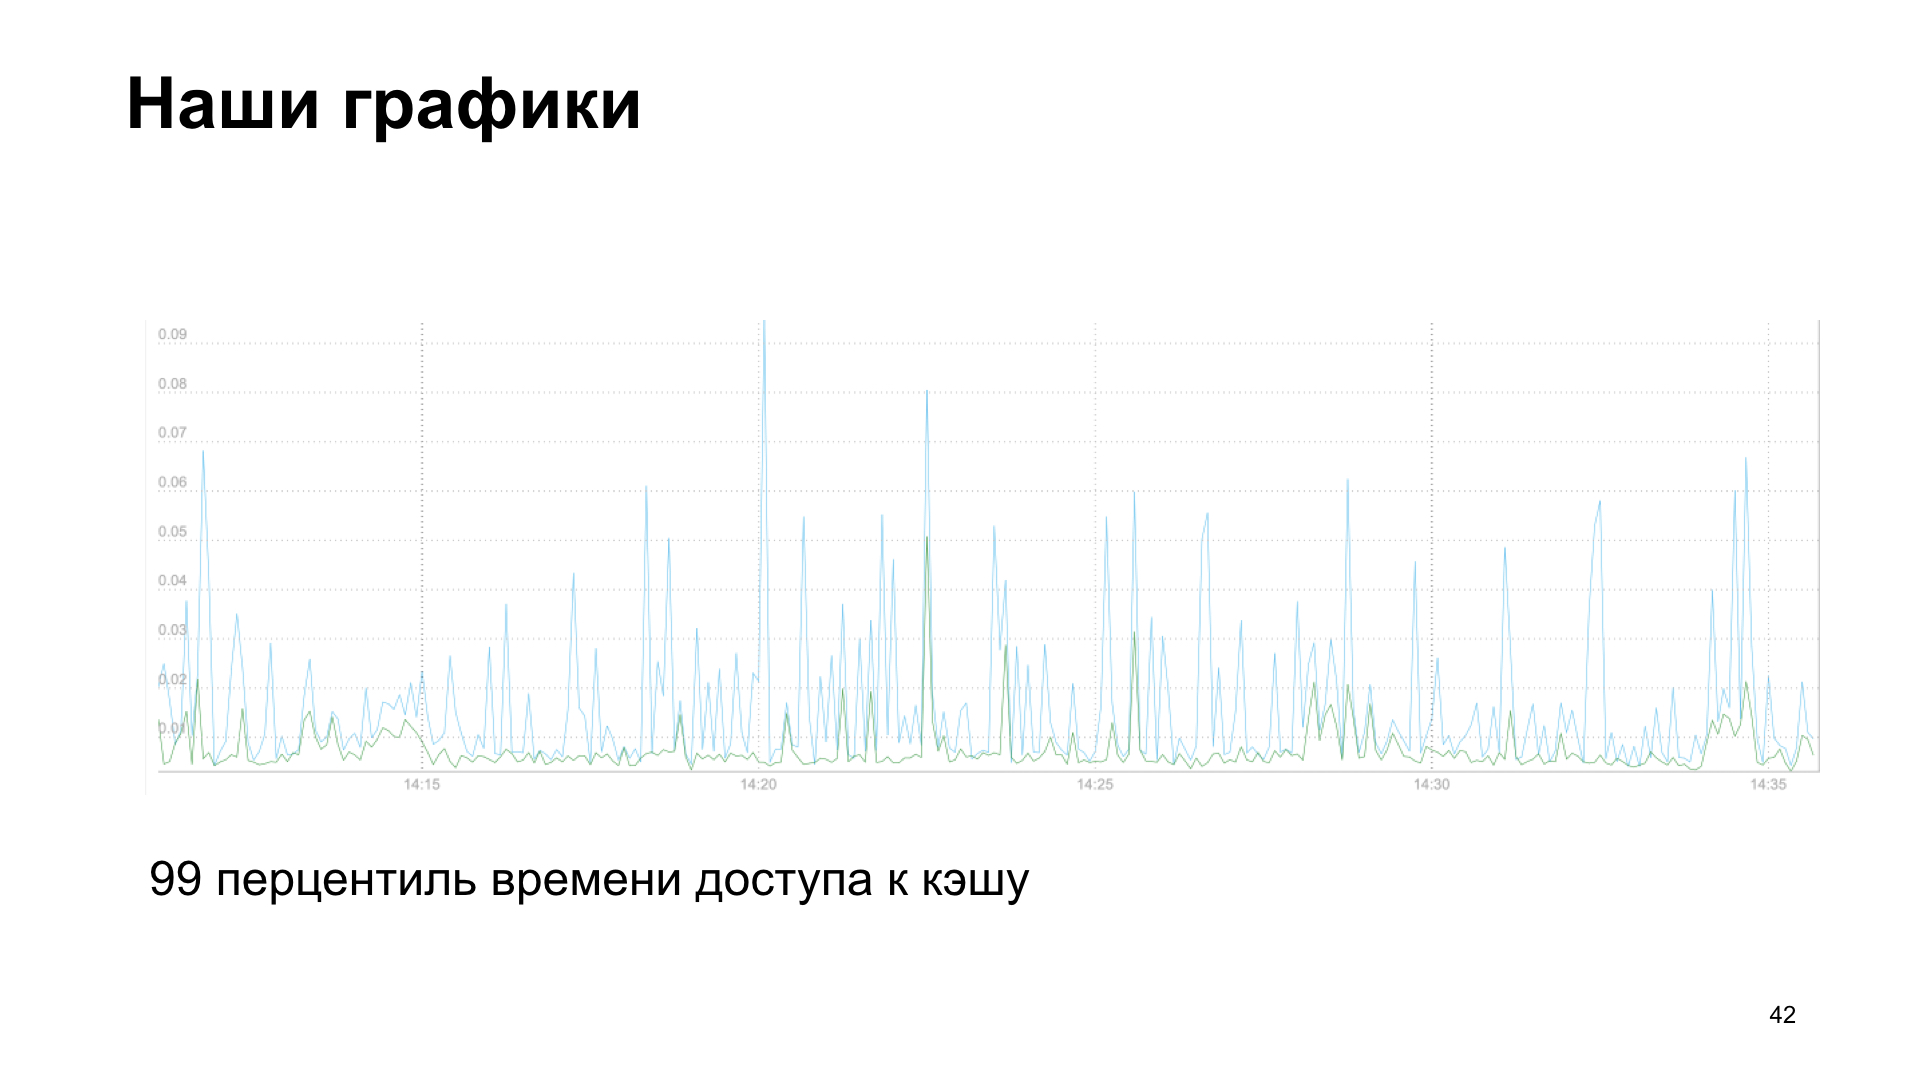
As a result, we get a graph, in this case it is the 99th percentile of the cache access time, reading and writing.
Or, as an option, the number of third-party service requests to our API.
We have stories of both failure and success. We began to add more and more metrics and saw a drop in performance. The metrics themselves helped us. If you collect metrics, then you can see that something is wrong. Therefore, I also recommend that you retrospectively look at the metrics that you have accumulated over the week, month, six months. And see what trend your application is showing in which indicators. We realized that we began to rest on the calculation of metrics.
Profiling helped us. Here you see a flamegraph, it visually shows us how many calls of certain functions took during the process, which calls made the greatest contribution in time. We realized that we did not do very well in the first version using pickle. Inside our library, she spent a considerable amount of time pickling.
We refused pickling, transferred to cashe inc, measured everything, it became faster.
In the new implementation, we spend most of our time working with the cache, not pickling.
Why am I telling you this? I urge you to start collecting metrics, looking at metrics, and focusing on metrics. When choosing a possible metric collection option, compare the options, see which one is best for you. And, of course, profiling is good. If you see that something is wrong, something is slowing down - profile.
Thanks to all! As I promised, references:
- Yandex.Tank ,
- py-spy profiling utility written in Rust,
- Report by Alexander Koshelev on the use of uWSGI.
All Articles