Analysis: how to make money on investments in stock indexes and ETFs
Image: Pexels
In articles and programs on economic topics, you can often hear phrases like “the S & P500 index updated its historical maximum” or “the RTS index collapsed by 200 points during trading.” Today we’ll talk about what is really the meaning behind such information, and how indices are used in real investments.
What are stock indices and why are they needed
At its core, an index is an indicator of price changes for a particular group of securities. Roughly speaking, this is a “basket” of stocks united on some basis.
The set of securities included in the list on the basis of which the index is calculated determines what information can be obtained by observing the dynamics of this index. Typically, the purpose of compiling a stock index is to create an indicator with which you can understand the general direction and "speed" of the movement of stock quotes of companies in a particular industry.
Studying the dynamics of indices helps participants in exchange trading understand the impact on quotes of certain events - for example, in the event of rising oil prices, it is logical to expect an increase in the value of shares of companies from the sphere of extraction and processing of energy resources.
At the same time, the shares of different companies even from the same industry are growing at different speeds, and may not grow at all or even lose in price - the index helps to understand the general trend of the market segment movement without the need to assess the position of each particular company. Accordingly, it is possible to compare different sectors of the economy by comparing the corresponding exchange indices.
What indexes exist and how are they calculated
Each index is designed to solve a specific problem. These tools are classified according to various criteria - by the calculation method (component weighing), families and even by author.
One of the oldest methods for calculating indices is the arithmetic mean method. According to it, for example, the well-known Dow Jones Industrial Average index was calculated. However, in practice, in modern realities, it is inefficient - companies can issue a different number of shares, some may have millions, and some may have tens of thousands. This makes the value of the index calculated by this technique irrelevant.
In the case of the Dow Jones, the divisor for calculating the arithmetic average was initially equal to 11 - the number of shares included in the index. Now, a scalable average is used for calculation - the sum of prices is divided by a divisor, which changes each time the shares included in the index are split or merged. This allows, even with changes in the structure of shares included in the index, to maintain the ability to compare them.
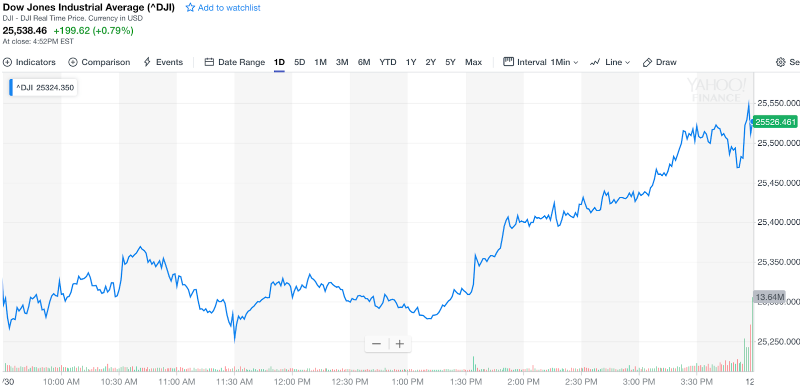
Dow Jones Industrial Average Index Chart
The advantage of this approach is the ease of calculation, but there are also disadvantages. The main one is the lack of weights. The most expensive stocks most affect the index. This introduces distortions, since the share price is not directly related to the company's capitalization. A company with cheaper stocks and can be significantly more expensive than an organization with expensive securities.
There are also indices calculated using the arithmetic average formula weighted by the growth rate of stock prices - for example, the composite Index Value Line Composite Aithmetic Index (combines 1700 stocks with NYSE and AMEX). The weight is calculated as follows - the price of each share included in the index is multiplied by a coefficient corresponding to its share in the share capital of the issuing company. This method eliminates the effect of price dispersion on specific stocks.
Another method of calculating indices was called the geometric mean of the growth rate of stock prices. The group of indexes of this type includes the FT 30 index created by the Financial Times and the Value Line Composite Geometric Index (combines 1700 shares).
Most foreign and Russian stock indices are based on the value index formula - this includes the indices of Nasdaq, S&P, DAX (Germany), CAC (France), RTS and MICEX indices.
Index Families
Some compilers of indexes are not limited to one index, but create a whole family of similar tools. For example, the rating agency Standard & Poor's (S&P) calculates a number of indices, one of the most popular is the S&P 500, which unites the 500 most capitalized US companies (80% are traded on the NYSE, 20% on the AMEX
The Nasdaq exchange has its own index family, for example, the NASDAQ Composite combines all the companies in the listing of the exchange, and the NASDAQ National Market combines the American companies. Nasdaq indicators take into account the behavior of more than 4,500 US and foreign companies
Among the well-known European index families - indicators of the German stock market (DAX 30, Dax Price Index, DAX 100 Sector Indexes, etc.), French CAC - they differ in the number of shares included in them (40, 80, 120, etc. .).
In Russia, the Moscow Exchange offers its own indices. The most famous are the MICEX and RTS indicators, but there is also a blue chip index, second-tier stock indices and a broad market.
What indexes show
Sectoral stock indices are needed in order to create hypotheses about the dynamics of price movements of different companies in the same industry that did not even fall into the index itself. Such indices help investors evaluate the prospects of investments in companies of a particular sector of the economy at a particular point in time.
An example of industry indices is the Dow Jones family, which includes:
- DJIA Industrial Index - calculated on the basis of stock prices of major companies from leading US industries.
- DJTA Transport Index - covers the shares of major US transport companies.
- DJUA Communal Index - shares of electric and gas supply companies. engaged in gas and electricity supply.
There are also specialized exchanges for companies united on one basis or another. For example, exchanges where technology companies are traded, like Nasdaq in the USA.
Often, indices are compiled on a regional basis - for example, you can make lists of shares of companies representing a particular country or group of countries (for example, the European Union). Like industry indices, these indicators help investors better understand the situation in the markets of specific regions and countries,
An example of a regional index is Morgan Stanley Capital International (MSCI). There are indices for individual markets - developed and emerging. For example, the MDCI Developed Market Index includes shares of companies from more than two dozen countries in which stock markets are recognized as developed, and the MSCI Emerging Market Index includes shares of companies from developing countries.
How investors use indexes
There are several practical uses for the information displayed by stock indices.
First of all, their analysis gives investors an idea of the general dynamics in certain markets (industries, countries, etc.) and investor sentiment. If the indices of a certain group are growing, then investors are looking positively at the prospects for investing in the shares of companies in these industries. Such information can be used for speculative transactions.
In addition, there are derivatives that are based on the index itself - for example, there is futures on the RTS index. Most often, such contracts are used to hedge risks.
In addition to the index value itself, information is published on the total turnover of the shares of its constituent companies. Changing these numbers allows us to judge the general activity of traders in the market when dealing with securities of a certain type.
In the case of country indices, their study over a long period of time helps to get an idea of the investment climate in a particular country.
How else to make money on the index: working with ETF
Investing directly in indices is an unrealistic task for private investors, since they include many companies whose stocks can be expensive. To use the conditional S & P500, you will need to buy the shares of all companies in the appropriate proportion, it takes millions of dollars.
In order to use indexes without the need for such huge investments, the ETF tool ( Exchange Traded Funds ) was created. In fact, these are foreign exchange investment funds, which are a portfolio of shares or other assets that completely repeat the composition of the target index. For example, ETF with ticker SPY reflects the dynamics of stocks of the S & P500 index. Shares of ETFs themselves are also traded on an exchange.
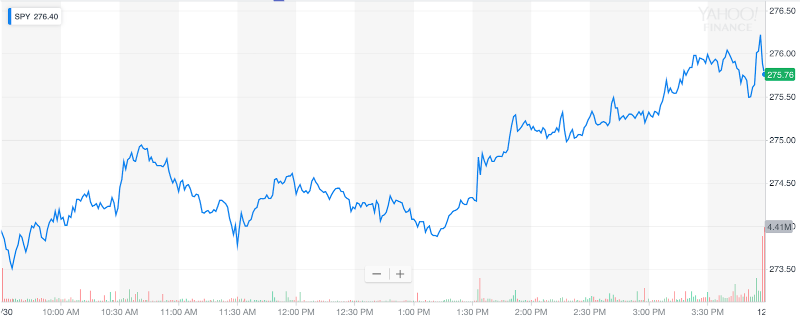
ETF SPY Chart
The main advantage of working with ETFs is simplicity. They are traded as ordinary stocks, a regular brokerage account is suitable for their purchase, which can be opened online through the State Services , their use does not require significant initial investments. The investor has a full understanding of which securities are included in the ETF - just look at the index on which this financial instrument is based.
Since the spring of 2018, ETF trading on RTS indices and Eurobonds has been on the Moscow Exchange stock market. These and other ETFs can be used by ITI Capital clients to implement investment strategies.
Useful links on the topic:
All Articles