Review of AMD Ryzen Threadripper 1950x and 1920x: CPU on steroids

At the beginning of 2000, the Great War of Frequencies was fought. A manufacturer capable of driving a maximum of cycles per second through its processor had an obvious advantage over its competitors. This led to the creation of some very hot chips, whose architecture was eventually forgotten in the name of something more reasonable. 10-15 years have passed, a new war is rattling around us: "The War of the Cores". How many CPU cores with high-speed interprocessor interaction can be placed in a consumer processor? Most recently, the answer was 10, and now AMD is breaking into the market with the new 16-core Theadripper processors. We got both 1950x and 1920x to fry them thoroughly in the name of a fresh review.
New world order
In 2017, AMD released a new microprocessor architecture - Zen. The architecture was used in the new Ryzen processor series with the obvious goal of cutting off part of the market from Intel's high-end desktop PC solutions. Three members of the Ryzen 7 family have 8 cores with hyperthreading technology and show a very good combination of performance and price, sometimes showing a result comparable to twice as expensive Intel processors. They are followed by four Ryzen 5 processors with a price approximately equal to the quad core i5 line. For the same money, AMD offers a processor with twelve threads, which is three times more than that of the Core i5. Finally, Ryzen 3 is priced at about $ 120, acting as a direct competitor to the Core i3, while having twice as many cores as the Intel product. Now we see that AMD has officially introduced the AMD EPYC family of server processors, offering up to 32 cores; over the next few months, the product will hit the market, but for now OEMs are testing processors and measuring their performance.
- The AMD Zen and Ryzen 7 Review: A Deep Dive on 1800X, 1700X and 1700
- The AMD Ryzen 5 1600X vs Core i5 Review: Twelve Threads vs Four at $ 250
- The AMD Ryzen 3 1300X and Ryzen 3 1200 CPU Review: Zen on a Budget
- Intel's Skylake-SP Xeon versus AMD's EPYC 7000 - The Server CPU Battle of the Decade
Aside from the products listed, there is the AMD's Ryzen Threadripper family, or simply the Threadripper. These processors have the same design as the server AMD EPIC CPU, but are adapted for desktop PCs. The first two processors are 1950X and 1920X, with 16 and 12 cores, respectively. They were followed by an 8-core 1900X, released August 31, promises to appear in 1920, which the truth has not yet been announced. All these chips are installed in a 4094-pin TR4 type LGA socket. The socket is identical to the SP3 socket used for EPIC (although the sockets are not interchangeable), and surpasses the 1331-pin AM4 PGA type socket used for Ryzen 7/5/3 processors.

* Latest information from AMD, according to our data
** Unannounced product, specifications subject to change.
If Ryzen 7 aims to take away part of the market from Intel's High-End Desktop Solutions (HEDT), then Threadripper is designed to set a new performance bar. This segment can be called "super high-end desktop" (SHED). The number of cores that AMD introduced in the Threadripper processors was previously visible only in server solutions from Intel, the company offered 28 cores for an amount equal to almost $ 10 thousand. By offering chips with a large number of cores, reasonable frequencies, power and IPC, AMD erases the boundaries between users, semi-professionals and corporate clients. To compete, Intel announced the launch of the Skylake-X platform with 12, 14, 16 and 18 cores over the next few months.
Like the fastest Intel chips, AMD processors will most certainly be in demand by those who want to do everything at once. For a home PC user, this may allow to combine gameplay during a stream (transcoding and uploading in rlttime) with hosting a game server and parallel execution of some additional tasks. For the semi-professional segment, this means video processing or performing calculations using multiple GPUs / FPGAs. The essence of the idea is that if the user needs to do something on the computer, he can use the system in parallel for other tasks, having an adequate supply of CPU power, PCI slots, RAM, and storage space. Threadripper, as already mentioned, inherited the design of the server processor, and, accordingly, its aspects of high performance density, which identified the server in the last decade.
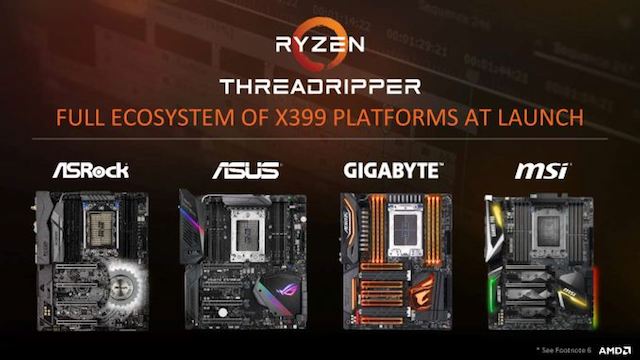
New socket, new motherboards
Again, like the Intel HEDT platform, AMD launches the X399 platform under Threadripper to provide all the necessary tools for the new processor. The large TR4 slot and all of its pins provide four-channel memory with two DIMMs per channel, as well as up to 60 PCIe lanes for additional cards (video cards, network cards, SSD, etc.). These motherboards currently support two already released Threadripper processors, plus a processor that will be launched at the end of the month, and another processor that was not announced, although insider information was received about its release (release date is unknown).

The new socket is noticeably different from previous AMD sockets, demonstrating how far the technology has gone. Instead of a simple latch PGA slot, the LGA TR4 connector has three Torx screws that securely lock the CPU into the socket, which must be unscrewed in a certain order (as seen in the figure above), after which the connector latch simply opens. Below it is the bracket into which the processor is inserted. Each Threadripper processor has a non-removable frame for convenient placement of the CPU in the bracket.

Due to the design of the connector and the size of the processors, the mounting holes for the CPU cooler also differ. Since each Threadripper presented is rated at 180 watts, AMD recommends using at least liquid cooling and supplies the Asetek processor bracket with each processor sold (a Torx screwdriver is also included).

The bracket is narrower on one side, which indicates the “top” of the socket in the traditional layout of the motherboard.
The essence of the motherboard design comes down to how each of the available I / O functions is routed. The basic block diagram of AMD is as follows:

The proposed AMD configuration provides 48 lines from the CPU to PCIe slots for 4-way SLI / CFX interfacing (16/16/8/8), 12 lines from the CPU to M.2 slots for 3-way x4 NVMe and 4 lines for the chipset . In this case, the chipset can have two gigabit Ethernet ports, a PCIe x4 slot, a PCIe x1 slot, a PCIe x1 for Wi-Fi, SATA ports, USB 3.1 Gen 1 and USB 3.1 Gen 2, and USB 2.0 ports.
Presumably the prices of X399 motherboards will vary from $ 249 to $ 599, depending on the functionality. The motherboard we tested for this review was the ASUS X399 ROG Zenith Extreme, which has an MSRP (manufacturer's suggested retail price) of $ 549.
Competitors
We asked both Intel and AMD to clarify who they see as the main competitor to the Threadripper processors. Given the fact that the Threadripper is a consumer-oriented product - which is interesting, not really workstations-oriented - AMD expectedly stated that the current Intel Core i9-7900X (10-core processor) is the most suitable product for the role of a competitor . Xeon is a corporate product that will not be sold in ready-made systems that are demanded by Threadripper customers.
Intel surprised us by reporting exactly the same as AMD. They said that the Core i9-7900X is the main rival of the Threadripper at the time of the processor’s release. It was expected that companies would offer any version of a cheaper 2P solution, although, but after listening to Intel, it became clear why this did not happen. There are two obvious reasons: first, Intel Consumer and Intel Enterprise are practically two different companies that overlap a little and are involved in each other's business. They also do not have a common policy of communication with the press. Ask Intel Consumer - get the answer Consumer team. Ask the Enterprise team - and you will see that they are more focused on EPYC, and not Threadripper. The second reason is that the “cheap 2P system” simply does not exist when it comes to buying new processors. Most online discussions on low-cost Intel 2P systems imply buying CPUs from the gray market or from resellers.
Thus, the real competitor is, in fact, Skylake-X (and Broadwell-E at a discount). As a result, AMD Threadripper 1950X with 16 cores and 1920X with 12 cores confront Core i9-7900X with 10 cores and Core i7-7820X with 8 cores. Consider as rivals - Broadwell's Core i7-6950X because of its architecture, AMD Ryzen 7 1800X, Ryzen7 1700, which was listed as an example of a good performance / price ratio.

The key point here is that the Threadripper has more cores and more PCIe lines for the same price. The ADM offers a lower turbo CPU, but with a higher base frequency, with slightly more power for similar platforms. It will be an interesting battle.
Articles in this review:
- AMD Ryzen Theadripper 1950x and 1920x
- Feeding the Beast and key features of processors
- Chip, Bus and NUMA
- Creator Mode and Game Mode
- Testbed Configuration
- Test suite 2017
- Benchmarking Performance: CPU System Tests
- Benchmarking Performance: CPU Rendering Tests
- Benchmarking Performance: CPU Web Tests
- Benchmarking Performance: CPU Encoding Tests
- Benchmarking Performance: CPU Office Tests
- Benchmarking Performance: CPU Legacy Tests
- Gaming Performance: Civilization 6 (1080p, 4K, 8K, 16K)
- Gaming Performance: Ashes of the Singularity Escalation (1080p, 4K)
- Gaming Performance: Shadow of Mordor (1080p, 4K)
- Gaming Performance: Rise of the Tomb Raider (1080p, 4K)
- Gaming Performance: Rocket League (1080p, 4K)
- Gaming Performance: Grand Theft Auto V (1080p, 4K)
- Energy consumption, energy efficiency
- Creator Mode and Game Mode Analysis
- Conclusion
Additional Notes
For reasons beyond our control, there are no Skylake-X processor tests in this review. There were some problems during testing, which postponed this process at a later date. We launched several more tests using the latest BIOS and with a more serious cooling system, but after the arrival of the Threadripper processor, the SKL-X was carefully packed, and the experimental was replaced by the Threadripper. Now, looking back at the results of the SKL-X tests, it is obvious that the problems that arose were related to the BIOS / firmware. In the near future we plan to diligently sweat over the search for errors, for this purpose we plan to replace the X299 motherboard with a new one.
2. Feeding the Beast and key features of processors
When frequency was considered the most important characteristic of processors, the main problem was to adjust such characteristics as efficiency, thermal characteristics, and computation cost: the higher the frequencies were raised, the more voltage was required, the farther away from the optimal processor mode, the greater the power consumed per unit of work. For the processor, which occupied the first place in the product line, acting as a “performance champion”, these drawbacks seemed unimportant - until the operating temperature reached 90 ° C.
Now, with the onset of the War of the Cores, other problems have come. When there was only one kernel, providing data for the kernel via caches and DRAM was a relatively simple task. With 6, 8, 10, 12 and 16 cores, the main stumbling block was the need to provide each core with a data stream for continuous operation in order to avoid meaningless idle cores. This is not an easy task: every processor core now needs a fast way to exchange data with each other and with the main memory. It sounds like “feeding the beast”.
Key features: 60 PCIe lanes vs 44 PCIe lanes
After many years of playing minor roles, AMD with new processors will occupy one of the leading places on the market. The Ryzen 7 had only 16 PCIe lines (lane), and they could partially compete with Intel processors with 28/44 PCIe lines. Now the Threadripper processor will have access to 60 lines for additional PCIe cards. In some cases, this can be called 64 lines, but four of them are reserved for the X399 chipset. With $ 799 and $ 999, the Threadripper competes with 44 PCIe lanes on the Intel Core i9-7900X for $ 999.

The reason for the number of PCIe lanes is the target market to which these processors are oriented: consumers performing high performance computing. These are users who use multiple GPUs, multiple PCIe storage devices, need high-end networks, high-end data storages, and other different hardware that can be used with PCIe. As a result, we will most likely see motherboards having 32 or 48 lanes for PCIe slots (x16 / x16, x8 / x8 / x8 / x8, x16 / x16 / x16, x16 / x8 / x16 / x8), two or three PCIe 3.0 x4 slots for U.2 or M.2 storage devices, and faster Ethernet (5 Gbit, 10 Gbit). AMD allows each of the root PCIe x16 complexes to divide up to x1 into a maximum of seven devices. The four PCIe lanes going to the chipset will also support several PCIe 3.0 and PCIe 2.0 lanes for SATA or USB controllers.
Intel has a different strategy, allowing you to implement 44 bands in x16 / x16 / x8 (40 lanes) or x16 / x8 / x16 / x8 (40 lanes) or x16 / x16 to x8 / x8 / x8 / x8 (32 lanes) with 4 12 lanes for storing PCIe or faster Ethernet or Thunderbolt 3 controllers. The Skylake-X chipset has 24 more PCIe buses for SATA, USB and gigabit Ethernet controllers.
Key features: DRAM and ECC
Intel products are divided into niches, so if a customer wants to have a processor with a large number of cores with ECC memory (error-correcting code memory, error-correcting memory), he has to buy Xeon. Typically, Xeon supports a fixed memory speed depending on the number of channels filled (1 DIMM per channel on DDR4-2666, 2 DIMM modules per channel on DDR4-2400), as well as ECC and RDIMM technologies. However, HEDT consumer platforms for Broadwell-E and Skylake-X will not support these technologies, and will use only Non-ECC UDIMM.
AMD supports ECC on its Threadripper processors, providing customers with 16 cores with ECC. However, they should only be UDIMM (unregistered DRAM), but with support for overclocking RAM to increase the speed of Infinity Fabric (for communication between individual units in AMD Ryzen processors, an internal Infinity Fabric connection replacing the HyperTransport bus is used.). AMD officially stated that the Threadripper processors can support up to 1 TB of RAM, although this will require 128 GB UDIMM cards, the maximum size of which is currently 16 GB. Intel also claims a limit of 128 GB for Skylake-X, when using 16 GB UDIMM.
Both processors support four-channel memory on DDR4-2666 (1DPC - DIMM Per Channel) and DDR4-2400 (2DPC).
Key features: cache
Both AMD and Intel use L2 private caches for each core, then L3 cache (victim L3 cache) before moving to main memory. Victim cache is a cache that retrieves data deleted from the cache below it and cannot prefetch data. But the size of these caches and how AMD and Intel interact with them are different.

AMD uses 512 KB L2 cache for each core, 8 MB L3 cache per complex of four cores. In a 16-core Threadripper there are four such cores of four cores, we end up with a 32 MB L3 cache, but each core can only access data found in its local L3. To access the L3 of another complex, additional time is required, which causes significant delays.
In Intel's Skylake-X, we get 1 MB L2 cache per core, which means a higher probability of getting the L2 cache, the L3 cache was reduced to 1.375 MB per core. L3 has ceased to be inclusive, which means that the contents of the L2 cache are not copied in the L3 cache, if the kernel needs data from another kernel that is in the L2 cache, then you will have to perform the corresponding request - this data is no longer in the L3 cache, respectively, more time is required and latency occurs however, the delay is somewhat ordered by design. This is noticeably different from the cache structure of Broadwell-E, where 256 KB is L2 and 2.5 MB is L3 per core. In Broadwell-E caches with an inclusive architectural solution.
3. Chip, Bus and NUMA
In the Ryzen line, AMD developed an 8-core silicon chip, known as a Zeppelin chip. It consists of two core complexes (CCX) with four cores each, each CCX having access to 8 MB of L3 cache. The Zeppelin chip has access to two DRAM channels and a limit of 16 PCIe lanes for additional cards. With the release of AMD Threadripper doubled this matrix.
If you had disassembled the Threadripper processor, you would see four silicon chips similar to those of the EPYC (Multi Core Module design MCM) processor. Two of these chips are hardening “gaskets”, empty silicon, which is not used for anything except for the distribution of cooler weight and cooling. The remaining two chips (in opposite corners, to improve thermal performance and routing) are essentially the same Zeppelin used in Ryzen, each of which contains eight cores and has access to two memory channels. They exchange data via an internal Infinity Fabric bus, for which AMD claims a bandwidth of 102 GB / s (bidirectional full duplex) and a delay of 78 ns for access to the nearest memory (DRAM connected to the same chip) and 133 ns for access to distant memory (DRAM on another chip). We checked and can confirm these numbers for DDR4-2400 memory. When using DDR4-3200, the access speed is 65 ns and 108 ns, respectively.

Despite the fact that this AMD slide shows two chips, there are four chips in the processor. Since only two of them are active, AMD has “simplified” the diagram.
For comparison, EPYC claims a data exchange rate between chips up to 42.6 GB / s on DDR4-2666. This is due to the fact that in EPYC there are three internal connections to the chips and one external (to the other socket). The chips in Threadripper should only interact with one other chip, which gives some flexibility. It seems that Threadripper uses two links out of three at a speed of 10.4 GT / s (gigatransactions per second):
- Chip-to-chip for EPYC is limited to 42.6 GB / s when using DDR4-2667
- The chipri-to-chip for the threadripper is limited to 102.2 GB / s when using DDR4-3200
- 42.6 GB / s * 2 channels * 3200/2667 = 102.2 GB / s
- 42.6 GB / s * 3 channels * 3200/2667 with 8.0 GT / s = 115.8 GB / s (too many)
- 42.6 GB / s * 3 channels * 3200/2667 with 6.4 GT / s = 92.6 GB / s (too little)
This AMD configuration is exactly what is called a NUMA configuration: non-uniform memory access. This means that the code cannot rely on a constant (and low) delay between requesting something from DRAM and receiving it. This can be a problem for high-performance code, so some programs are designed with NUMA support, allowing memory to be tied to the nearest DRAM controller, reducing potential throughput, but prioritizing latency.
NUMA is not new to x86 architecture. After the processors began to be supplied with memory controllers on a chip, instead of controllers outside the chip, on the north bridge of the motherboard, NUMA became an integral part of multiprocessor systems. In this regard, AMD has been a leader since the very beginning, they were ahead of Intel in years in the development of on-chip controllers for x86 processors. Thus, AMD has been working with NUMA for many years, and similarly, NUMA has been working in Intel multiprocessor server systems for almost a decade.
New to Threadripper is that the presence of NUMA has never concerned consumers. Custom MSM processors could be counted on fingers, and we would have to go back to the Core 2 Quad family to find a processor with several chips, which preceded the memory controllers for Intel processors. Thus, Threadripper was the first processor that introduced NUMA users.
But more importantly, consumer software was also not prepared for NUMA, so almost no program can use its features. The good news is that although NUMA changes the rules of the game, it doesn’t break the old software. NUMA-enabled operating systems help unsuitable software to maintain threads and memory on a single NUMA node to provide standard performance features.
The disadvantage of this is that, as a super-caring parent, the OS prevents unsuitable software from using other NUMA nodes, or, as is the case with Threadripper, it prohibits applications from using the second chip and its 8 cores.

At the hardware level, Threadripper consists of two NUMA nodes.
In an ideal world, all software would be NUMA-compliant, which would eliminate any problems on this issue. But in practice, everything looks a little different: software changes slowly, and it is highly unlikely that in the near future NUMA-style processors will become commonplace. In addition, programming under NUMA can be quite difficult, especially in the case of workloads or algorithms that are associated with working with "distant" cores and memory. Thus, the quirks of NUMA will never disappear completely, which is why AMD has taken responsibility for solving this problem.
AMD has implemented switches — both in the BIOS and in the application — to support and control NUMA in the Threadripper. By default, Threadripper actually hides its NUMA architecture. AMD instead uses the Threadripper in a UMA configuration: a unified memory access system in which the memory is sent to any DRAM and the delay is variable (for example, ~ 100 ns on average between 78 ns and 133 ns), but focuses on high peak throughput . Using the CPU representation for the OS as a one-piece design, memory bandwidth increases, and all applications (NUMA-compatible and not) see all 16 cores as part of the same CPU. Thus, for applications that do not support NUMA (and, therefore, their performance would be degraded by the operating system in NUMA mode) - this allows you to maximize the number of cores, threads and memory that they can use.

All 32 threads are represented as part of a single monolithic CPU.
The disadvantage of the UMA mode is that, because it hides how the Threadripper works, it does not allow the OS and applications to make fully informed decisions, and therefore their performance is reduced. Applications that are sensitive to delays and are not optimized for NUMA can lose performance if they use cores and memory attached to another chip. That is why AMD allows you to customize the Threadripper for NUMA mode, displaying its entire OS design and resulting in separate NUMA devices for the two chips. This instructs the OS to keep applications attached to a single crystal, if possible. This mode is vital for some software and games, and we checked it in our review.
In general, the use of multi-crystal design has positive and negative sides. Negatives are non-uniform memory delays, non-uniform kernel-to-core delays, and redundancy in on-chip computing that does not need to be repeated. As a result, AMD uses 400mm2 + crystals, which can increase costs at the production level. The positive side in crystal design lies in the ability to design a single crystal and simply repeat it, instead of creating several different architectures that multiply production costs.
Intel uses a single monolithic crystal in Skylake-X processors: an LCC chip containing up to 10 cores and an HCC containing from 12 to 18 cores. They use a rectangular grid of cores (3x4 and 5x4, respectively), with two segments reserved for memory controllers. For communication between the cores, Intel uses a network connection that determines which direction the data should move (up, down, left, right, or received into the core). In our review of Skylake-X, we looked at Intel's modular isolation method (MODe-X) Intel methodology, but the basic concept is consistency. This link operates at 2.4 GHz. Prior to Skylake-X, Intel implemented a ring topology where data would have to move around a ring of cores in order to reach its destination.
As for the connection between the cores, for AMD it is the Infinity Fabric, which runs inside the chip or goes to another crystal, and for Intel - the internal bus MoDe-X.
4. Creator Mode and Game Mode
Due to the difference in latency between the two pairs of memory channels, AMD has implemented a strategy of “modes” that users can choose depending on the workflow. These two modes are called Creator Mode (default) and Game Mode and control two switches to tune system performance.
These two switches are:
- Legacy Compatibility Mode, on or off (off by default)
- Memory Mode: UMA vs NUMA (UMA by default)
The first switch disables the cores in one of the silicon matrices, but retains access to the DRAM channels and PCIe lines. When the LCM switch is turned off, each core can process two threads, and the 16-core chip now has a total of 32 threads. When LCM is turned on, the system disables half of the cores, leaving 8 cores and 16 threads. This switch is intended primarily for compatibility, since certain games (for example, DiRT) cannot work with more than 20 threads in the system. With a decrease in the number of threads, it becomes possible to launch such programs. Using the cores of a single matrix also simplifies cross-communication in the main micro-architecture.
The second switch, memory mode, switches the system to uniform memory access (UMA) mode or non-uniform memory architecture (NUMA) mode. With the default settings, the memory and processor cores are considered by the system as a single array with maximum throughput and average latency. This makes it easier to understand the code, although the actual delay for one instruction may be 20% more or less than the average, depending on which memory bank is used.

NUMA still gives the entire memory to the system, but it breaks the memory and cores into two NUMA blocks, depending on which pair of memory channels is closer to which core. The system will store data for the kernel as close as possible to it, ensuring minimal latency. For one core, this means that it first fills in the memory closest to it, with low latency, but uses only half of the bandwidth, and then the other half of the memory with the same half bandwidth and higher delay. This mode is designed for delay-sensitive workloads, eliminating the bottleneck in the workflow. For some code this matters, as for games - low latency can affect the average FPS or 99th percentile in game tests.
The confusion in this switch lies in the fact that AMD calls it "Memory Access Mode" in its documentation and marks the two options as "Local" and "Distributed". This is easier to understand than the SMT switch, because Local is focused on core latency (NUMA), while Distributed focuses on core bandwidth (UMA), with Distributed set to default.
- When Memory Access Mode is Local, NUMA is enabled (Latency)
- When Memory Access Mode is Distributed, UMA is enabled (Bandwidth, default)
With this in mind, there are four ways to organize these two switches. AMD gave two configurations names to help users select a system usage mode. Creator mode is designed to provide the largest possible number of threads and maximum memory bandwidth. Game mode is designed to optimize latency and compatibility to increase FPS in games.

There are two ways to customize each mode, which is quite confusing.

These modes can be configured through the BIOS, but its settings do not explicitly indicate the “Creator Mode” and “Game Mode”. It provides direct access to the choice of memory mode, which ASUS called Local and Distributed, and not NUMA and UMA. For Legacy Compatibility mode, users will have to wade through several screens in the Zen option, where the setting will eventually become available, and manually disable the eight cores. This makes Ryzen Master the easiest way to enable game mode.

While we tested Threadripper, AMD updated the Ryzen Master several times, so there is a chance that by the time you read this, everything will change again. But the bottom line is that the Creator mode and game mode here are not separate settings. Instead, AMD marks them as “profiles”. Users can select the “Creator” profile or the “Game Mode” profile, and in both profiles the two switches mentioned above (labeled “Legacy Compatibility Mode” and “Memory Access Mode”) can be switched as needed.
Cache performance
Purely theoretically, it makes sense to switch between the Creator and Game Mode modes depending on the workflow. If you don't need streams, but you need low latency, the game mode is your choice. However, this is strange, since the Threadripper focuses on multi-threaded workloads more than games, and losing half of the threads in the game mode can be detrimental to the work station implementation. At the same time, users can leave the SMT enabled and still change the memory access mode themselves, although AMD focuses specifically on the Creator and Game Mode modes.
16- Threadripper 1950X. , DRAM. ( 2 ), L1, L2, L3 . UMA, Creator, . Ryzen 5 1600X Zeppelin 6950X Broadwell . DDR4-2400, DIMM .

1950X , 8 , L3 CCX. , Game 79 , Creator — 108 . , Ryzen 5 1600X, , 8 (20 41 ), Creator Game 87 . , Creator , , Ryzen Game.
DRAM DDR4-3200 Threadripper 1950X, :

8 , L3 , . 8 DDR4-2400 41 18 DDR4-3200. , , : Creator DDR4-3200 Game DDR4-2400 (87 79 ), Game DDR4-3200 65 .
, Game mode, ( ). AMD?
:
- At DDR4-2400, 79 and 136 «» (108 )
- At DDR4-3200, 65 and 108 «» (87 )
— , Creator, , UMA + Creator ( ) .
5.
-, , , . , , JEDEC. , , , , JEDEC . , (XMP ), BIOS. JEDEC — , , , , .

, , : , .
Thanks
. , .
Sapphire AMD. Sapphire Computex 2016 GPU AMD . , , AMD . Sapphire Nitro R9 Fury 4 , HBM AMD Fiji. GPU c HDM, R9 Fury , - 3584 SP, 1050 , GPU 4 4096- HBM 1000 .

Fury Sapphire Nitro RX 480 8GB, AMD 14 ( 2017 ). 14 AMD, GCN VR-ready $200. Sapphire Nitro RX 480 8GB OC - RX 480, 8 GDDR5 6 /, 2304 SP 1208/1342 .

R9 Fury RX 480 — — Sapphire RX 460, . GPU , . RX 460 — , , - . Sapphire Nitro RX 460 2GB Nitro — . 896 SP 1090/1216 , 2 GDDR5 7000 .

MSI GPU GTX 1080 Gaming X 8GB. AnandTech, - . MSI . MSI GTX 1080 Gaming X 8GB - , Seahawk, Aero Armor . Torx, , Zero-Frozr, PWM . GP104-400 16- TSMC-, 2560 CUDA 1847 OC ( 1607-1733 Silent). 8 GDDR5X, 10010 . GTX 1080 .

ASUS GTX 1060 6GB Strix GPU. / AMD, NVIDIA, GTX 1060 6 , 1080p .
ASUS , Strix GTX 1060. GTX 1080, . STRIX – - ASUS, ROG, Strix 1060 – 1080. 1280 CUDA, 1506 ( 1746 OC), 6 GDDR5 8008 192- .

Crucial SSD MX200. , , 1T MX200 – . 88S9189 Marvell Micron 16- 128- MLC, 7-, 2,5- , 100K IOPS 555/500 / . 1T, , TCG Opal 2.0 IEEE-1667 (eDrive) 320 .

Corsair AX1200i. AX1200i , Corsair Link. 1200 50°C 80 PLUS Platinum. 89-92% 115 90-94% 230 . AX1200i , 200- , 140- .
AX1200i 8 PCIe four-way GPU. AX1200i Zero RPM, , 30%.

G.Skill . G.Skill AnandTech CPU . , Computex G.Skill .

6. 2017
. , . , , , , , . 8-10- ( ) 100 , , , 4-5 . CPU , . , .
CPU . Web ( Chrome 56), ( PDF-, , brain simulation, AI, 2D- 3D-), ( , ), (, AES, h264 HEVC), (PCMark ) — , .
. Windows 10, , . : , Windows Defender, OneDrive, Cortana . , , , , (, , ).
Web Tests on Chrome 56
Sunspider 1.0.2
Mozilla Kraken 1.1
Google Octane 2.0
WebXPRT15
System Tests
PDF Opening
FCAT
3DPM v2.1
Dolphin v5.0
DigiCortex v1.20
Agisoft PhotoScan v1.0
Rendering Tests
Corona 1.3
Blender 2.78
LuxMark v3.1 CPU C++
LuxMark v3.1 CPU OpenCL
POV-Ray 3.7.1b4
Cinebench R15 ST
Cinebench R15 MT
Encoding Tests
7-Zip 9.2
WinRAR 5.40
AES Encoding (TrueCrypt 7.2)
HandBrake v1.0.2 x264 LQ
HandBrake v1.0.2 x264-HQ
HandBrake v1.0.2 HEVC-4K
Office / Professional
PCMark8
Chromium Compile (v56)
SYSmark 2014 SE
Legacy Tests
3DPM v1 ST / MT
x264 HD 3 Pass 1, Pass 2
Cinebench R11.5 ST / MT
Cinebench R10 ST / MT
-
GPU, . , , . $50 , , . — , , «» . , , «». , , – GPU . DirectX 12, .
, , - Ubisoft. AnandTech For Honor, Steep Ghost Recon: Wildlands, Ubisoft Annecy Ubisoft Montreal, . , , , , , , ( , , ). , .
, , 4/2, , . :
- Civilization 6 (1080p Ultra, 4K Ultra)
- Ashes of the Singularity: Escalation* (1080p Extreme, 4K Extreme)
- Shadow of Mordor (1080p Ultra, 4K Ultra)
- Rise of the Tomb Raider #1 — GeoValley (1080p High, 4K Medium)
- Rise of the Tomb Raider #2 — Prophets (1080p High, 4K Medium)
- Rise of the Tomb Raider #3 — Mountain (1080p High, 4K Medium)
- Rocket League (1080p Ultra, 4K Ultra)
- Grand Theft Auto V (1080p Very High, 4K High)
( / ) , . , 99- «Time Under x FPS» , .
, , :
- MSI GTX 1080 Gaming X 8G
- ASUS GTX 1060 Strix 6G
- Sapphire Nitro R9 Fury 4GB
- Sapphire Nitro RX 480 8GB
- GTX 1080. :
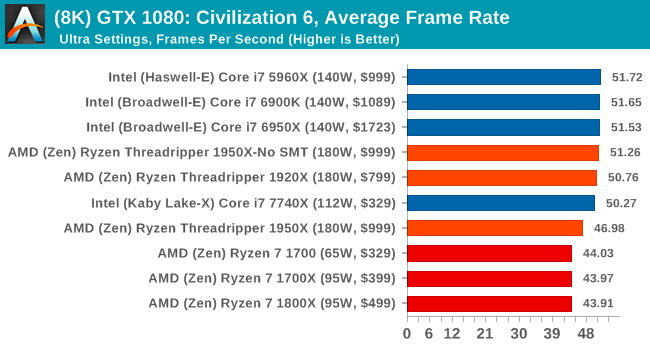
- Civilization 6 (8K Ultra, 16K Lowest)
This benchmark, with some limitations, can be launched, although it goes beyond the characteristics of the monitor used, allowing “future” testing of graphics processors for 8K and 16K with some interesting results. We run these tests on GTX 1080 only, because there’s no point in watching a slideshow more than once.
* As indicated in a note to this review, we have no data on games on the Skylake-X processor. We conducted a series of tests before getting the Threadripper, using the latest updates and a fresh BIOS. However, now, analyzing the data, we see a number of unsolved performance problems that must be closed before the results are published.
7. CPU System Tests
Our first test suite is general system tests. This test suite is designed to emulate what people usually do in the operating system, such as opening large files or processing small stacks of data. It is somewhat different from our office testing, where industry standards are used, and some of the tests here are relatively new and unusual.
Opening PDF files
First on the list is a test we wrote using a monstrous PDF document that we once received before attending an event. Although the document contains only one page, it contains so many high-quality layers that it took my average notebook 15 seconds to open the file and give me back control of the system. This document has become the best candidate for our “let's-open-terrible-PDF-document” test. Here we used Adobe Reader DC with disabled update functionality. Our benchmark sets the screen resolution to 1080p, opens PDF in fit-to-screen mode and measures the time between sending a command to open a file and the time when the file is expanded on the screen, and the user has control over the software again. The test was repeated 10 times, after which the average time was calculated. Results are shown in milliseconds.

This test is single-threaded, so Intel high-frequency chips get an obvious victory. In addition, on this test, there is an inconspicuous difference between the Threadripper chips.
FCAT Processing: link
One of the most interesting loads that fell into our hands in the last quarters is FCAT, a tool that we use to measure and visually analyze game delays due to dropped or corrupted frames. The FCAT process requires the inclusion of a color overlay into the game, recording the gameplay and subsequent analysis of the video file using appropriate software. However, this software is usually single-stream, since the video is mostly in RAW format, which implies a large file size and requires moving a large amount of data. For our test, we take a 90-second record of the Rise of the Tomb Raider test, running on a 1440p GTX 980 Ti, which is about 21 GB in size and measure the time required for processing with a visual analysis tool.

Like opening PDF, single-threaded performance is at altitude.
Dolphin Benchmark: link
Many emulators are related to single processor performance of the processor, and general reports usually suggest that Haswell has significantly improved the performance of the emulator. This benchmark launches a Wii program in which the beam tracks a complex three-dimensional scene inside the Dolphin Wii emulator. The results of this test are a completely reliable indicator of the speed of Dolphin processor emulation, which is an intense single-core task that uses most aspects of the processor. The results are shown in minutes, where the Wii itself showed a result of 17.53 minutes.

Dolphin shows itself well where there is a high performance of one core, although, judging by the test, multi-threading is still present and additional cores are involved.
3D Movement Algorithm Test v2.1: link
This is the latest version of the 3DPM benchmark we wrote. The goal of 3DPM is to simulate partially optimized scientific algorithms taken directly from my doctoral dissertation. Version 2.1 differs from 2.0 in that it conveys the basic structures of particles by reference, not by value, and reduces the number of double-> float-> double conversions performed by the compiler. This gives an acceleration of 25% compared with version 2.0, which means new data.

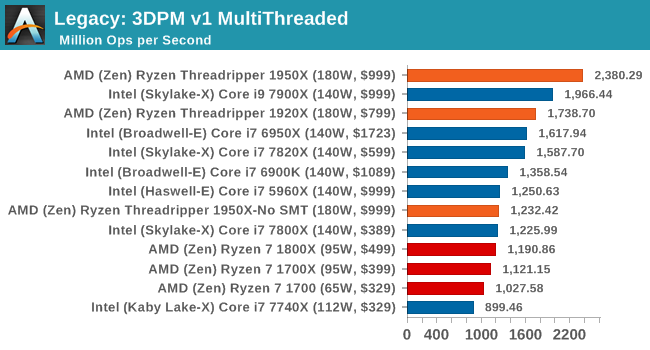
So, in our first purely multi-threaded test, the 1950X wins with 32 threads. 1920X exceeds 1950X in SMT-off mode, due to 24 streams exceeding 16 streams.
DigiCortex v1.20: link
Although outdated for a couple of years, DigiCortex software is a home project for visualizing the activity of neurons and synapses in the brain. The software comes with various benchmark tests, and we take a small benchmark that runs a brain simulation of 32 thousand neurons / 1.8 billion synapses. The test results indicate the ability of the system to emulate in real time, which means that any result above one is suitable for emulation.

To get a good result, DigiCortex requires a mixture of high frequency processor and DRAM performance, so anything with four-channel memory will do. The 1950X in SMT-off mode wins here due to the quick access to main memory in combination with the presence of 16 threads to access it. Broadwell-E is the closest competitor and surpasses even Skylake-X, most likely because of the ring topology (ring) versus the network (mesh) of Skylake. The 1950X performance in Creator mode, however, is much lower than that of standard Ryzen chips, showing that with a single memory architecture, there can be significant performance degradation. The 1920X failed this test for an unknown reason.
Agisoft Photoscan 1.0: link
Photoscan remains in our test suite from the previous test version, but now we are working in Windows 10, so features like Speed Shift on the latest processors come into play. The concept of Photoscan is the transformation of a set of 2D images into a 3D model — therefore, the more detailed the images and the more they are, the better the model. The algorithm consists of four stages: several single-threaded and several multi-threaded, and also has some dependence on the cache and memory. For some more varied workflows with multi-threaded features, options such as Speed Shift and XFR can take advantage of standby or idle CPUs, giving a significant performance boost on new micro-architectures.

Variable Agisoft single-multi-threading shows that in such a process the decisive element of victory is the combination of cores, IPC and frequencies. AMD is in the last position, probably because of its AVX implementation.
8. CPU Rendering Tests
Rendering tests is a long-recognized favorite of reviews and tests, because the code used by rendering packages is usually optimized to squeeze every bit of performance. Sometimes program rendering also depends heavily on memory — when you have many threads carrying tons of data, a memory with a low latency response can be the key to everything. Here we take some of the usual rendering packages for Windows 10, as well as some new interesting tests.
Corona 1.3: link
Corona is a standalone package designed to support software, such as 3ds Max and Maya, by photorealism using ray tracing. It's simple - you direct the rays, you get the pixels. Okay, a little harder, but this benchmark renders a fixed scene six times and gives results in terms of time and number of rays per second. The official benchmark tables present user results in terms of time, but I believe that “rays per second” is the best indicator (and in general, the results, where “more means better”, are easier to explain). Corona likes to pile up threads, so the results are strongly dependent on the number of threads.

Crown loves threads.
Blender 2.78: link
An old man in the world of rendering tests, Blender is still a very popular tool. We were able to run the standard workload on the February 5 Blender build, and measure the time needed to render the first frame of the scene. Blender is one of the largest open source tools, which means that both AMD and Intel are actively working to help improve the code base, which can be both beneficial and detrimental to their own microarchitecture.

Blender loves threads and memory bandwidth.
LuxMark v3.1: link
As synthetic, LuxMark may seem somewhat unreliable, as a visualization tool, given that it is mainly used for testing graphics processors. However, it offers both OpenCL and standard C ++ mode. In this case, in addition to the comparison in each version of the coding of the cores and IPC, we also see that the C ++ code for OpenCL shows different performance on the same processors.


Like Blender, LuxMark relies on the number of threads. Ray tracing is almost a tutorial for easy multithreaded scaling. Although it is interesting how close to the top is the 10-core Core i9-7900X in the CPU test (C ++), despite a significant shortage in the number of cores, probably due to a combination of higher IPC and frequency.
POV-Ray 3.7.1b4: link
Another regular benchmark in most suit is POV-Ray. Another ray tracer with a long history. As is often the case, during the preparation of AMD for the launch of Ryzen, the code base has been actively updated as developers make changes to the code and release new updates. Our test version was taken just before the start of such events, but over time we see that the POV-Ray code is being adjusted to meet new requirements.

Like LuxMark, POV-Ray also benefits from streams.
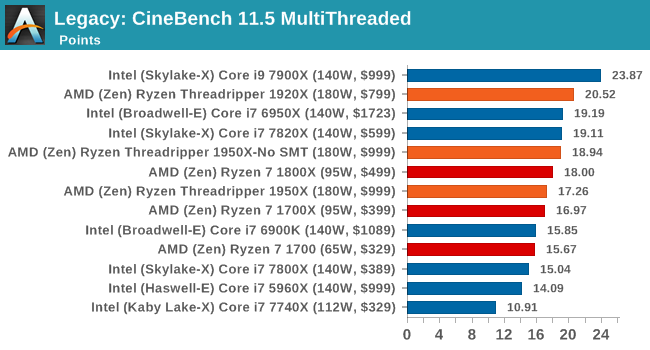
Cinebench R15: link
The latest version of CineBench has also become one of those programs that have been used everywhere, in particular, as an indicator of the performance of a single thread. High IPC and high frequency give ST performance, while having good scaling and many cores is the result of the MT test.


Intel recently announced that its new 18-core chip is gaining 3200 on the Cinebench R15. This means a 6.7% increase in performance compared to the 1950X Threadripper for twice the price.
9. CPU Web Tests
One of the problems when launching web tests is the habit of modern browsers to automatically install updates. This means that during any long period of benchmarking, the rule “update it outside the state of comparison” will be violated, especially when browsers start updating. Despite this, we managed to find a number of commands to create a non-upgradeable version of Chrome 56 for our 2017 test suite. Although this means that we are not keeping pace with the latest version of the browser, this makes the processor comparison scores comparable.
SunSpider 1.0.2: link
The oldest web test in this part of our review is SunSpider. This is a very simple JavaScript-based tool, and is ultimately a better measure of IPC and memory speed than anything else, with the majority of high-performance processors showing approximately equal results. The basic test performs 10 cycles and gives an average value. We perform this basic test 4 times.

Mozilla Kraken 1.1: link
Kraken is another Javascript-based test that uses the same test suite as SunSpider, but focuses on more rigorous real-world use cases and libraries, such as sound processing and image filters. Again, the main test is looped ten times and we perform the base test four times.

Google Octane 2.0: link
Major browser developers, such as Google and Mozilla, know that JS maximum performance is often critical when compared with other OS developers. Just as SunSpider is a very early JS test, and Kraken is a bit newer, Octane tends to be more relevant for real workloads, especially in devices with limited capabilities, such as smartphones and tablets.

WebXPRT 2015: link
While the previous three tests perform calculations in the background, and then show points scored, WebXPRT is designed to better interpret the visual workloads that professional users can have. For example, browser-based applications, graphics, image editing, data sorting and analysis, scientific analysis and financial tools.

In general, all our web tests show a similar trend. Very few web frameworks offer multithreading - browsers themselves do not have multithreading, so Threadripper's number of threads is simply not used. As a result, the hero of the day on the Internet is several fast cores with high single-threaded performance.
10. CPU Encoding Tests
One of the interesting elements of modern processors is the coding performance. This includes encryption / decryption, as well as transcoding video from one video format to another. In the case of encryption / decryption, performance is still relevant for encrypting sensitive data "on the fly" - the process by which modern devices typically provide software security. The use of video transcoding to match the quality, file size and resolution of a video file has been booming lately. This is necessary for adjusting the video for a consumer device or for game streamers who wish to unload the recoded video stream from the camera in real-time mode. As we move to live 3D video, this task will be even higher priority, and it turns out that the speed of certain algorithms is determined by the content input / output function.
7-Zip 9.2: link
One of the frivolous archivers, allowing to evaluate the performance of processors, is 7-Zip. It is open source licensed and is a fast and easy-to-use tool for advanced users. We run the test mode via the command line for four cycles and get the result.


At the request of several users, we returned to our saved test data and pulled out the compression / decompression numbers for 7-zip. AMD clearly wins here in decompression by a wide margin.
WinRAR 5.40: link
For the 2017 test package, we will use the latest version of WinRAR in our archiver test. WinRAR is more user-friendly in some aspects than 7-Zip, so we decided to include it in the package. Instead of using the benchmark mode, as is the case with 7-Zip, here we take a set of files representing a common stack (33 video files of 1.37 GB, 2834 smaller files in 370 folders of 150 MB) compressible and incompressible formats. The results shown are the time taken to encode the file. Due to DRAM caching, we run the test 10 times and get the average for the last five launches when the benchmark is in a steady state.

WinRAR coding is another test that doesn’t really scale with the number of threads. After just a few threads, most of its multi-threaded performance was achieved. This prevents the use of Threadripper resources and this is a direct hindrance in Creator mode.
AES Encoding
Algorithms that use AES encoding have spread widely throughout the world as a ubiquitous encryption tool. However, this is another test-for-CPU, and modern CPUs have an extension of the AES command system to increase encryption performance. We often consider scaling both in frequency and in nuclei using this benchmark. We use the latest version of TrueCrypt and run it in benchmark mode with 1 GB of data in DRAM. The results shown are the mean GB / s for encryption and decryption.

HandBrake v1.0.2 H264 and HEVC: link
As mentioned above, video transcoding (both encoding and decoding) is a hot topic in terms of performance, as the pace of new content creation increases. The first idea is to change the video formatting standard, which can occur with or without loss of quality. It is also possible to reduce the quality of the video in favor of the file size. Along with Google's favorite codec, VP9, there are two other frequently used ones: H264, the old codec, is almost everywhere and optimized for 1080p video, and HEVC (or H265), which aims to provide the same quality as H264, but with lower file size (or higher quality for the same size). HEVC is important because it is capable of streaming video as 4K, which means transferring fewer bits for the same quality content.
Handbrake is the preferred transcoding tool, so our test mode covers three areas.
H264 low quality / resolution: here we will re-encode 2-hour 640x266 H264 video and change the encoding from Main profile to High profile using the very-fast preset.

H264 high quality / resolution: a similar test, but this time we take a ten-minute double 4K file (3840x4320), operating at 60 Hz and recoded from Main to High, using a very-fast preset.

HEVC test: using the same video in HQ, we change the resolution and codec of the original video from 4K60 to H264 to 4K60 HEVC.

In the HQ H264 test, AMD shows high results on both processors, and SMT-off severely limits the 1950X due to the lack of SMT threads. HEVC, 1950X 7900X .
11. CPU Office Tests
, , — , , . — , , , , , , .
Chromium Compile (v56)
Windows 10 Pro, VS Community 2015.3 Win10 SDK Chromium. 2017 , . — — , .

, , 1920X Ryzen 7. , CCX , . 1950x «3---CCX» 1920x ( ). , , , , 2 1950X 8 12 16 Zen.
PCMark8: link
, PCMark 2008/2009 , Futuremark PCMark8, 2017 . PCMark , , « ». «» , C ++ OpenCL, . PCMark8 Home, Work Creative , , .


, Creative PCMark 8 . , .
SYSmark 2014 SE: link
SYSmark Bapco, . SYSmark , , Photoshop Onenote, , . (Office, Media, Data), . (Core i3-6100, 4 DDR3, 256 SSD, HD 530) 1000 .

12. CPU Legacy Tests
, - . , , 10 . Windows 10, , , .
3D Particle Movement v1
3DPM — , 3D-, Brownian Motion, . , IPC , «» . , , . - , , false sharing.

CineBench 11.5 and 10
Cinebench — , MAXON Cinema 4D. Cinebench . , , Cinebench, , . , , , , Cinebench, . 15, 11,5 10.


x264 HD 3.0
, x264 HD 3.0, , . 5.0.1, 1080p x264-. 3.0 720p, high-end , . , , 90 .

1950X: , , .
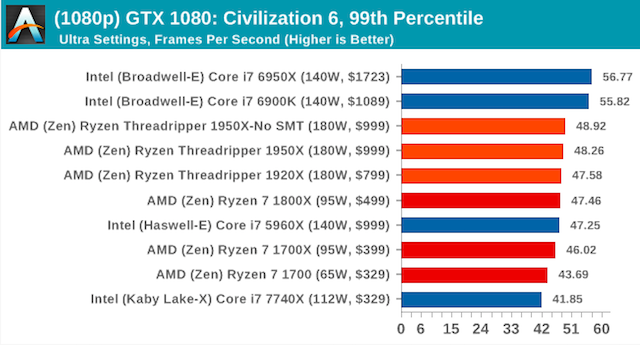
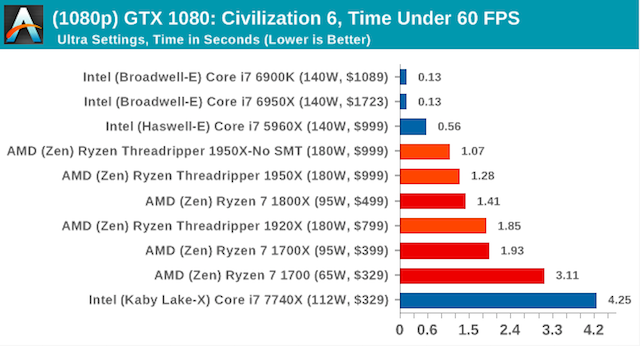
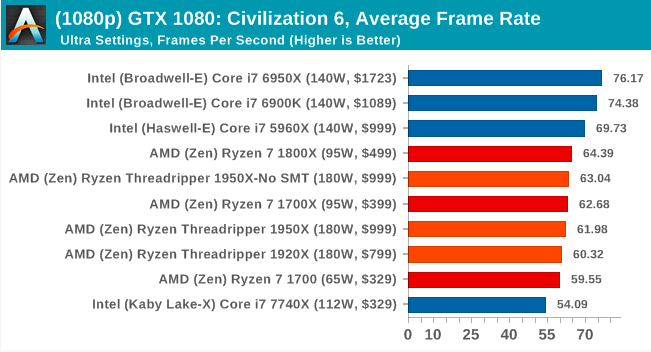
13. Civilization 6
, - — Civilization 6. Sid Meier , Civ . , - . , , , , . , , .

- — , , 5 . Civilization 6 Firaxis , . , Civilization , DirectX 12.
, , Civilization 20 , AI . Civilization «AI Benchmark», , . , .
1920x1080 4K . Civilization 6 MSAA, . , , 0 ( ) 5 (). Civ6- () 0 , MSAA — 2x.
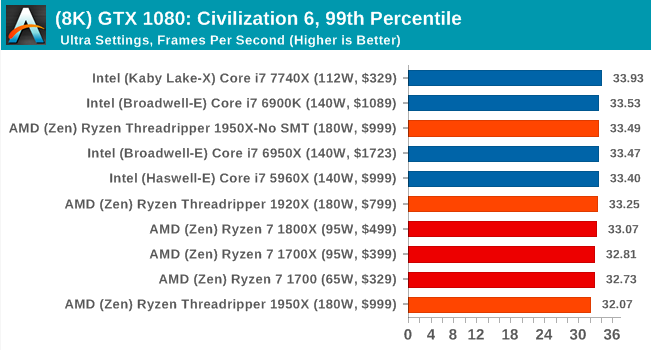
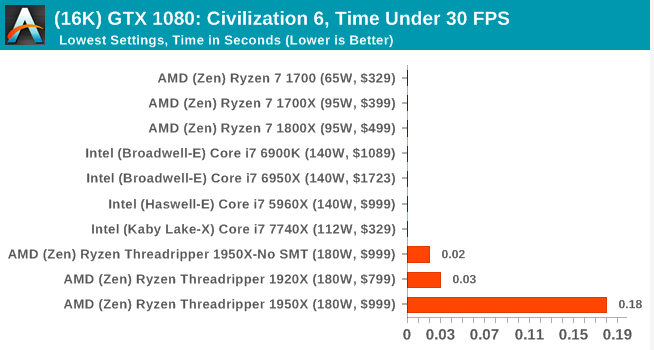
, 8K 16K (Civ6 ) GTX 1080, 8K, 4K, 16K .
MSI GTX 1080 Gaming 8G Performance
1080p
4K


8K

16K


4K
8K
16K
ASUS GTX 1060 Strix 6G Performance
1080p


4K

4K
Sapphire Nitro R9 Fury 4G Performance
1080p


4K


4K
Sapphire Nitro RX 480 8G Performance
1080p


4K
4K
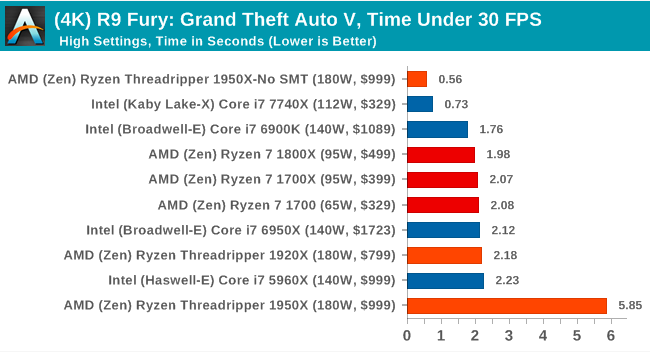
, Threadripper , Ryzen , Time Under Threadripper.
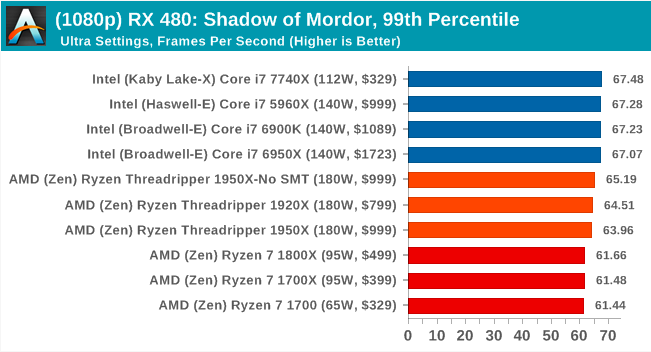
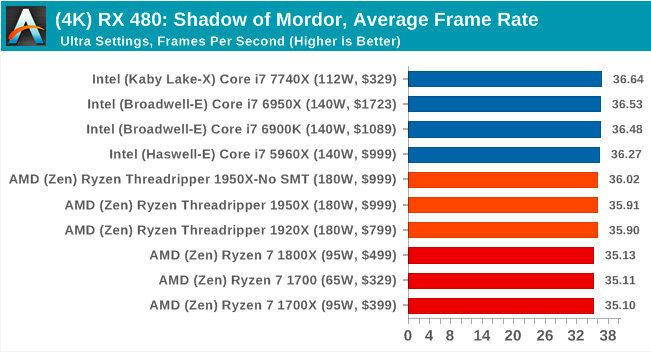
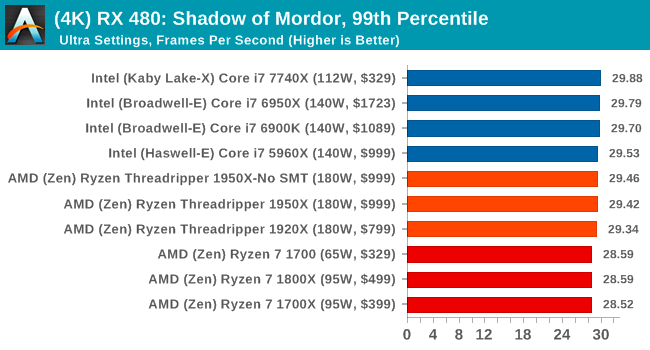
14. Shadow of Mordor
– - Middle Earth: Shadow of Mordor ( SoM). Monolith LithTech Jupiter EX . SoM . , Red Dead Redemption, SoM Zero Punctuation's Game of the Year 2014 .

2014 , SoM , . SoM , , , . , , , , 4K.
, , , , . , Graphical Quality, Lighting, Mesh, Motion Blur, Shadow Quality, Textures, Vegetation Range, Depth of Field, Transparency Tessellation. .
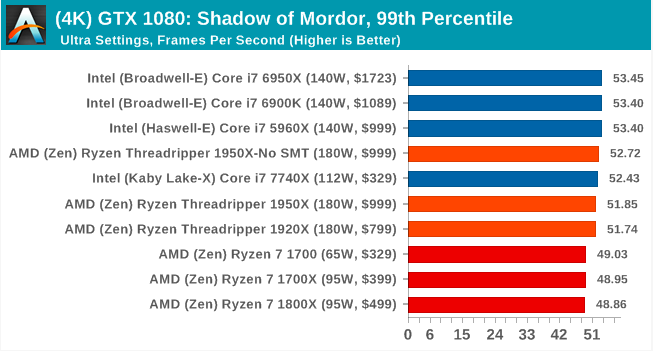
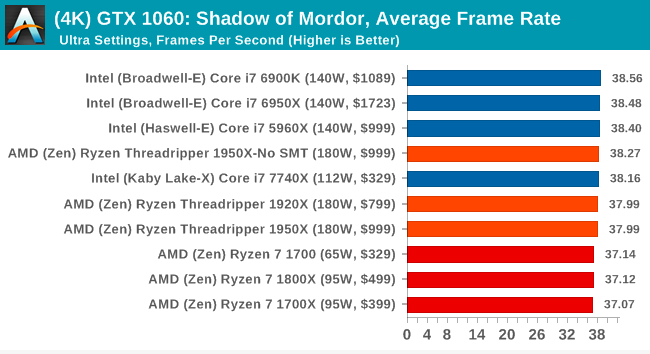
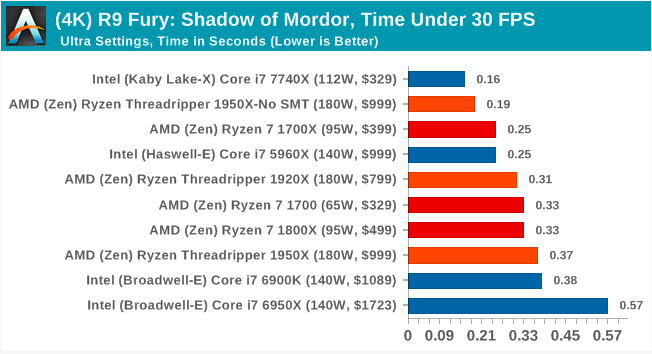
1080p 4K, 4K-, Ultra. FPS, 99 time under .
MSI GTX 1080 Gaming 8G Performance
1080p


4K


4K
ASUS GTX 1060 Strix 6G Performance
1080p


4K


4K
Sapphire Nitro R9 Fury 4G Performance
1080p


4K


4K
Sapphire Nitro RX 480 8G Performance
1080p


4K

4K
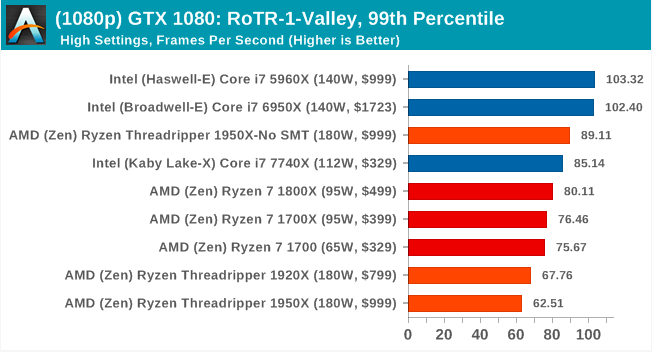
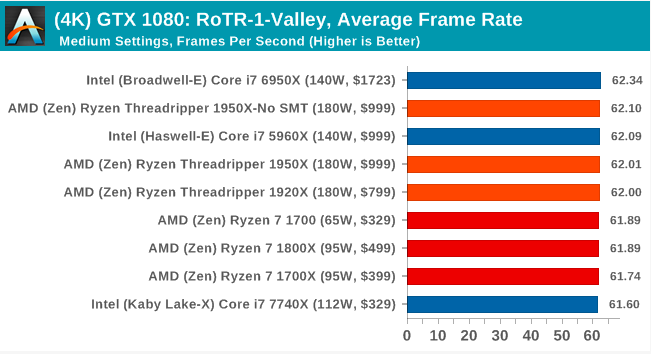
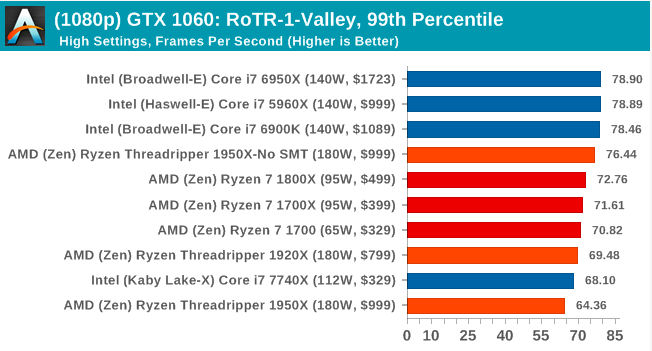
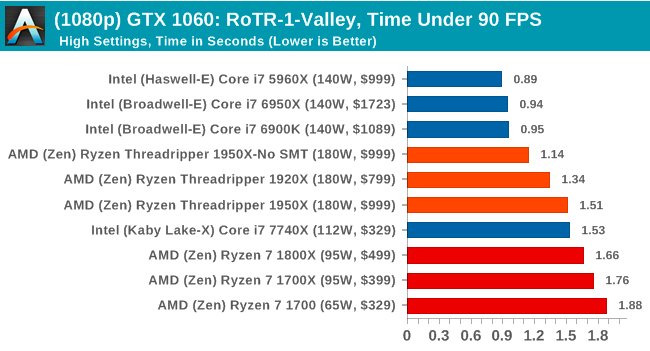
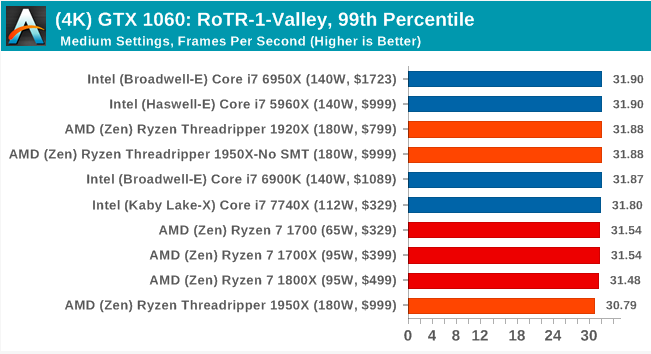
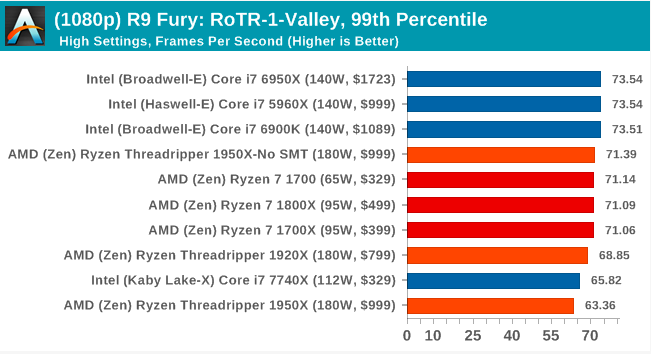
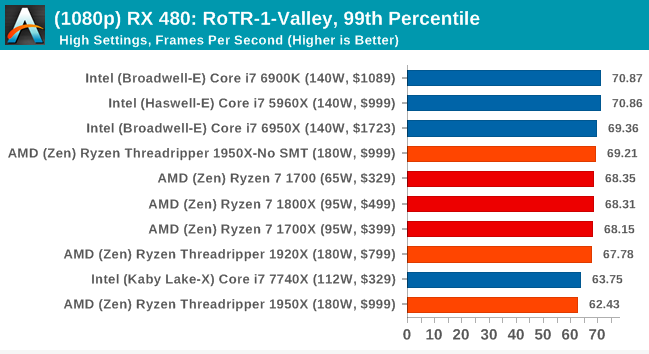
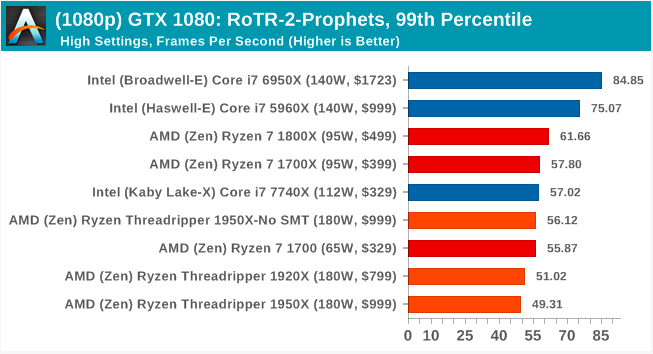
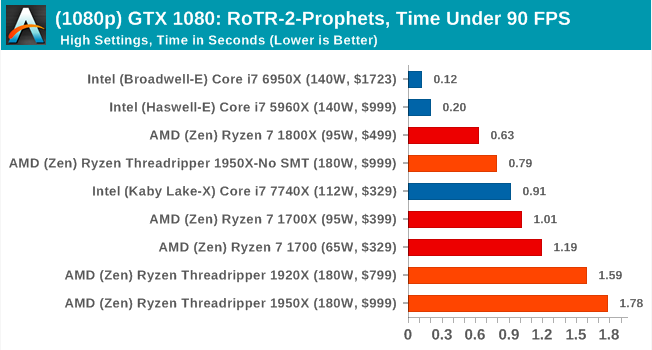
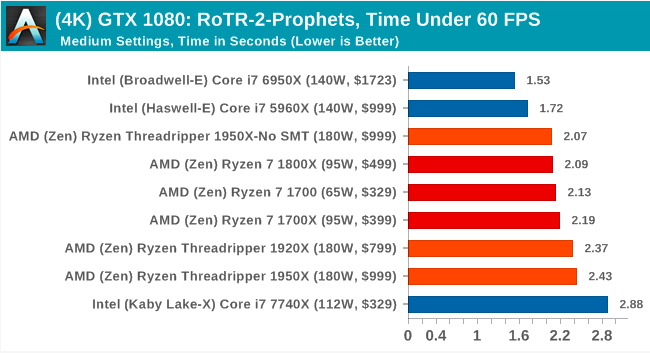
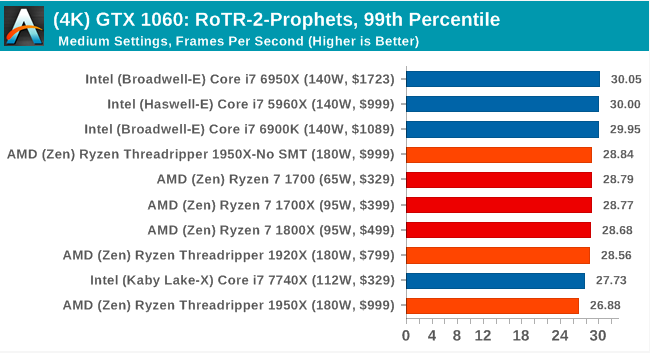
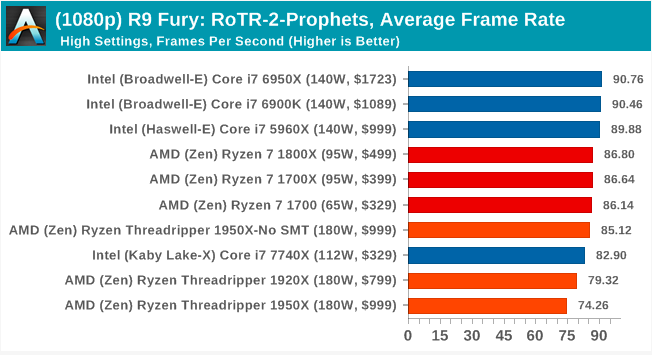
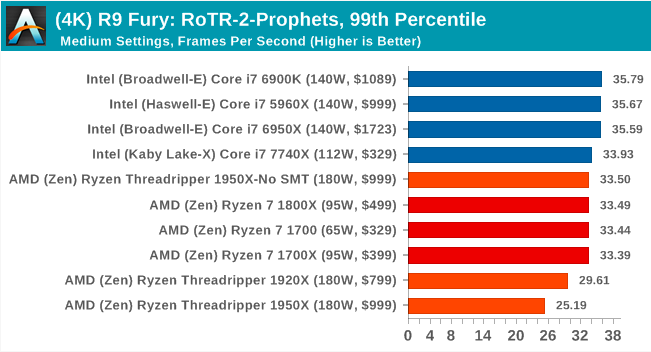
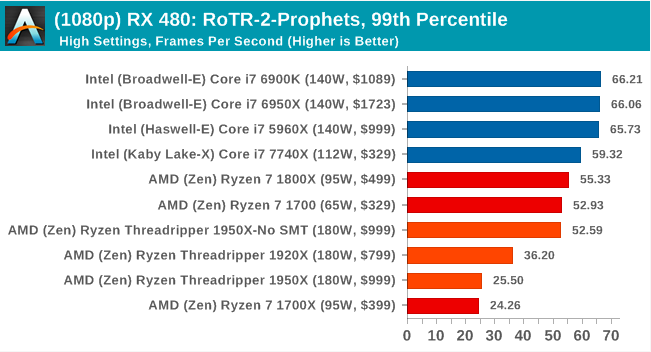
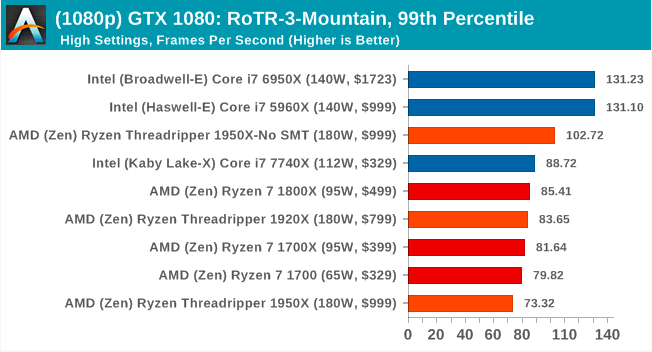
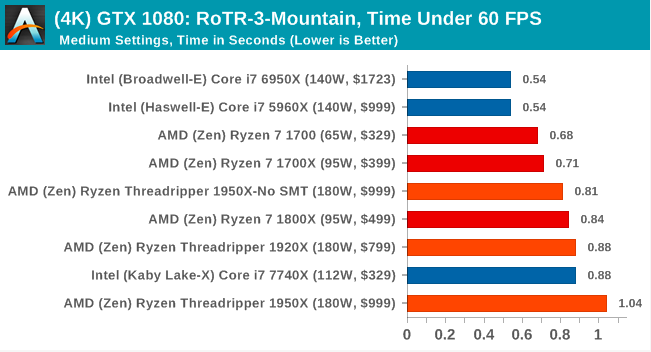
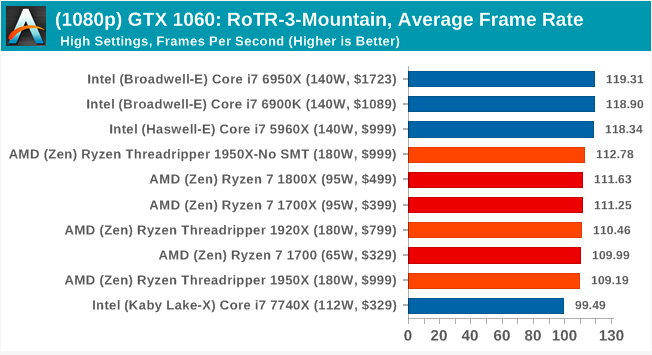
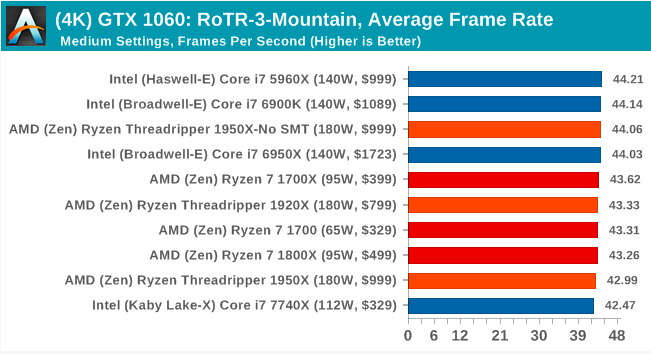
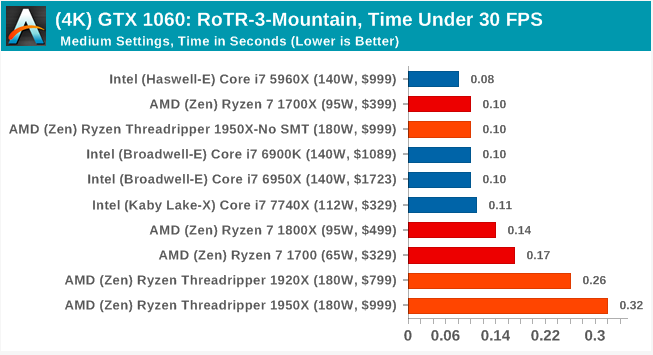
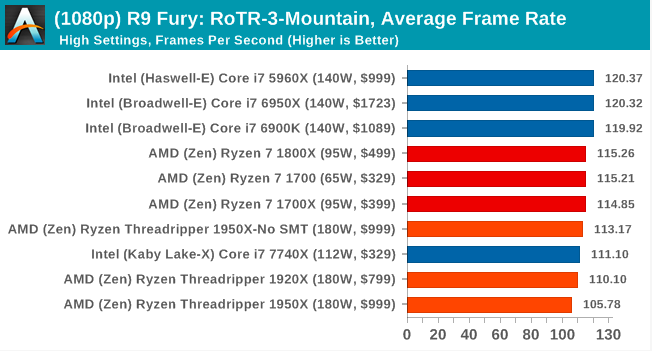
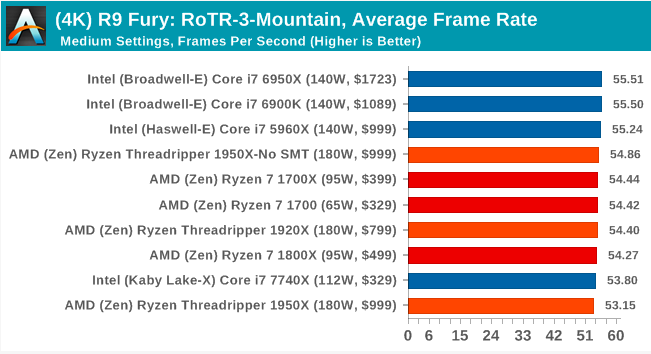
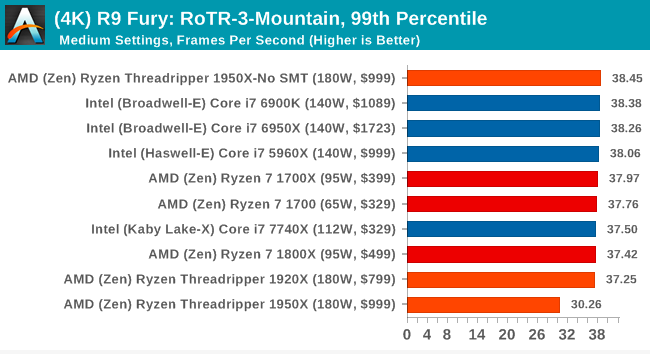
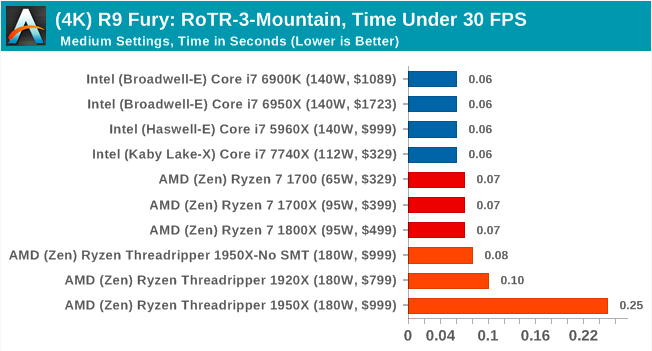
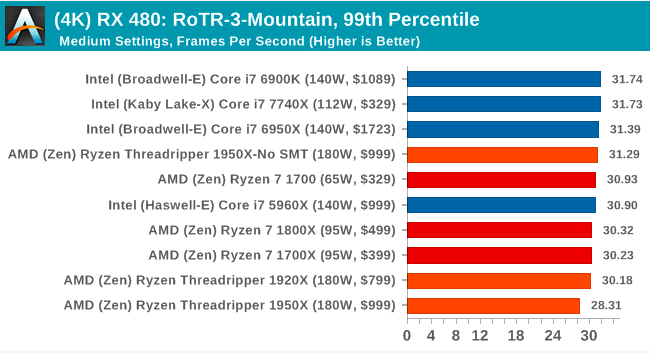
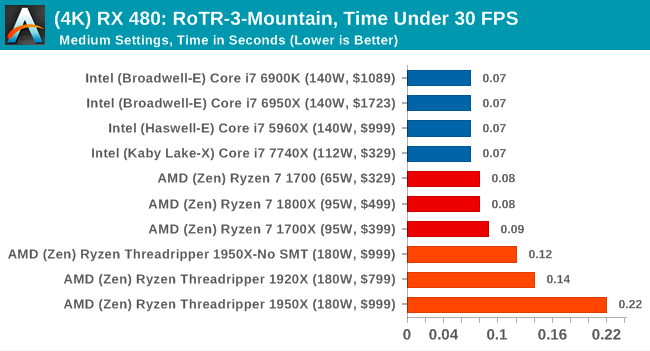
16. Rise of the Tomb Raider (1080p, 4K)
One of the newest games in our game test suite is Rise of the Tomb Raider (RoTR), developed by Crystal Dynamics, a sequel to the popular Tomb Raider, which was loved for its built-in automatic benchmark mode. But don't be fooled: the reference mode in the RoTR is very different this time.

Visually, the previous Tomb Raider raised the bar of realism almost to the level of TressFX, and the new RoTR is one step higher in terms of graphics accuracy. This leads to an interesting set of hardware requirements: some sections of the game are usually limited to the graphics processor, while others with more physics at large distances may be limited to the CPU, depending on how the driver distributes the DirectX 12 workload.
If for the benchmark the old game had one reference scene, in the new game there are three different scenes with different requirements: the Ridge Mountains (1-Valley), the Tomb of the Prophet (2-Prophet) and the Geothermal Valley (3-Mountain) - and we check everything three (and yes, I need to rename them - I was wrong when I set up the tests).
These three scenes should have been taken from the game, however it was noted that scenes like the 2 Prophet used in the benchmark can be the most CPU-demanding elements of this whole level, and the scene shown is only a small part of this level. Because of this, we report the results for each scene on each video card separately.
Graphics settings for RoTR are similar to other games of this type, offering some presets or allowing the user to adjust the texture quality, anisotropic filter levels, shadow quality, soft shadows, occlusion, depth of field, tessellation, reflections, foliage, bloom and features like PureHair, which allows use the TressFX library.
As before, we are testing the game at 1920x1080 and 4K resolution using our own 4K displays. At 1080p, we launch the High preset, and in 4K we use the Medium preset, which still causes a significant impact on the frame rate.
It is worth noting that the RoTR test is slightly different from our other benchmarks in that the game saves its graphical settings in the registry, rather than the standard INI file, and, unlike the previous game, the built-in benchmark TR cannot be called from the command line. Nevertheless, despite the difficulties, we prepared a script to automatically start the benchmark four times and parse the results. From the obtained data, we derive the average FPS, 99 percentile and time under analysis.
# 1

MSI GTX 1080 Gaming 8G Performance
1080p


4K


4K
ASUS GTX 1060 Strix 6G Performance
1080p

4K


4K
Sapphire Nitro R9 Fury 4G Performance
1080p


4K


4K
Sapphire Nitro RX 480 8G Performance
1080p


4K


4K
# 2 Prophet's Tomb

MSI GTX 1080 Gaming 8G Performance
1080p

4K


4K
ASUS GTX 1060 Strix 6G Performance
1080p


4K


4K
Sapphire Nitro R9 Fury 4G Performance
1080p


4K


4K
Sapphire Nitro RX 480 8G Performance
1080p


4K


4K
# 3

MSI GTX 1080 Gaming 8G Performance
1080p


4K


4K
ASUS GTX 1060 Strix 6G Performance
1080p


4K

4K
Sapphire Nitro R9 Fury 4G Performance
1080p


4K
4K
Sapphire Nitro RX 480 8G Performance
1080p


4K

4K
From the tests, it is obvious that the 1950X is not the best gaming chip in the default mode.
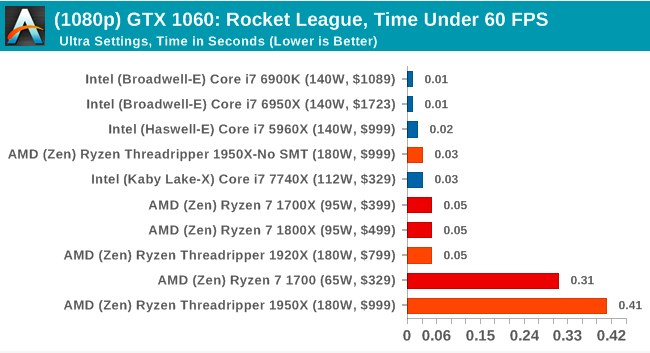
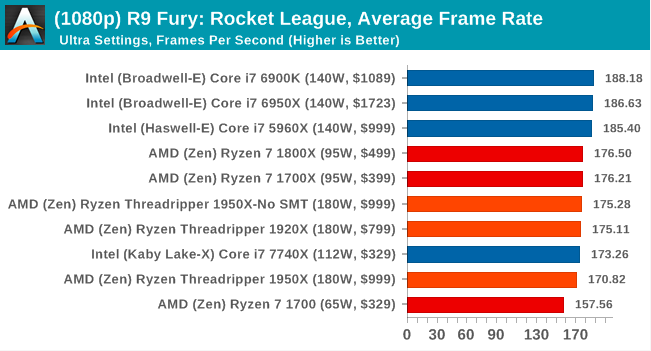
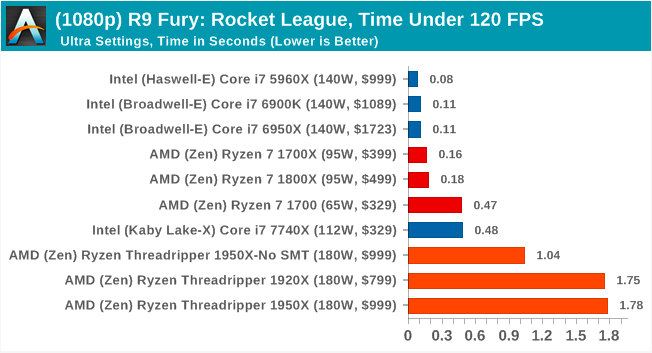
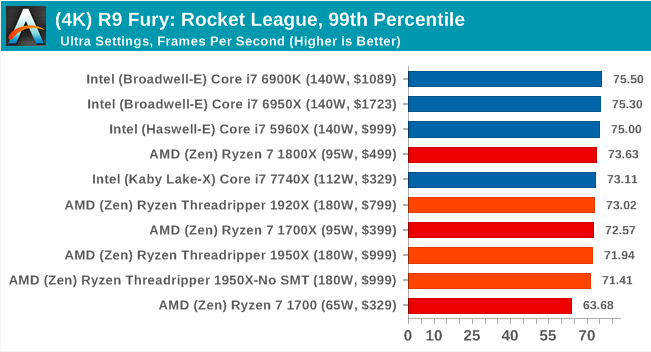
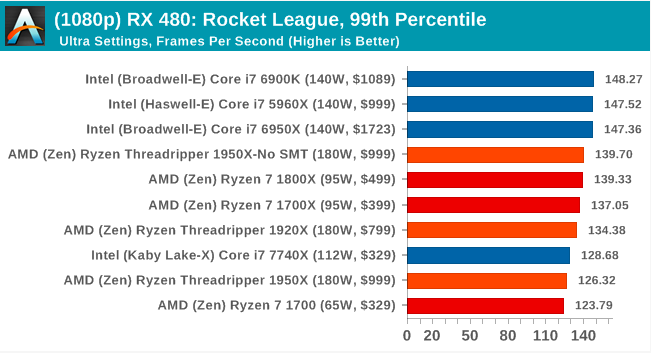
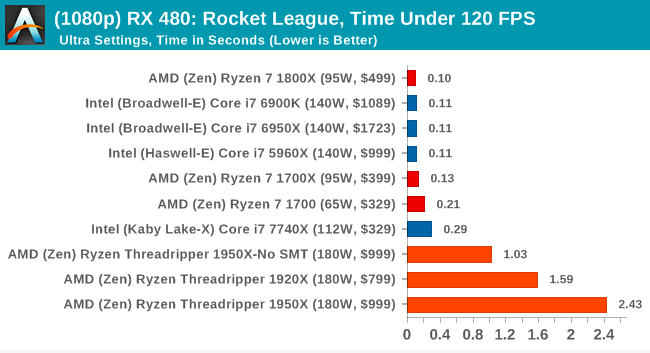
17. Rocket League
Fun, simple play-and-pick games are great fun. For this reason, I'm a big fan of the Katamari franchise - just press the start on the controller and roll forward, picking up items to grow. Extremely simple. In the meantime, we will not get the PC version of Katamari that I can test, we will focus on the Rocket League.
Rocket League uses pick-up-and-play elements, allowing users to play with other people (or bots) to play football without rules in cars. The game was created on the Unreal Engine 3 engine, which is currently outdated, but it allows users to both run the game on low-performance systems and squeeze all the resources from the systems more powerful. Since its release in 2015, more than 5 million copies of the game have been sold, which seems to have become a star in local networks and game shows. Users who train to play become very serious, fighting in teams and leagues with a very small number of settings, and all are on the same level. Rocket League is confidently becoming one of the big names in the world of eSports, and what is especially nice is that the competitions can be viewed directly from the game interface.
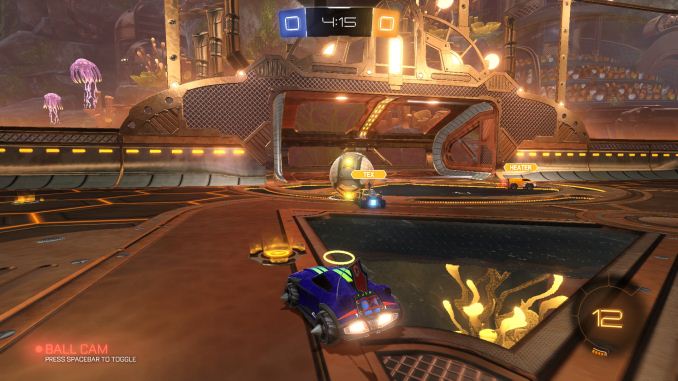
Based on these factors, and also because this game is nice to run and play, we decided to find a “pleasant” way to test it. Unfortunately, most of the automatic tests for games will not work here. In addition, thanks to the Unreal 3 engine, the Rocket League does not have a benchmark mode. In this case, we must develop a tight run and record the frame rate.
As already mentioned, the Rocket League does not have a benchmark mode, so we have to perform a series of automatic actions, like a racing game with a fixed number of laps. We use the following approach: using Fraps to record the time taken to display each frame (and the total frame rate), we use an automation tool to start the game with 4v4 bots, while the system must perform a series of actions during the match, for example, switching angles cameras and movement.
It turned out that the described method very accurately displays data on a real match with bots, including movement, collisions, amplifications, or even getting sudden help, no matter how strange it sounds for an automated command set. To maintain consistency, the commands we use are not random, as well as fixed in time. We also conduct tests on the same card (Aquadome, which, as you know, is a heavy card for graphics processors due to water / transparency) and with constant vehicle settings. We start recording immediately after the start of the match and record for 4 minutes of playing time (I think 5 laps DIRT: Rally benchmark), determine the average frame rate, the 99th percentile and time under.

Graphic settings for the Rocket League are presented in four general settings: Low, Medium, High and High FXAA. There are advanced settings for shadows and details; however, for these tests we follow the general settings. For 1920x1080 and 4K resolutions, we test on a high preset without FPS restrictions.
MSI GTX 1080 Gaming 8G Performance
1080p


4K


4K
ASUS GTX 1060 Strix 6G Performance
1080p

4K


4K
Sapphire Nitro R9 Fury 4G Performance
1080p

4K


4K
Sapphire Nitro RX 480 8G Performance
1080p

4K


4K
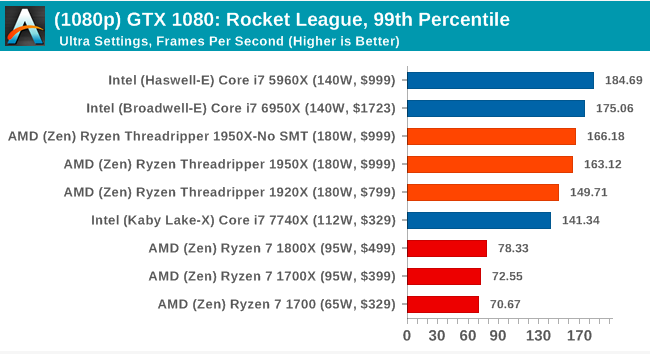
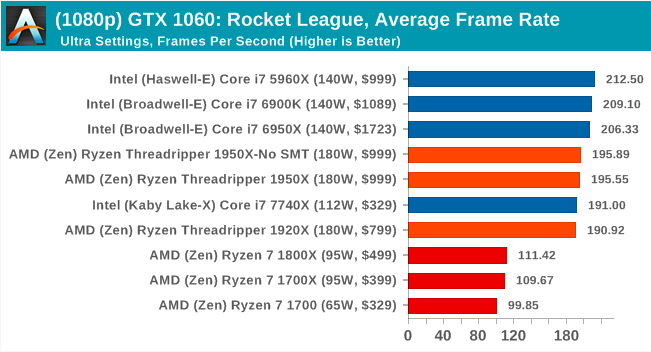
With Ryzen, we encountered some strange problems using NVIDIA based graphics cards, which led to a significant performance degradation of these cards. Oddly enough, the problems that we have with Ryzen in the Rocket League with NVIDIA GPUs virtually disappear when using Threadripper. Again, there is still no clear winner in this test, since Intel seems to be better at showing itself in the Rocket League in normal mode, but the SMT-off mode still raises the 1950X level. Time Under results are a concern for AMD, and the 1950X is consistently at the bottom of this graph.
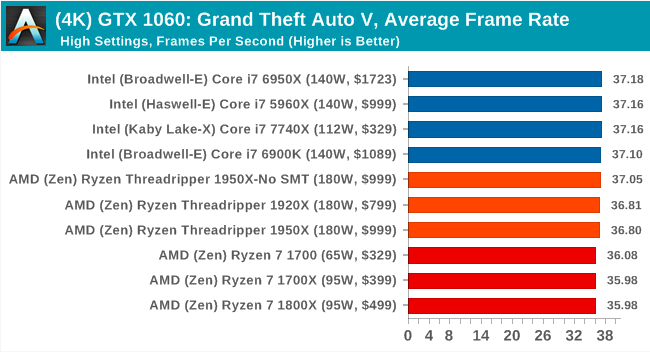
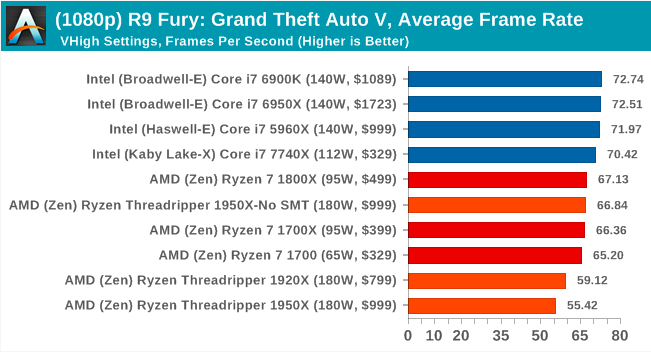
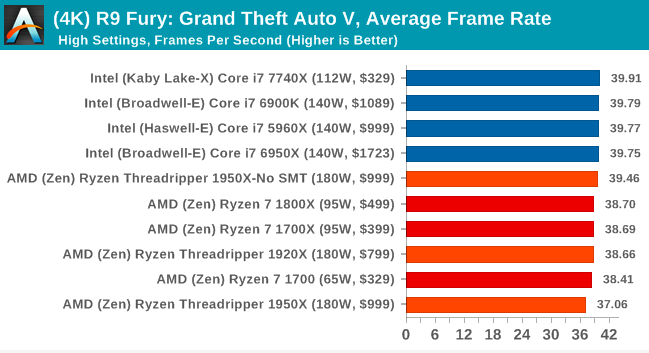
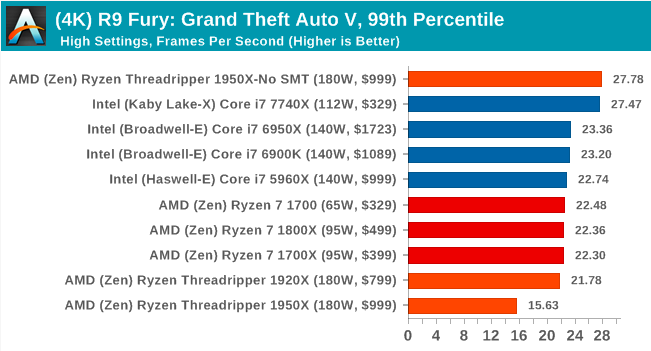
18. Grand Theft Auto
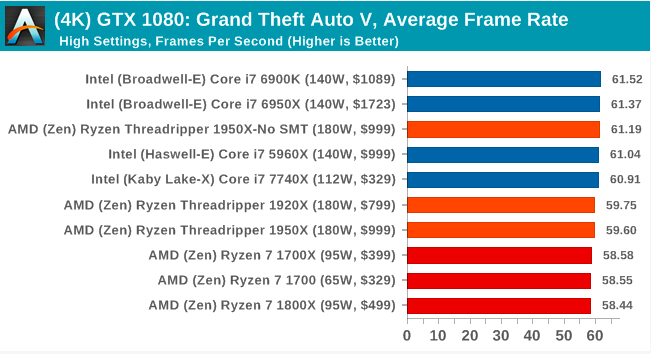
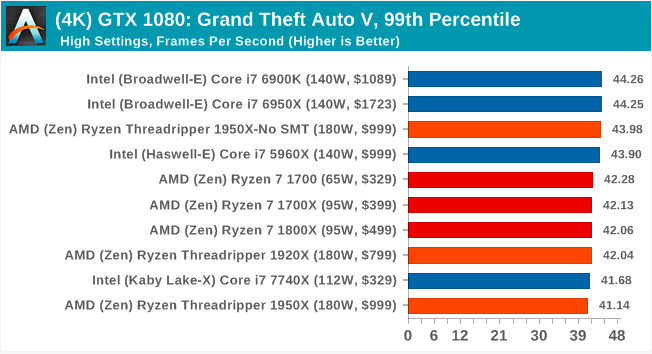
The long-awaited iteration of the Grand Theft Auto franchise hit the shelves on April 14, 2015, and AMD and NVIDIA made efforts to optimize the game. There are no graphic presets in GTA, but still the game opens up new possibilities for users and expands the boundaries of modern graphics, loading even the most powerful computers to the limit with the aid of the Rockstar Advanced Game Engine under DirectX 11. Regardless of whether the user flies high in the mountains, where you need to draw the world at long distances or deal with sorted garbage in the city, when it is bent to the maximum, the game creates stunning visual effects, plus hard work for both the processor and the graphics card.
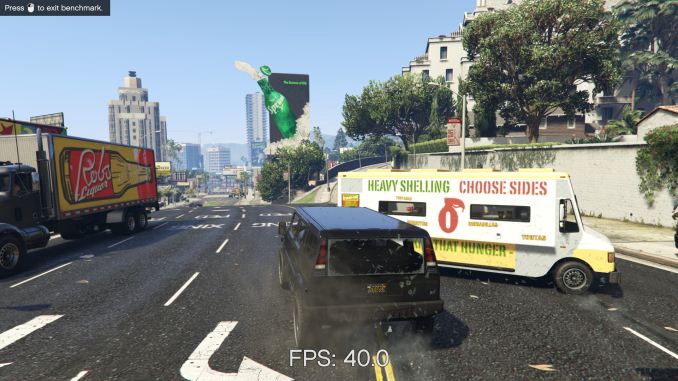
For testing, we wrote several scripts for the benchmark built into the game. The internal benchmark will include five scenarios: four short panoramic scenes with variable lighting and weather effects, plus a fifth - a sequence of actions lasting about 90 seconds. We decided to use only the last scene, which includes a jet flight, then a car ride through the city through several intersections and at the end - a collision with a gasoline tank truck that explodes like the cars around it. This is a great combination of long-distance rendering, followed by short-range rendering. And fortunately, the game gives all the necessary test results.
There are no graphical presets in GTA, but the user can manually adjust the parameters, such as population density and drawing distance using the sliders. Other parameters such as texture / shadow / shaders / water quality switch from low quality to very high. Other customization options include MSAA, soft shadows, post effects, shadow resolution, and advanced remote rendering settings. At the top of the screen there is a convenient option that shows how much video memory the game will consume with these parameters, with obvious consequences if the user requests more video memory than he has on the card (although there is no obvious clue if you have a weak GPU with more video memory, for example, R7 240 4 GB).
As a result, we run tests in the resolution of 1920x1080, using the Very High values in the settings, as well as on 4K using the High value in most of them. The result will be averaged over four runs, average frame rate, 99th percentile, and time-under analysis.
MSI GTX 1080 Gaming 8G Performance
1080p


4K


4K
ASUS GTX 1060 Strix 6G Performance
1080p


4K

4K
Sapphire Nitro R9 Fury 4G Performance
1080p

4K


4K
Sapphire Nitro RX 480 8G Performance
1080p


4K

4K
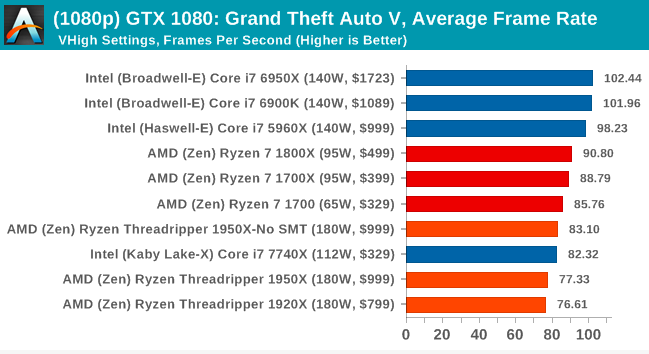
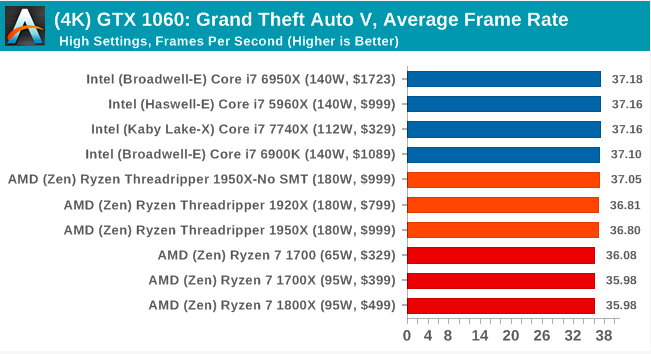
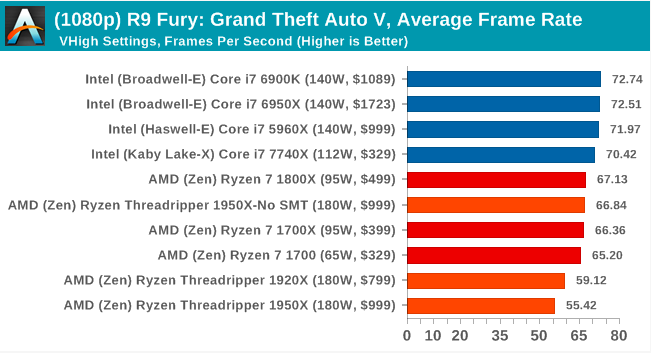
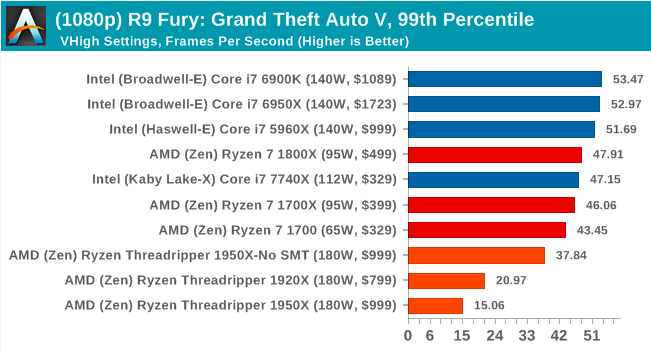
Depending on the test, in most cases the Threadripper produces results similar to the Ryzen, and sometimes just below it.
19. Energy consumption, energy efficiency
A threadripper with a processor cooling system designed for discharging thermal power of 180 W. TDP (thermal design power) is a big leap forward, following previous AMD solutions that operate in the 40-95 W range, or Intel's platforms, where most processors have TDP up to 95 watts, and high-end 140 watts. Although let's not forget that AMD has already released a processor with 220W TDP - this is the FX-9590, clocked at 5 GHz, which was initially sold during the year as a product exclusively for OEMs, to be sure that users will have enough powerful cooling. In the end, it was released as an end product with a cooler with a liquid cooling system and two fans.
AMD's 5GHz Turbo CPU in Retail: The FX-9590 and ASRock 990FX Extreme9 Review
Thus, the TPD 180W is still not a new concept for AMD. For this review, I used AMD liquid cooling, obtained at one time with the FX-9590, because it was designed to run at least 220 watts. (AMD also provided the Thermaltake 3x120 cooler with the Threadripper, but it was much more difficult to attach on our test bench.)
For power testing, we run Prime95 for at least 60 seconds, and then use the software to poll the on-chip power sensors for results. Depending on the CPU, we can get data for the entire chip, core, DRAM, uncore, or integrated GPU - it is important that our tool has the latest update, as the registers must be known to receive this data. Usually, this method of reading energy consumption may not be sufficiently accurate compared to more invasive methods; it is fast and affordable for managing scripts. In addition, it is these data that determine when the CPU reaches its power limits and needs to increase the fan speed.
For a start, let's see the full power consumption of the Threadripper.

In general, the Threadripper is very voracious, even at idle. Most of the power here is consumed by a memory controller and a PCIe bus to support a graphics processor with a static display. The fact that the 1950X memory, which runs on DDR4-3200, draws another 13 W + from the CPU, shows the effect the memory controller has on the overall power consumption. For all chips, we write 2 watts of power for the cores.
When we load the processor in one thread, it starts uncore / mesh, as well as memory, and goes into maximum turbo mode. Depending on how the processor is designed, it can load one core or several at once - and then, although only one core will do the work, the rest will still increase power consumption.

The results show that the different Threadripper processors again show approximately the same result, consuming significantly more Ryzen processors, and correspond to the CPU 10C / 8C from Broadwell-E and Haswell-E, respectively. The 1950X, running on the DDR4-3200, still pulls an extra + 13W, but it's interesting that the power consumption of the Skylake-X cores jumped to about the same magnitude. It seems that the MoDe-X connection used in Skylake-X also consumes significant power.
In the next test, we will load the processor with the maximum number of threads for this chip design. This approach will provide the maximum load on all cores, memory controller and interconnect.

All Threadripper processors reached 177 W, just below 180 W of TDP, and Skylake-X processors exceeded their stated 140 W of TDP. The 1950X in Game Mode seems to consume a little less power, which may be due to the launch of DRUM in NUMA.
For some chips, we can only see the power consumption of the cores. And at full load we got curious results:

A key element on this chart is the 1950X, running on DDR4-3200. Since faster DRAM requires the memory controller to consume more power, it leaves less energy for the processor cores, which can lead to a lower turbo frequency. Therefore, while faster memory can guarantee better performance in memory-dependent scenarios, the core frequency may turn out to be lower, yielding worse overall performance. This is an interesting observation, so we calculated the power of the core in the 1950X on DDR4-2400 and DDR4-3200.

On this graph, the number of the core on the vertical axis is the core where power was measured, and on the horizontal one the number of cores that were loaded, two threads at a time.
Initially, we see that when loading two threads of a single core, this single-core device consumes 20.77 watts. From the moment when half the cores of the chip is loaded, the indicator will drop to 19 W, then to 17 W, 16 W, and to 11 W. As we see, when loading 8 cores, the cores themselves consume 89 watts - and if we add DRAM controller consumption, the result will certainly be more than the Ryzen processor. However, as we load more than 10 cores, something strange happens: the total power consumption of cores drops from 120 watts to 116 watts, and to 102 watts when 24 threads are running. This suggests that the second layer of the silicon matrix consumes less energy per core. Then, consumption rises again, with a fully loaded chip giving each core about 8.2 watts.
Switching to DDR4-3200 memory shows a similar scenario:

First, one core gets as much as 21 W, and then, as new cores load, at around 4 cores / 8 threads, we see less consumption - 15 W per core on DDR4-3200 (compare with 16 W per core on DDR4-2400). Moving further, we observe a slight oscillation at 24-26 threads, and as a result, at full load, - consumption of 114 W by all cores, which is 20 W less than on DDR4-2400.
Not all the data for Game Mode was obtained properly, so we will not dare to draw deep conclusions from the results, although it is worth making an interesting observation. In game mode, when the system requires a small number of threads, say from 2 to 8, since SMT is disabled, these threads must run on different CCX. In Creator mode, these streams are grouped into 1-4 cores one by one CCX and consume less power. For DDR4-2400, this means 65 W in Creator mode for 8 threads (4 cores) compared to 89 W in Game mode for 8 active cores.
20. Analysis Creator Mode and Game Mode
As mentioned on page 3 of this review, AMD offers two modes: Creator mode with all cores turned on and uniform memory access (UMA) architecture, and Game mode, where one of the matrixes is disabled and the architecture is adjusted to non-uniform memory architecture (NUMA) . The idea is that in Creator mode you have all the streams and bandwidth at your disposal, while Game Mode focuses on compatibility with games that are not ready to work with so many cores, while increasing the speed of data transfer to the memory and from the core to the core, and maintaining flows within the same layer of silicon.
Both methods have their positive and negative sides. And although they can switch by pressing the button in the Ryzen Master and then rebooting, most users who are interested in these settings will surely select the desired mode once and forget about it (And here, note that if the BIOS is reset, then the settings too. ..)

21. Conclusion
In this review, we looked at several important topics regarding processors with a large number of cores: power, frequency, and "feeding the beast." Running the processor is like a reverse diet - you need to put as much data as possible to get at least something on the way out and understand what is hidden “under the hood”.
AMD and Intel use different approaches to achieve the goal. We see a solution with several matrices against a monolithic solution. Complexes of cores and Infinity Fabric against mesh based on MoDe-X. Single memory access versus non-uniform memory access. Both those, and others struggle for high frequency and low energy consumption. AMD supports ECC and more PCIe-bands, while Intel provides a more complete chipset and special instructions for the AVX-512. Both competitors are fighting for the market for high-end prosumer and workstations, which contributes to high-performance multitasking scenarios as a key to unlocking the potential of their processors.

Here's what we see in the specification: compared to the Core i9-7900X, the AMD Ryzen Threadripper 1950X has 6 more cores, plus an additional 16 PCIe lanes and ECC support for the same price. Compared to the outgoing 16-core Core i9-7960X, the Threadripper 1950X still has the advantage of 16 PCIe lanes, ECC support, and a noticeably cheaper competitor.
The 1920X processor offers the user more cores, ECC support, and more than twice as many PCIe lanes as compared with the Core i7-7820X for a difference of $ 100. Simply put, if there is hardware requiring PCIe lanes, AMD has something to offer.

As for performance tests, there are several views for describing our results. AMD still lags behind when it comes to raw IPC, but it shows decent results in frequency. Intel still wins in single-threaded tasks, especially those that depend on DRAM latency. AMD takes the lead when a task requires serious threads, often allocating memory is not as problematic as it might seem. If the user has a scalable workload, AMD will give the kernel to allow it to scale as widely as possible.

Despite the fact that the design of the Threadripper, perhaps better suited for high-loaded work tasks, its high frequency compared to the Ryzen 7 means that gaming will become part of the "equation". In its default Creative mode, the gaming performance of the Threadripper at best occupies middle ground: very few games can use all of these threads, and the variable latency of DRAM means that the kernels sometimes, roughly speaking, stumble against each other, trying to “communicate” and predict when work will be done. To solve this problem, AMD offers a game mode that reduces the number of cores and focuses memory allocation in DRAM closest to the core (to the detriment of the maximum DRAM throughput). This has the greatest impact on the minimum frame rate, and not on the average FPS and affects 1080p more than 4K, which is perhaps the opposite of the expectations of a high-end gamer. On some games, Game mode has no effect, while in others it may open up new possibilities.
If I took and said that the Threadripper processors are not, in general, processors, it would cause irritation from the technical audience. A better answer is not the best gaming processor. But AMD covers all this on the other hand: the processor allows the user to play, transmit stream, watch and process everything at the same time.
You have to do a lot at once to fill the 16 cores to the maximum, which means for those who do, AMD is a potential winner. For those who need hardcore bandwidth, transcoding, decoding; rendering such as Blender, Cinema 4D, or ray tracing is a great processor. For owners of several GPUs or multi-storage fans, or those who want to squeeze six PCIe 3.0 x8 FPGAs into the system, AMD offers a good product.

On the other hand, no matter how cool the 16 cores look in the consumer processor (and in this sense, the entire Threadripper looks cool - in the style of the 90s hardcore) - Threadripper threads are not always useful for consumer loads. Just a few well-known workloads can completely saturate a chip: video encoding is the best example. The rest simply can not use more than a few threads. This fact is largely due to the fact that over the past 8 years, quad-core Intel chips have been a sample of high-performance consumer processors. However, Amdahl’s annoying law is always nearby, and the number of cores in processors continues to grow.
There is also an unpredictable factor - this is the area where AMD is the pioneer: the uneven distribution of cores. NUMA has never been focused on consumers, so AMD and is faced with the problems discussed in our review.
The presence of several modes is a very smart choice, especially since there is a lot of software there that “does not know” about NUMA, but it can load the CPU well if NUMA is removed from the equation, and the processor is considered as a completely monolithic device. Somewhat unpleasant, however, is the fact that switching modes require a reboot; You can get good returns by switching modes, but this will require extra movement. In the long term, NUMA-enabled code will remove this problem and automatically use the memory with the least delay. But even in this case, AMD has created not only a solution, but also a problem, since even ideally NUMA will create a number of programming problems, and it is unlikely that every program will be able to use it correctly in the future.
With that said, a NUMA processor is currently somewhat redundant in consumer space. It is very good for certain extreme loads, but not as well balanced as Ryzen. Rejecting too much, this means that the Threadripper does not always give a noticeable performance boost compared to the Ryzen. And this is not a feature unique to AMD - for a long time Intel HEDT products required a choice between the number of cores and single-threaded top-level performance, but it was even more difficult to calculate CPU performance with Threadripper. There are difficulties in scaling the processor to so many cores, and the Threadripper carries this burden. Therefore, for consumers (and this is the market where the processor is aimed), it is more important than ever to consider your planned workloads. Do you need faster Handbrake encoding or smoother gameplay? Can you throw enough cores on the Threadripper to keep the beast busy, or do you only occasionally need more than the existing 8 Ryzen cores?

AMD promised that the socket will live for at least two generations, so the Threadripper 2000 series, when it appears, should come right after the BIOS update. Interestingly, given the size of the socket and the configuration of the matrix, AMD can easily turn these two "dead" silicon packets into "real" silicon packets and offer 32 cores. (Although these additional cores are a bottleneck in the access speed issue).
These are the Wars of the Nuclear. We are approaching the first chip that can make the Kessel run less than twelve parsec (a reference to “Star Wars” - approx. Transl.)
As advertising. On the eve of the winter holidays promotions become even more relevant! Hurry up to take advantage of the New Year offer and get a 25% discount on the first payment when ordering for 3 or 6 months!
These are not just virtual servers! This is a VPS (KVM) with dedicated drives, which can be no worse than dedicated servers, and in most cases - better! We made VPS (KVM) with dedicated drives in the Netherlands and the USA (configurations from VPS (KVM) - E5-2650v4 (6 Cores) / 10GB DDR4 / 240GB SSD or 4TB HDD / 1Gbps 10TB available at a uniquely low price - from $ 29 / month , options are available with RAID1 and RAID10) , do not miss the chance to place an order for a new type of virtual server, where all resources belong to you, as on a dedicated one, and the price is much lower, with a much more productive hardware!
How to build the infrastructure of the building. class c using servers Dell R730xd E5-2650 v4 worth 9000 euros for a penny? Dell R730xd 2 times cheaper? Only we have 2 x Intel Dodeca-Core Xeon E5-2650v4 128GB DDR4 6x480GB SSD 1Gbps 100 TV from $ 249 in the Netherlands and the USA!
All Articles