What is a proton, and what is inside?
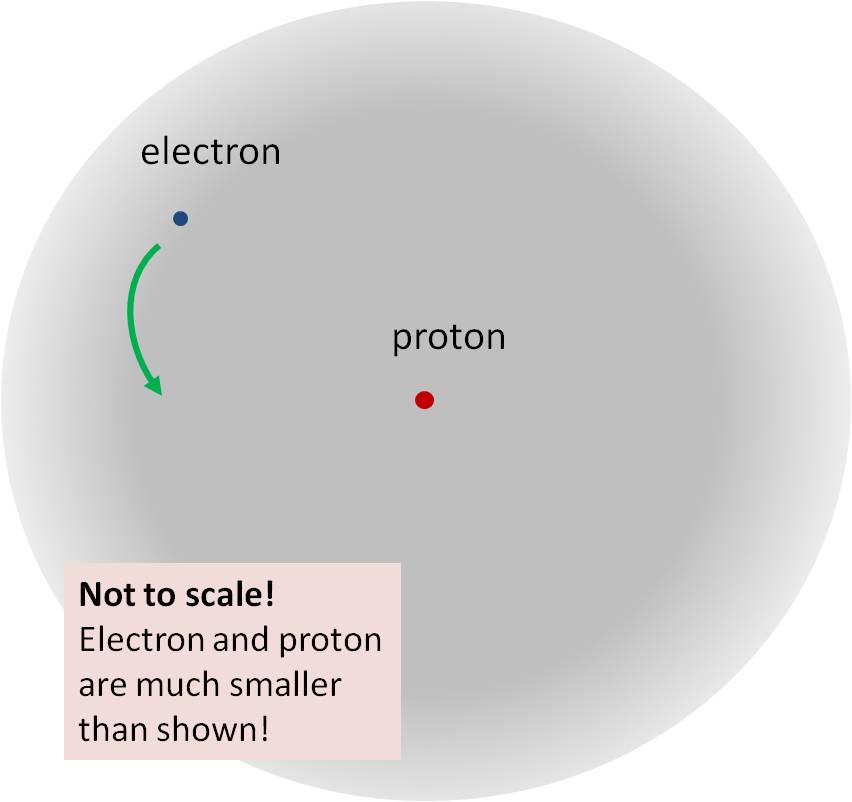
Fig. 1: a hydrogen atom. Not to scale.
You know that the Large Hadron Collider is mainly engaged in colliding protons with each other. But what is a proton?
In the first place - a terrible and complete confusion. As ugly and chaotic as a simple and elegant atom of hydrogen.
But then what is a hydrogen atom?
This is the simplest example of what physicists call the “bound state”. “State”, in essence, means a certain thing that has existed for quite a long time, and “connected” means that its components are connected to each other, as if the spouses were married. In fact, an example of a married couple in which one spouse is much heavier than the other is very well suited here. The proton sits in the center, barely moving, and at the edges of the object the electron moves, moves faster than you and me, but much slower than the speed of light, the general speed limit. The peaceful image of the marriage idyll.
Or it seems so, until we look at the proton itself. The entrails of the proton itself more closely resemble a commune, where many idle adults and children are densely located: pure chaos. This is also a bound state, but it does not connect something simple, like a proton with an electron, as in hydrogen, or at least several dozen electrons with an atomic nucleus, as in more complex atoms like gold - but an infinite number (that is, too many they change too quickly so that they can be calculated in practice for lightweight particles called quarks, antiquarks and gluons. It is impossible to simply describe the structure of the proton, draw simple pictures - it is extremely disorganized. All quarks, gluons, antiquarks, rush inside as fast as possible, almost at the speed of light.
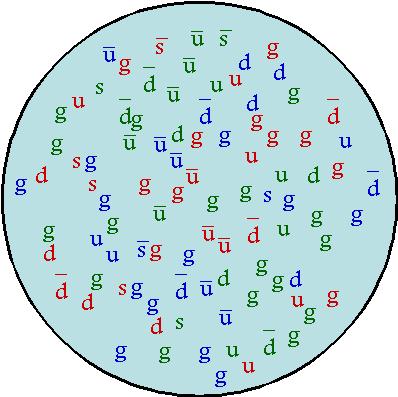
Fig. 2: Proton image. Imagine that all quarks (top, bottom, strange - u, d, s), antiquarks (u, d, s with a dash), and gluons (g) move back and forth almost at the speed of light, collide with each other, appear and disappear
You could hear that a proton consists of three quarks. But this is a lie - for the good, but still quite large. In fact, there are a myriad of gluons, antiquarks and quarks in the proton. The standard abbreviation “proton consists of two upper quarks and one lower quark” simply means that in a proton there are two upper quarks more than the upper antiquarks, and one lower quark more than the lower antiquarks. In order for this reduction to become true, it is necessary to add to it "and yet countless quantities of gluons and quark-antiquark pairs". Without this phrase, the idea of the proton will be so simplified that it will be absolutely impossible to understand the work of the LHC.
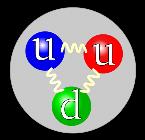
Fig. 3: A little lie to the benefit of the stereotypical image from Wikipedia
In general, atoms compared with protons are similar to pas de deux in exquisite ballet compared to a disco filled with drunk teenagers jumping and waving a DJ.
That is why if you are a theorist trying to understand what he sees the LHC in proton collisions, it will be difficult for you. It is very difficult to predict the results of collisions of objects that cannot be described in a simple way. But, fortunately, since the 1970s, on the basis of the ideas of Bjorken from the 60s, theoretical physicists have found a relatively simple and working technology. But it still works up to certain limits, with an accuracy of the order of 10%. For this and some other reasons, the reliability of our calculations for the LHC is always limited.
Another detail about the proton - it is tiny. Really tiny. If you inflate a hydrogen atom to the size of your bedroom, the proton will be the size of such a small particle of dust that it will be very difficult to notice. It is precisely because the proton is so small that we can ignore the chaos created inside it, describing the hydrogen atom as simple. More precisely, the proton size is 100,000 times smaller than the size of a hydrogen atom.
For comparison, the size of the Sun is only 3000 times smaller than the size of the Solar System (if you count in the orbit of Neptune). That's right - in the atom more empty than in the solar system! Remember this when you look at the sky at night.
But you can ask: “Wait a second! Are you saying that the Large Hadron Collider somehow collides protons that are 100,000 times smaller than an atom? How is that even possible? ”
Great question.
Collisions of protons against mini-collisions of quarks, gluons and antiquarks
Proton collisions at the LHC occur with a certain amount of energy. This was 7 TeV = 7000 GeV in 2011, and 8 TeV = 8000 GeV in 2012. But particle physics experts are mostly interested in the collisions of a quark of one proton with an antiquark of another proton, or collisions of two gluons, etc. - what may lead to the emergence of a truly new physical phenomenon. These mini-collisions carry a small fraction of the total proton collision energy. How much of this energy can they transfer, and why was it necessary to increase the collision energy from 7 TeV to 8 TeV?
The answer is in fig. 4. The graph shows the number of collisions recorded in the ATLAS detector. The data from the summer of 2011 involve the scattering of quarks, antiquarks, and gluons from other quarks, antiquarks, and gluons. Such mini-collisions most often produce two jets (jets of hadrons, manifestations of high-energy quarks, gluons, or antiquarks knocked out from parent protons). They measure the energies and directions of the jets, and from this data determine the amount of energy that was supposed to participate in the mini-collision. The graph shows the number of mini-collisions of this type as a function of energy. The vertical axis is logarithmic - each dash indicates an increase in the number of 10 times (10 n means 1 and n zeros after it). For example, the number of mini-collisions observed in the interval of energies from 1550 to 1650 GeV was about 10 3 = 1000 (marked by blue lines). Consider that the schedule starts with an energy of 750 GeV, but the number of mini-collisions continues to grow if you study jets with lower energies, right up to the point where the jets become too weak to detect them.
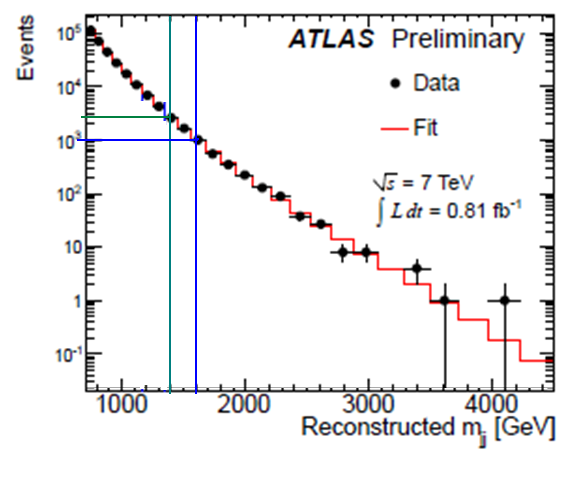
Fig. 4: number of collisions as a function of energy (m jj )
Consider that the total number of collisions of a proton-proton with an energy of 7 TeV = 7000 GeV approached 100,000,000,000,000. And of all these collisions, only two mini-collisions exceeded 3500 GeV - half the proton collision energy. Theoretically, the mini-collision energy can increase to 7000 GeV, but the probability of this decreases all the time. We so rarely see mini-collisions with an energy of 6000 GeV that we hardly see an energy of 7000 GeV, even if we collect 100 times more data.
What are the advantages of increasing collision energy from 7 TeV in 2010-2011 to 8 TeV in 2012? Obviously, now that you could do at energy level E, now you can do at energy level of 8/7 E ≈ 1.14 E. So, if you could hope to see in such amount of data signs of a certain type of hypothetical particle with mass of 1000 GeV / s 2 , then we can now hope to achieve at least 1100 GeV / s 2 with the same data set. The capabilities of the machine increase - you can search for particles of a slightly larger mass And if in 2012 you gather three times more data than in 2011, you will get a greater number of collisions for each energy level, and you will be able to see signs of a hypothetical particle of, say, 1200 GeV / s 2 .
But that is not all. Look at the blue and green lines in fig. 4: they show that they occur at energies of the order of 1400 and 1600 GeV — such that they correlate with each other, like 7 to 8. At the level of the collision energy of 7 TeV protons, the number of mini-collisions of quarks with quarks, quarks with gluons, etc. P. with an energy of 1400 GeV is more than twice the number of collisions with an energy of 1600 GeV. But when a car increases energy by 8/7, what was done for 1400 starts for 1600. In other words, if you are interested in fixed energy mini-collisions, their number grows - and much more than 14% increase in proton collision energy! This means that for any process with a preferred energy, say, the appearance of lightweight Higgs particles, which occurs at energies of the order of 100-200 GeV, you get more results for the same money. Growth from 7 to 8 TeV means that for the same number of proton collisions you get more Higgs particles. Higgs particle production will increase by about 1.5. The number of upper quarks and certain types of hypothetical particles will increase slightly stronger.
This means that although in 2012 the number of proton collisions increased by 3 times compared to 2011, the total number of Higgs particles obtained will increase by almost 4 times simply due to the increase in energy.
By the way, rice. 4 also proves that protons do not consist simply of two upper quarks and one lower quark, as depicted in figures like fig. 3. If they were such, then quarks would have to carry about a third of the proton energy, and most of the mini-collisions would take place with energies of the order of a third of the proton collision energy: around 2300 GeV. But the graph shows that in the area of 2300 GeV nothing special happens. With energies less than 2300 GeV, much more collisions occur, and the lower you go down, the more collisions you see. This is because the proton contains a huge amount of gluons, quarks and antiquarks, each of which carries a small part of the proton energy, but there are so many of them that they participate in a huge number of mini-collisions. This property of the proton is shown in Fig. 2 - although in fact the number of low-energy gluons and quark-antiquark pairs is much larger than shown in the figure.
But what the graph doesn’t show is the fractions that, with mini-collisions with a certain energy, occur in collisions of quarks with quarks, quarks with gluons, gluons with gluons, quarks with antiquarks, etc. In fact, directly from the experiments at the LHC, this cannot be said - jets from quarks, antiquarks and gluons look the same. Whence we know these fractions - this is a complex story; it includes many different past experiments and their combining theory. And from here we know that the highest-energy mini-collisions usually occur in quarks with quarks and in quarks with gluons. Low energy collisions usually occur between gluons. Clashes of quarks and antiquarks occur relatively rarely, but they are very important for certain physical processes.
Particle distribution inside the proton
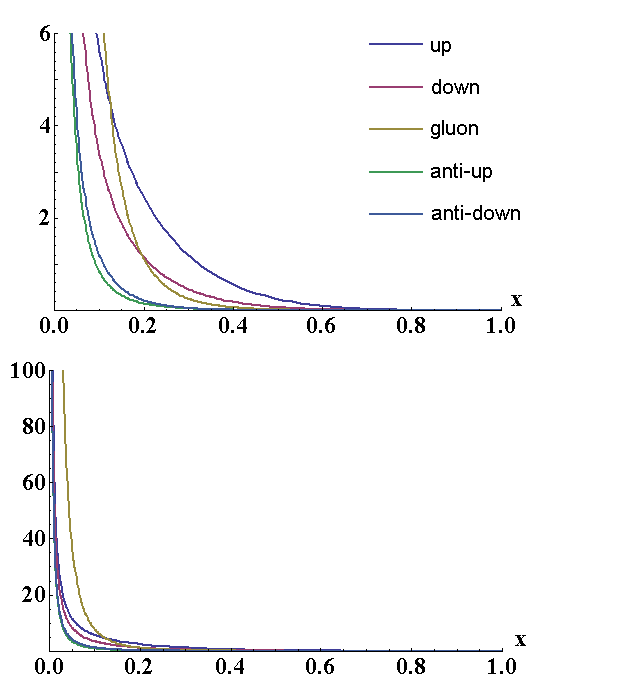
Fig. five
Two graphs differing in the scale of the vertical axis show the relative probability of a collision with a gluon, an upper or lower quark, or an antiquark transferring a proton energy fraction equal to x. At small x, gluons dominate (and quarks and antiquarks become equally probable and numerous, although they are still smaller than gluons), and at medium x, quarks dominate (although they become extremely small).
Both graphs demonstrate the same thing, just with a different scale, so what is difficult to see on one of them is easier to see on the other. And they show this: if a proton beam flies at you at the Large Hadron Collider and you strike something inside the proton, how likely is it that you hit the top quark, or the bottom quark, or the gluon, or the top antiquark, or the bottom antiquark carrying a fraction of proton energy equal to x? From these graphs it can be taken out that:
• From the fact that all curves grow very quickly with small x (seen in the lower graph), it follows that most of the particles in the proton transfer less than 10% (x <0.1) of the proton energy, and the probability of colliding with a particle that carries little energy, much more likely to collide with a particle transporting a lot. At the same time, 10% is not so little. In 2012, the rays at the LHC reached energies of 4 TeV, so 10% meant 400 GeV. At the same time, in order to create a 124 GeV Higgs particle of two gluons, only 62 GeV per gluon is required.
• From the fact that the yellow curve (below) is much higher than the others, it follows that if you encounter something that carries less than 10% of the proton energy, then this is most likely a gluon; and dropping below 2% of the proton energy, it is equally likely to be quarks or antiquarks.
• From the fact that the gluon curve (at the top) falls below the quark curves with increasing x, it follows that if you encounter something that carries more than 20% (x> 0.2) of proton energy - which happens very, very rarely - this is most likely a quark, and the probability that this is the top quark is twice as likely as the bottom quark. These are the remnants of the idea that “a proton is the two upper quarks and one lower”.
• All curves decrease sharply with increasing x; it is very unlikely that you will encounter anything carrying more than 50% of the proton energy.
These observations are indirectly reflected in the graph from fig. 4. Here are a couple of unobvious things about the two graphs:
• Most of the proton energy is divided (approximately equally) between a small number of high-energy quarks and a huge number of low-energy gluons.
• Among the particles, low-energy gluons dominate in their number, followed by quarks and antiquarks of very low energies.
The number of quarks and antiquarks is huge, but: the total number of upper quarks minus the total number of upper antiquarks is two, and the total number of lower quarks minus the total number of lower antiquarks is equal to one. As we saw above, the extra quarks carry a tangible (but not the main) part of the proton energy that flies towards you. And only in this sense it can be said that the proton consists mainly of two upper quarks and one lower.
By the way, all this information was obtained from an exciting combination of experiments (mainly on the scattering of electrons or neutrinos from protons or from atomic nuclei of heavy hydrogen - deuterium containing one proton and one neutron), gathered together using detailed equations describing electromagnetic, strong nuclear and weak nuclear interactions. This long story stretches from the late 1960s and early 1970s. And it works great for predicting the phenomena observed in colliders, where protons collide with protons and protons with antiprotons, such as Tevatron and LHC.
Other evidence of the complex structure of the proton
Let's look at some of the data obtained at the LHC, and how they confirm the assertions about the structure of the proton (although the current understanding of the proton appeared already 3-4 decades ago, thanks to many experiments).
The graph in fig. 4 is derived from observations of collisions, during which something like the one shown in fig. 6: a quark or antiquark or gluon of one proton collides with a quark or antiquark or a gluon of another proton, disperses from it (or something more complicated happens - for example, two gluons collide and turn into a quark and antiquark), resulting in two particles (quarks, antiquarks or gluons) fly away from the collision point. These two particles turn into jets (streams of hadrons). The energy and direction of the jets are observed in particle detectors surrounding the collision point. This information is used to understand how much energy was contained in the collision of two original quarks / gluons / antiquarks. More precisely, the invariant mass of two jets, multiplied by c 2 , gives the collision energy of two original quarks / gluons / antiquarks.
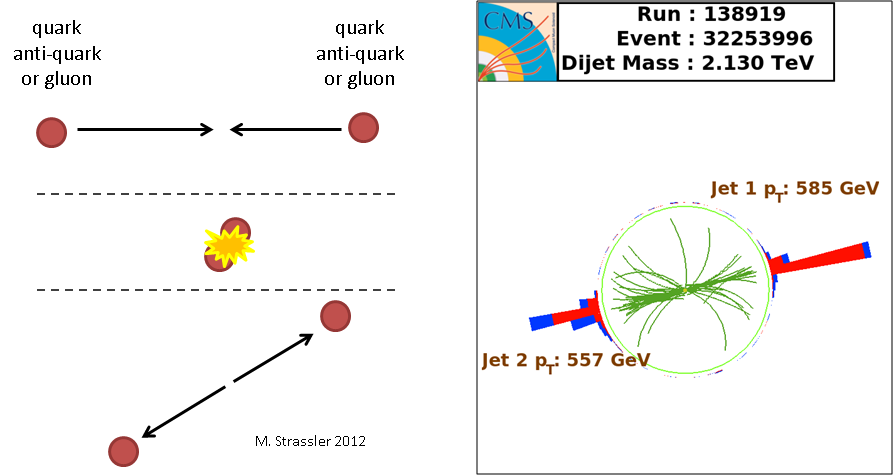
Fig. 6
The number of collisions of this type depending on the energy is given in Fig. 4. The fact that at low energies the number of collisions is much larger is confirmed by the fact that most of the particles inside the proton carry only a small fraction of its energy. The data starts with energies of 750 GeV.
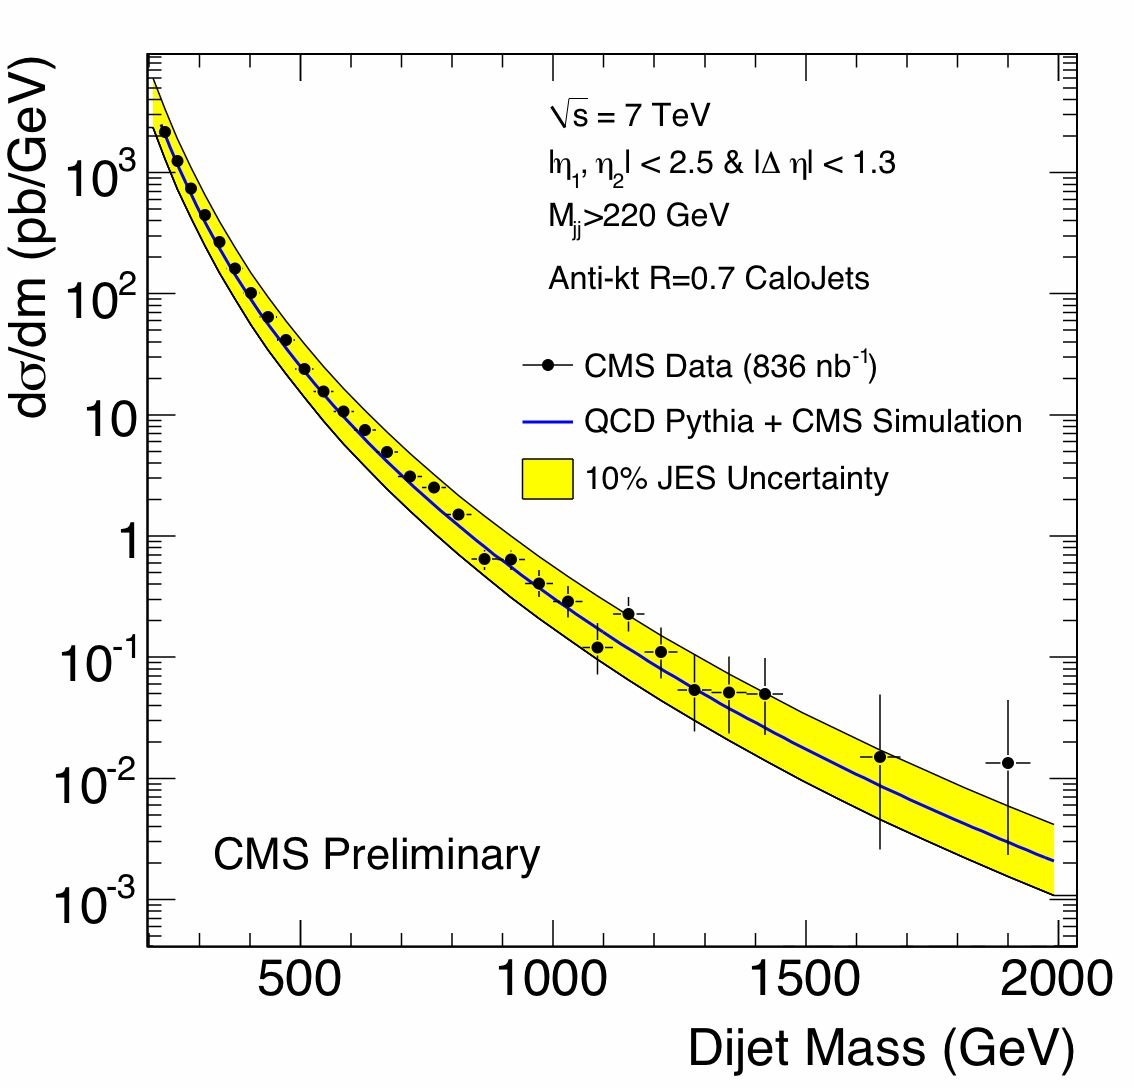
Fig. 7: data for lower energies taken from a smaller data set. Dijet mass is the same as m jj in fig. four.
Data for fig. 7 are taken from the CMS experiment from 2010, on which they plotted a collision of flesh to energies of 220 GeV. Here, the graph is not the number of collisions, but a bit more complicated: the number of collisions per GeV, that is, the number of collisions is divided by the width of the histogram column. It can be seen that the same effect continues to work on the entire data range. Collisions such as those shown in Fig. 6, much more happens at low energies than at high energies. And this number continues to grow until it becomes impossible to distinguish jets. The proton contains a lot of low-energy particles, and few of them carry a significant proportion of its energy.
What about the presence of antiquarks in proton? Three of the most interesting processes not similar to the collision shown in fig. 6, sometimes occurring at the LHC (in one of several millions of proton-proton collisions) include the process:
Quark + Antiquark -> W + , W - or Z-particle.
They are shown in Fig. eight.
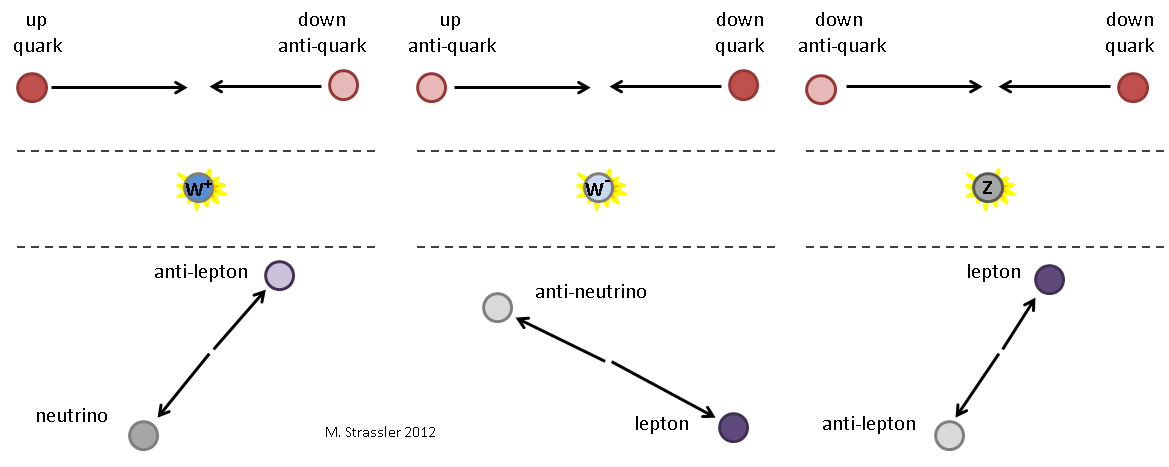
Fig. eight
The corresponding data from the CMS are given in Fig. 9 and 10. Fig. 9 shows that the number of collisions resulting in an electron or positron (left) and something undetectable (probably neutrino or antineutrino), or muon and antimuon (right), is correctly predicted. Prediction is made by combining the Standard Model (equations predicting the behavior of known elementary particles) and the structure of the proton. Large data peaks are caused by the appearance of particles W and Z. The theory perfectly coincides with the data.
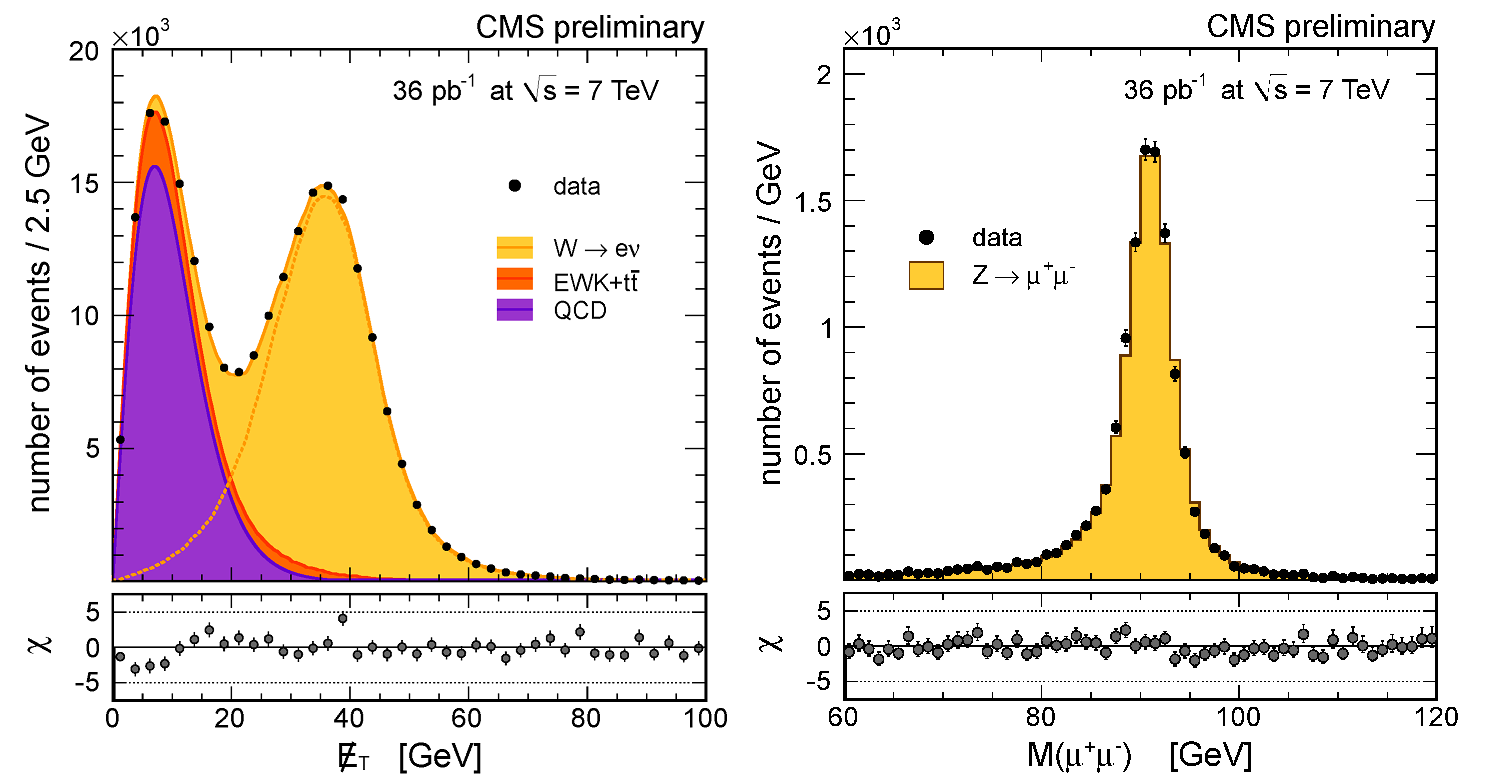
Fig. 9: black dots - data, yellow - predictions. The number of events is indicated in thousands. Left: the central peak appears due to neutrinos in the W particles. On the right, the lepton and antilepton that appear in the collision are combined, and the mass of the particle from which they came is implied. The peak appears due to the resulting Z particles.
More details can be seen in fig. 10, where it is shown that the theory by the number of not only specified, but many related measurements, most of which are associated with collisions of quarks with antiquarks, perfectly coincides with the data. The data (red dots) and theory (blue lines) never coincide exactly due to statistical fluctuations, for the same reason that you, having thrown a coin ten times, will not necessarily receive five “eagles” and five “tails”. Therefore, data points are located within the “error bar” of the vertical red bar. The size of the strip is such that for 30% of measurements, the error band should border on theory, and only for 5% of measurements, it should be separated from theory into two bands. It is seen that all the evidence confirms that the proton contains many antiquarks. And we correctly understand the number of antiquarks that carry a certain amount of proton energy.
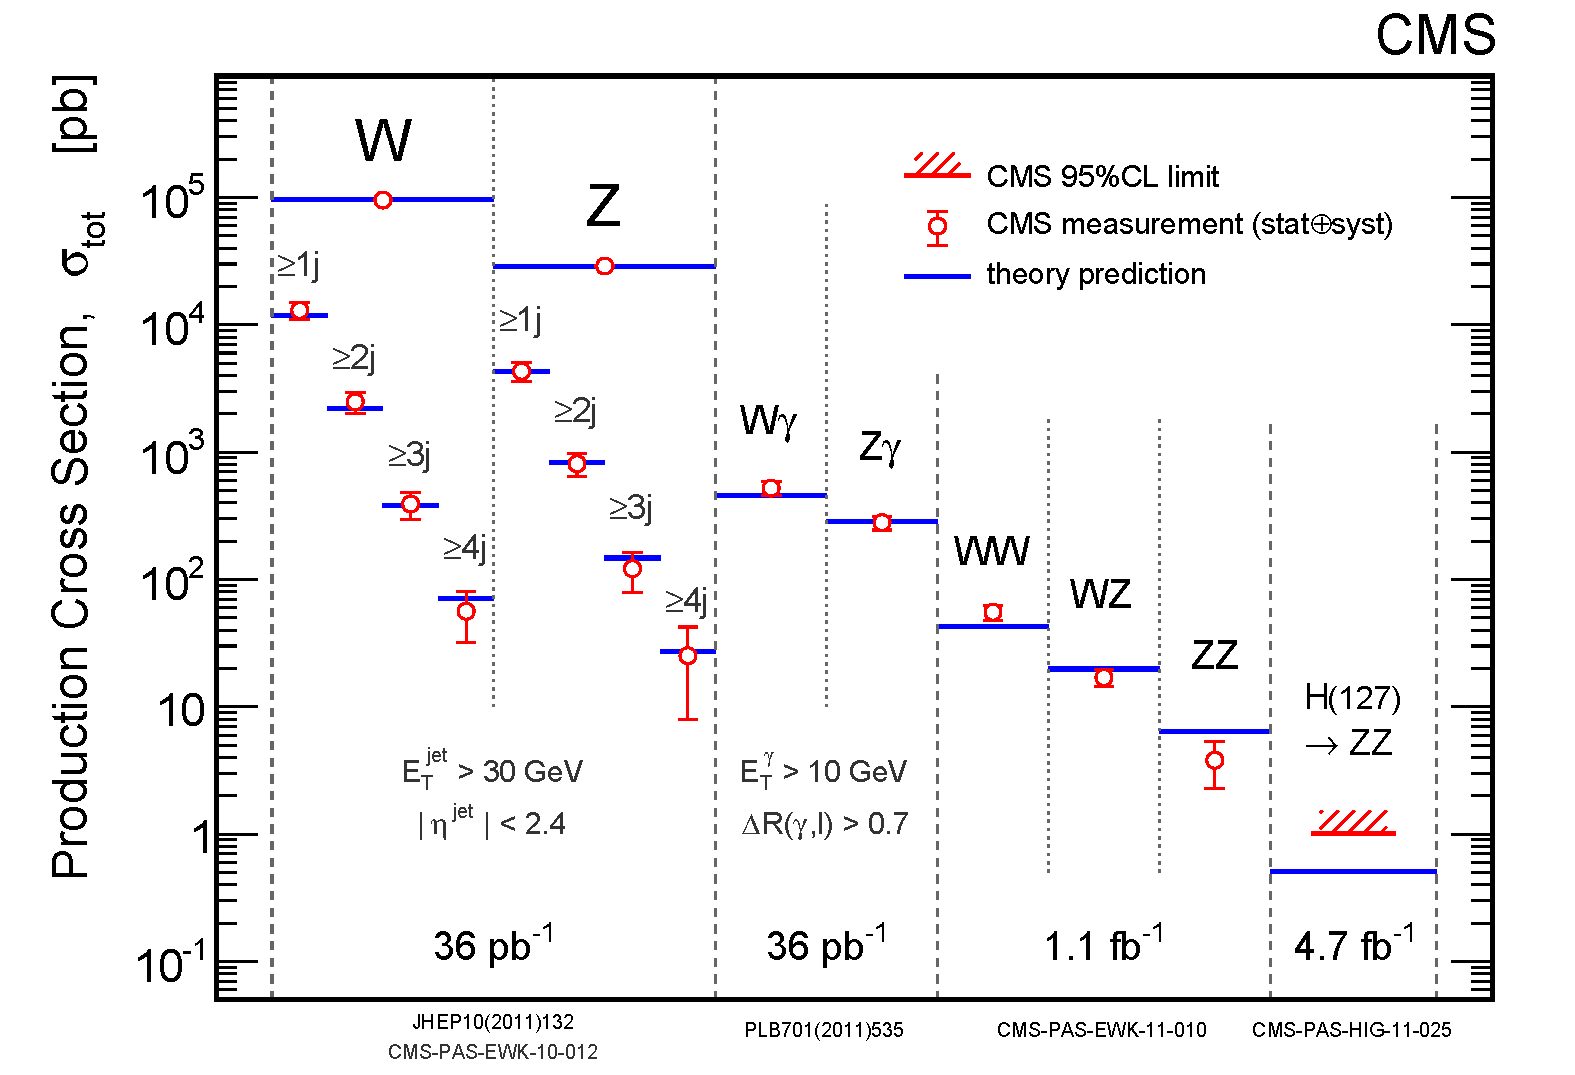
Fig. ten
Then everything is a little more complicated. We even know how many upper and lower quarks we have depending on the energy transferred by them, since we correctly predict - with an error less than 10% - how much W + particles are obtained more than W - particles (Fig. 11).
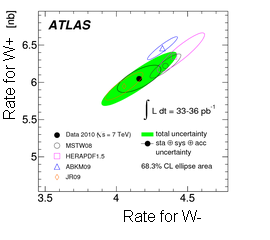
Fig. eleven
The ratio of the upper antiquarks to the lower should be close to 1, but the upper quarks should be greater than the lower, especially at high energies. In fig. 6 it can be seen that the ratio of the resulting particles W + and W - should approximately give us the ratio of the top quarks and the bottom quarks involved in the production of the particles W. But in Fig. 11 that the measured ratio of W + to W particles is 3 to 2, not 2 to 1. This also shows that the naive idea of a proton as consisting of two upper quarks and one lower quark is too simplified. The simplified 2 to 1 ratio is blurred, since the proton contains many quark-antiquark pairs, of which the upper and lower pairs are approximately equal. The degree of blurring is determined by the mass of the particle W at 80 GeV. If you make it easier, there will be more blur, and if it is heavier, it will be less, since most of the quark-antiquark pairs in the proton carry little energy.
Finally, let's confirm the fact that most of the particles in the proton are gluons.
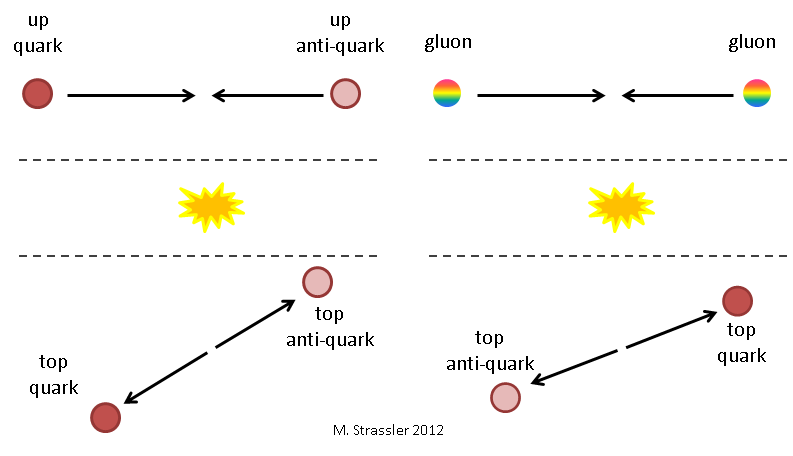
Fig. 12
To do this, we will use the fact that the upper quarks can be created in two ways: quark + antiquark -> upper quark + upper antiquark, or gluon + gluon -> upper quark + upper antiquark (Fig. 12). We know the number of quarks and antiquarks, depending on the energy transferred by them, based on the measurements illustrated in fig. 9-11. Based on this, the Standard Model equations can be used to predict how many upper quarks will come out of collisions of only quarks and antiquarks. We also believe, on the basis of previous data, that there are more gluons in the proton, therefore the process gluon + gluon -> upper quark + upper antiquark should occur no less than 5 times more often. It is easy to check if there are gluons there; if not, the data should be well below theoretical predictions.
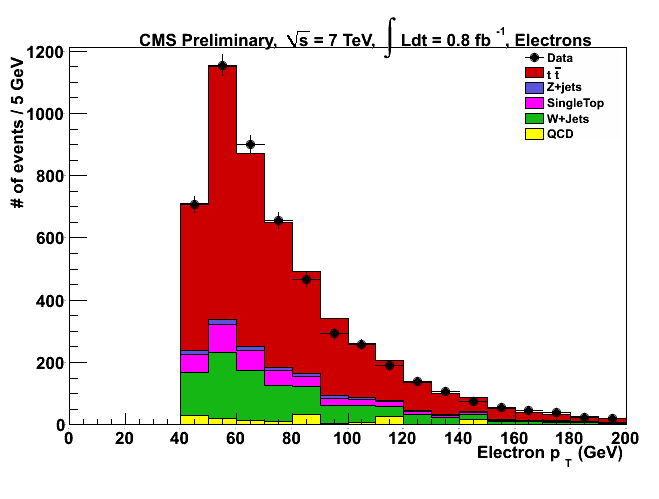
Fig. 13: the data (black dots) correspond to theoretical predictions (red columns). Obtained from measuring the electron energy in collisions.
It turns out that the data quite well coincide with theoretical expectations. Therefore, we can confirm that, in fact, most of the particles in the proton are gluons that carry a small fraction of the proton energy.
All Articles