How scientists move around the world
Recently there was an article in Science magazine entitled “A Huge Resume Archive Revealed by Most Traveling Scientists” ( “Vast set of public CVs reveals the world's most migratory scientists” ) - where, based on public data from the orcid system, statistics of scientists moving from country to country were shown. All the data used for the article was also posted on the open access, and I decided to see where the scientists from Russia are going in general, and from my own Physics Institute in particular.
Introduction
The orcid system (Open Researcher and Contributor ID) is an NGO responsible for a voluntary-compulsory system to help identify authors of scientific publications, created in 2012. The idea is that scientists participating in the publication of scientific articles can independently create an account that will uniquely identify them and allow them to correctly identify people when calculating various metrics (for example, the Hirsch index).
Interestingly, all the source data is open, orcid laid out in the free access of the full archive of all summaries available for public access in json format. And with all the history of change. Ie, for example, the conditional Ivan Ivanovich Ivanov indicated in the system that he graduated from MIT in 2000, then was a graduate student at Stanford, and then put the place of work for the Moscow Tin-Casting University, then the system basically eats and remembers. Ie, in principle, no one bothers at the moment to create fake accounts, but many scientific journals have already begun to require ORCID to publish articles, so there is an assumption that most of the accounts in the system are created with good intentions.
At the time of publication of the article in Science, in the open orcid database there was information about resumes of approximately 3 million scientists worldwide. The authors of the article in Science write that different countries are more fully represented (when compared to Unesco statistics on the number of scientists) and there is a noticeable bias towards scientists who have recently completed graduate school.
Despite all of the above, this is the most comprehensive publicly accessible database of scientists and their movements. In the original article, the authors simply divided the whole world into 8 regions (EU except Great Britain, United Kingdom, States, Asia, America except the USA, Australia and Oceania, Europe except the EU and Africa) and calculated statistics about how many scientists changed their place of residence. after graduating from graduate school and where they then went. You can see where scientists who have graduated from Russian universities now live, including. But, since all the initial data is publicly available, those who are interested can independently satisfy their curiosity, which I did.
Import data
I decided to import the database after preprocessing from json to .csv in SQLite for ease of writing queries: I downloaded the ORCID_migrations_2016_12_16.csv file (1988114 records, 224mb):
CREATE TABLE migration(dummy,orcid_id,country,organization_name,Ringgold_id,start_year,end_year,affiliation_type,affiliation_role,is_phd); .import ORCID_migrations_2016_12_16.csv migration
In this table, each row corresponds to a single place of work or study of a person. I also made a separate table of all individuals with information about which country and year they last studied, and another one with information about where they are now:
create table person_last_education(orcid_id,country,graduated,is_phd); insert into person_last_education(orcid_id,country,graduated,is_phd) select p.orcid_id, m.country, m.end_year, m.is_phd from person as p, migration as m where m.orcid_id=p.orcid_id and m.affiliation_type='EDUCATION' ; create table person_last_location(orcid_id,country); # selecting orcid insert into person_last_location(orcid_id,country) select p.orcid_id, (select m.country from migration as m where m.orcid_id=p.orcid_id order by end_year desc limit 1) from person as p;
It turned out that the database has data on 1096745 graduates worldwide, of which 321083 received a PhD.
We process data
We consider the statistics for the ten most represented countries and draw a diagram with the help of ggplot.
library(DBI) migration <- dbConnect(RSQLite::SQLite(), "orcid_2016.sqlite3") by_country<-dbGetQuery(migration, 'select country,count(*) from person_last_education group by 1 order by 2 desc limit 10') ggplot(by_country,aes(x=country,y=`count(*)`))+geom_col() by_country_phd<-dbGetQuery(migration, 'select country,count(*) from person_last_education where is_phd=1 group by 1 order by 2 desc limit 10') ggplot(by_country_phd,aes(x=country,y=`count(*)`))+geom_col()


Surprise, Russia is in the 10th place in the world in the number of registered graduates, although it didn’t hit the top 10 graduates with a PhD.
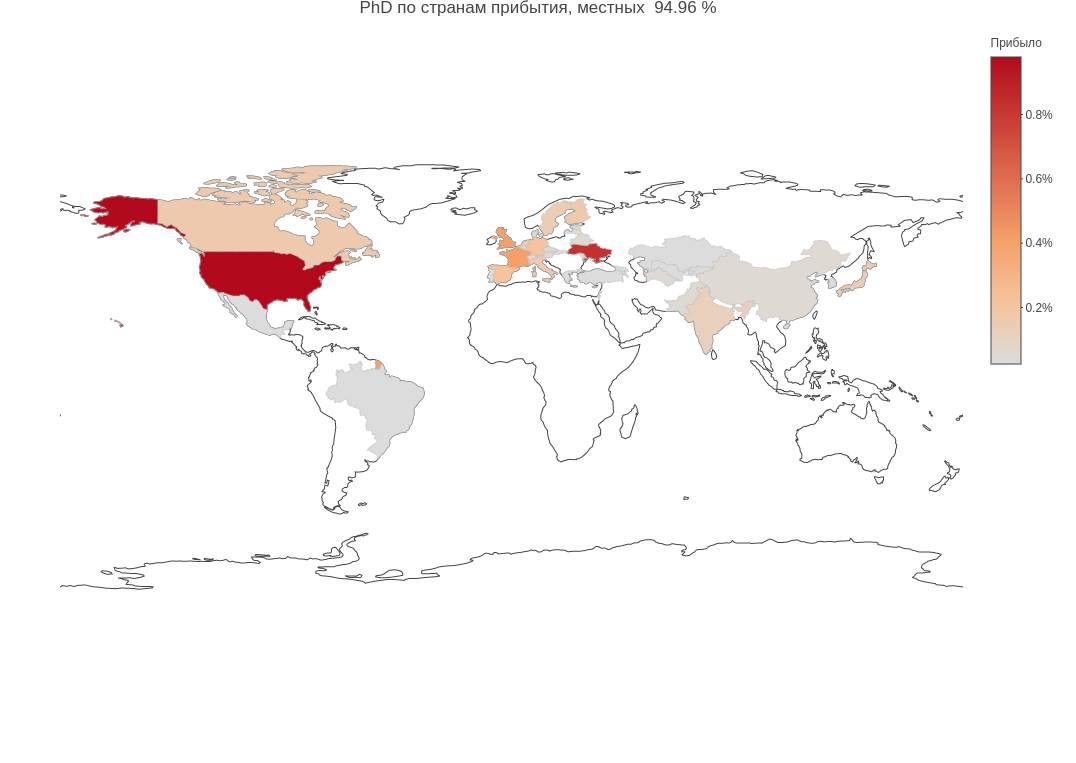
Now we look, where Russian scientists now inhabit, and for clarity, we will show them on the world map, normalizing them to the total number of graduates. For a more convenient demonstration, we use plotly , this package makes it easy to create interactive graphs, it can be used locally or with your server for free, but it also provides a service for hosting, a small number of graphs can be laid out for free.
How to make
create table person_last_location(orcid_id,country); # selecting orcid insert into person_last_location(orcid_id,country) select p.orcid_id, (select m.country from migration as m where m.orcid_id=p.orcid_id order by end_year desc limit 1) from person as p;
destination_by_country<-dbGetQuery(migration, "select l.country as destination, count(*) as count from person_last_education as o left join person_last_location as l on l.orcid_id=o.orcid_id where o.country='RU' and o.is_phd=1 group by 1") total_from_ru <- destination_by_country %>% summarize(n=sum(count)) fraction_remained <- destination_by_country %>% filter(destination=='RU') %>% mutate(frac=100*count/total_from_ru$n) destination_by_country_n <- destination_by_country %>% filter(destination!='RU') %>% mutate(frac=100*count/total_from_ru$n) p <- plot_geo(destination_by_country_n) %>% add_trace( z = ~frac, color = ~frac, colorscale = 'Bluered', text = ~COUNTRY, locations = ~destination3c, marker = list(line = list(color = toRGB("grey"), width = 0.5)) ) %>% colorbar(title = '', ticksuffix = '%') %>% layout( title = paste('PhD , ',fraction_remained$frac,'%'), geo = list( showframe = FALSE, showcoastlines = FALSE, projection = list(type = 'Mercator') ) ) api_create(p, filename = "phds_from_russia")

Similarly, you can see where scientists come to Russia.
 Interactive plotting plotly
There is some imbalance, out of those who have received a candidate degree (PhD) in Russia, 83% are left, but of all Russian scientists, 95% have received a degree in Russia. Ie left more than arrived. Let's see, how is the situation around the world with this balance?
left_country<-dbGetQuery(migration, "select o.country as country,count(distinct o.orcid_id) as departed from person_last_education as o left join person_last_location as l on l.orcid_id=o.orcid_id where o.country!=l.country and o.is_phd=1 group by 1") arrived_to_country<-dbGetQuery(migration, "select l.country as country, count(distinct l.orcid_id) as arrived from person_last_education as o left join person_last_location as l on l.orcid_id=o.orcid_id where o.country!=l.country and o.is_phd=1 group by 1") by_country<-dbGetQuery(migration, 'select l.country as country, count(distinct l.orcid_id) as total from person_last_education as o left join person_last_location as l on l.orcid_id=o.orcid_id where o.is_phd=1 group by 1') balance_by_country <- by_country %>% left_join(left_country,by='country') %>% left_join(arrived_to_country,by='country') %>% mutate(arrived=ifelse(is.na(arrived),0,arrived),departed=ifelse(is.na(departed),0,departed)) %>% mutate(balance=round(100*(arrived-departed)/total,2)) %>% filter(total>10) %>% mutate(country3c=to_iso3c(country),country.ru=decode_ru(country)) p <- plot_geo(balance_by_country) %>% add_trace( z = ~balance, color = ~balance, colorscale = 'Bluered', text = ~country.ru, locations = ~country3c, marker = list(line = list(color = toRGB("grey"), width = 0.5)) ) %>% colorbar(title = '', ticksuffix = '%',limits=c(-100,100)) %>% layout( title = 'PhD (-)/', geo = list( showframe = FALSE, showcoastlines = TRUE, projection = list(type = 'Mercator') ) ) api_create(p, filename = "phds_balance")
I decided to show only countries where the total number of people with a PhD is more than 10, most likely there just people are not actively using the ORCID system.

It seems that in many developed countries, especially in European countries, people graduate from graduate school and leave to work somewhere in places that are not very well developed, probably there the competition with local graduates is not so strong and it is easier to get a position in the University.
Where did the PhD students go?
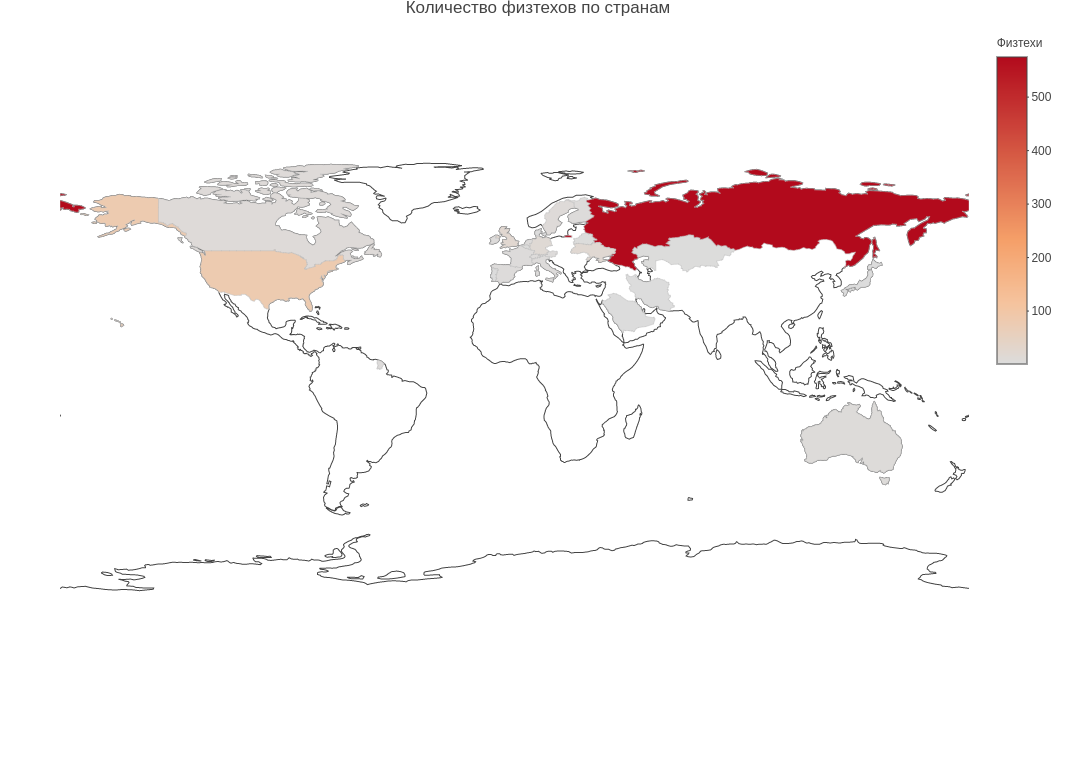
I had to tinker a bit with the graduates of the Physics and Technology Institute, because the name of the university was all indicated a little differently, I had to manually search the database for everything that looks like MIPT and make a matching table. And that's what happened:
 Interactive plotting plotly
It seems that most of the Physical Techniques are encrypted (like me) and do not post their resume in orcid. Will wait...
Excuse
All statistics are based on the data that people have entered into the ORCID database and made available for public access. Therefore, it makes no sense to say something like, “well, it's all bullshit - I personally know the Physical College living in Mexico or Brazil,” he probably just did not do a public summary on orcid.
All scripts are placed on github, see https://github.com/vfonov/sci_migration/blob/master/stats_db.R
All Articles