Inspect everyone who enters the subway
Hi, Geektimes! In this article I want to talk about modern microwave personal inspection systems, as well as the results of the project we are running, which is developing a new promising microwave inspection system based on the combined use of radar and machine vision. It is expected that the developed inspection system will be used on land transport with a large passenger traffic. This will be achieved due to superior technical characteristics: extremely high throughput, inspection capabilities in tight outer clothing, significantly smaller weight and size characteristics, cost and energy consumption. The article provides a description of the installation created in the project and the methodology of the experiment for the simulation modeling of the described microwave inspection system, as well as the result of the experiment with a dummy with objects hidden under the clothes.
To understand the difference between the developed personal inspection microwave system and the systems existing in the market, and how the existing limitations of microwave inspection systems that prevent their widespread use (such as frame metal detectors) can be overcome, it is necessary to consider the state of affairs.
To obtain radar images of objects hidden under clothes in all microwave inspection systems, aperture synthesis is used, in which the mechanical movement of the antennas, or their electronic switching, makes it possible to form an antenna with a larger equivalent aperture. By using a synthesized aperture, a high spatial resolution is obtained, which is determined by the wavelength, the band of the probing signal, and the size of the aperture itself. The principal parameter limiting the spatial resolution of radar images is the wavelength of the radiation, since it is impossible to achieve a spatial resolution of less than the wavelength in a sensing geometry that is practically suitable for human inspection.
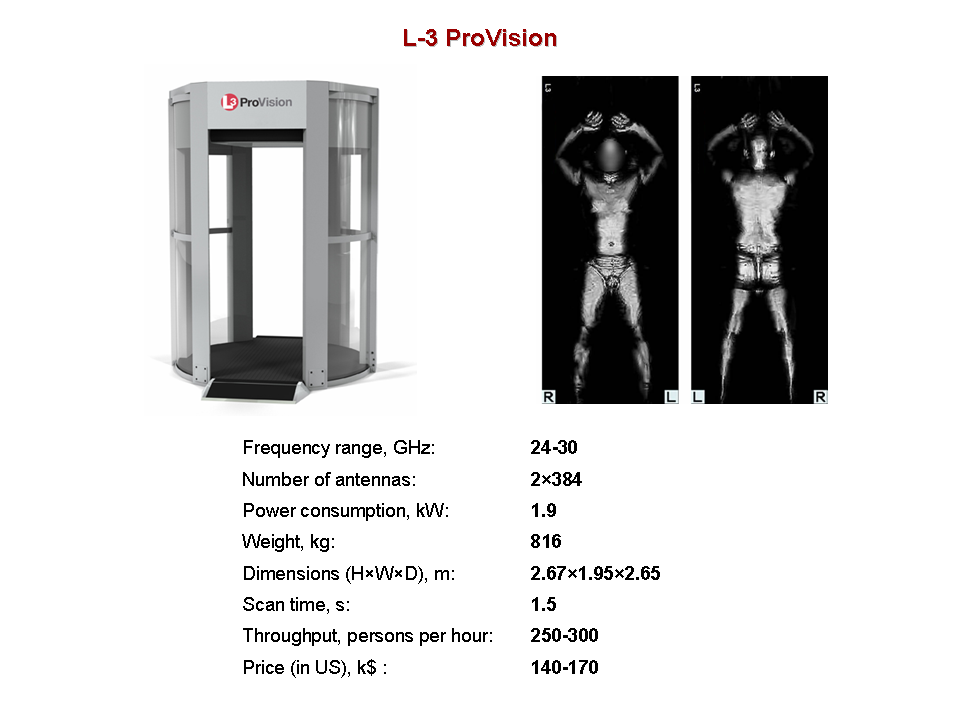
In modern inspection systems, the synthesized aperture is formed in two ways: by mechanical movement of antennas and electronic switching, or only by electronic switching. In the most well-known and widespread system L-3 ProVision , through which many readers passed, mechanical scanning using two linear vertical antenna arrays is used. In the vertical direction, the synthesized aperture is obtained by electronically switching antennas, and in the horizontal direction by mechanical displacement [1].
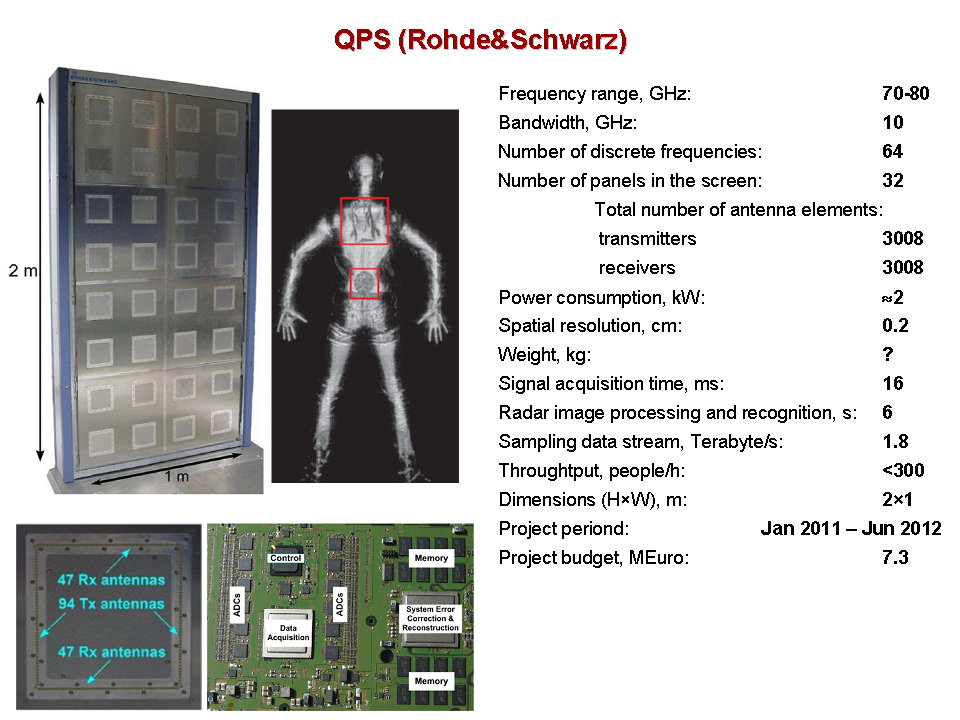
Later systems, such as Eqo from Smiths Detection [2] and QPS from Rohde & Schwarz [3], do not use mechanical movement for aperture formation. Instead, there is a rapid switching of antennas or antenna elements located on a flat panel, which makes it possible to obtain a radar image of the panel being scanned in real time. Despite the fast electronic switching of antennas in the last two systems, their performance remains at the level of the L-3 ProVision mechanical scanning system, since the inspected person must take off outerwear, walk to the inspection area, take a stationary pose for the scan time (QPS), or turn, standing still, to receive radar images from all sides (Eqo).
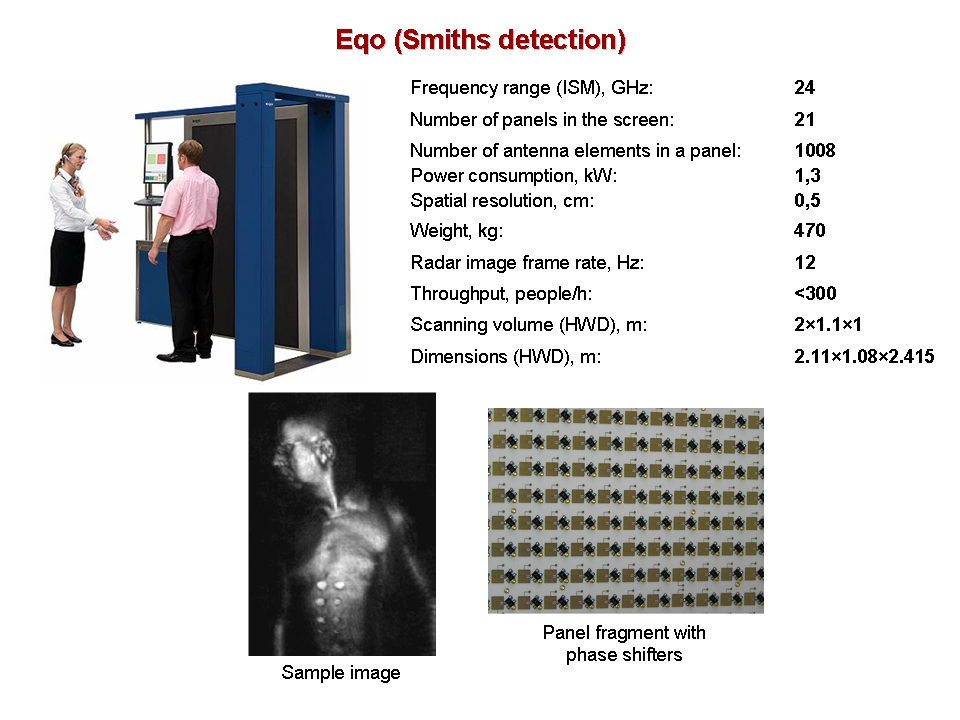
In electronic inspection systems, the microwave part is much more complicated than in systems using mechanical scanning, since an increased number of antennas need to be switched. Due to the greater number of channels in the system, a huge data flow is generated (note this parameter in the QPS system), which is processed in real time by a high-performance computer that consumes most of the energy consumed. The only advantage of screening systems in the screen form factor is that they are smaller than the portal version of the L-3 ProVision.
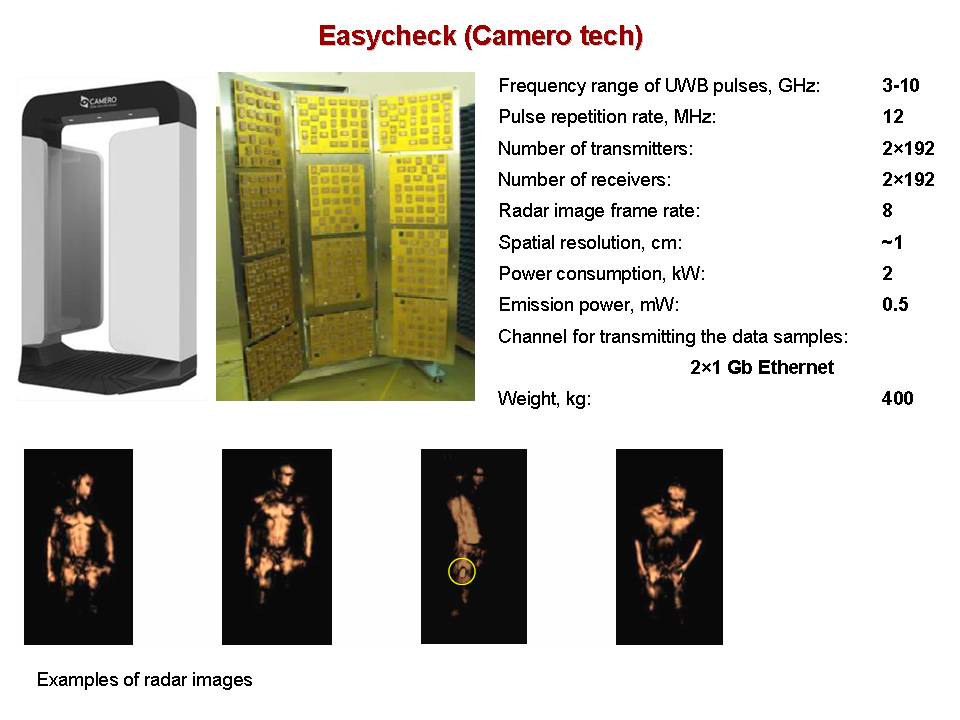
Based on the traditional approach to the synthesis of aperture, the bandwidth of microwave inspection systems can be increased by surrounding the person being inspected with a plurality of panels with antennas for obtaining a simultaneous view from different angles. This approach was implemented in the easyCheck inspection system developed by Camero [4]. This system has a portal design in the form of panels with antennas located around the person being inspected. Multi-angle radar images of a person passing through the portal are obtained with a frequency of 8 Hz, which allows to detect objects that are dangerous under the clothes.
At present, all screening systems on the market automatically recognize dangerous objects and report the result of recognition in the form of pictograms, without presenting radar images to the operator, thereby preserving the privacy of the people being inspected.
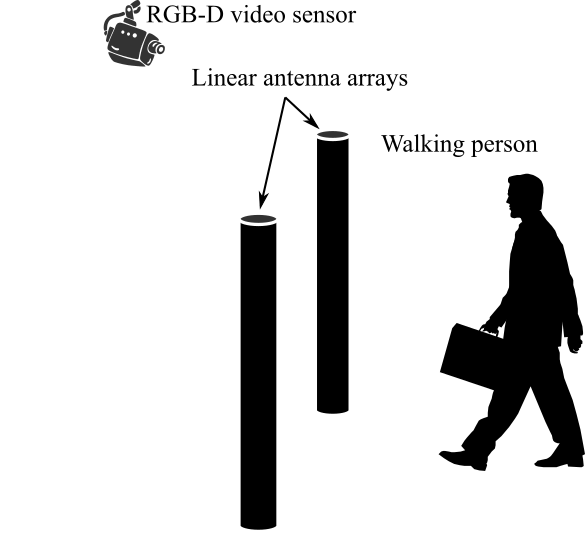
In the screening system we are developing, the natural movement of a person between fixed vertical linear antenna arrays will be used to form a synthesized aperture, which allows surpassing analogues by the following characteristics: throughput, mass, dimensions, cost, and power consumption. The coherent processing of the radar signal in such a system is carried out using an RGB-D video sensor or lidar, which synchronously with the radar system registers the movement of the person being inspected in space. The depth map recorded by the video sensor serves to extract the trajectory of parts of the human body for subsequent compensation associated with the movement of phase raids in the radar signal. The synthesized aperture, formed by the movement of the target itself past a stationary antenna or antenna system, is called an inverse synthesized aperture.
A microwave screening system using the principle of inverse aperture synthesis should have the superior characteristics listed above for the following reasons:
The operability of the described microwave inspection system was investigated using the experimental setup [5, 6] created for these purposes, the photo of which is shown in the following figure.
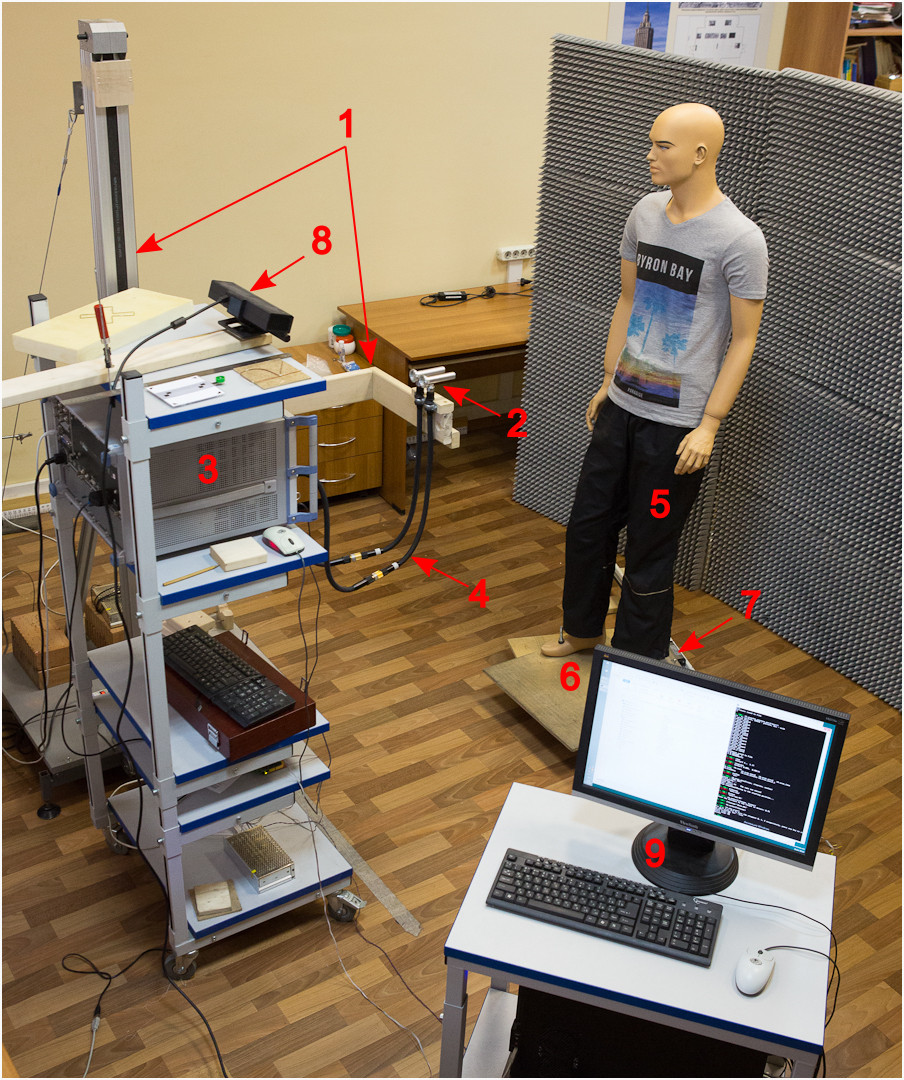
The installation consists of a linear displacement module (1) receiving and transmitting antennas (2), a vector network analyzer (3), flexible antenna feeders (4), a human dummy (5), a trolley for moving the dummy (6), a linear displacement module of the dummy ( 7), RGB-D video sensor (8) and personal computer (9). The receiving and transmitting antennas (2) are connected to the vector network analyzer by means of flexible feeders (4). Data acquisition occurs using the doll multiplication method. Independent movement of the receiving and transmitting antennas (if two modules are used) along parallel lines allows simulating the behavior of linear monostatic and multi-static (MIMO) antenna arrays. At the same time, the positions of the antennas in which the radar signal is sampled are set programmatically, thanks to which the characteristics of any linear antenna array can be investigated with the help of the installation. The human dummy (5), the direction of movement of which can be set by orienting the linear displacement module (7) placed on the floor, moves incrementally at programmable intervals. After setting the parameters of the experiment: sampling intervals of the radar signal, the dummy moving interval, the frequency range of the probing signal, the number of discrete frequencies, the experiment runs automatically. In the course of the experiment, for each position of the dummy, a map of the depth of the sensing scene and the sampling of the radar signal at the given antenna positions is recorded. The resulting data is processed together to obtain radar images. To obtain similar real-time data from a moving person, an electronically-switched linear antenna array is required. A key feature of the screening system being developed is the use of an RGB-D video sensor (in the experimental setup we used Microsoft Kinect v2) or a similar device, which allows obtaining a detailed radar image using a significantly smaller amount of radar data.
Examples of the initial data recorded during the experiments are shown in the following figures.
The infrared images and depth maps of the sensing scene shown above, with the sequence numbers 1, 101, 201, were obtained during the experiment, in which the dummy was moved to a distance of 1 m with stops every 0.5 cm, resulting in 201 frames. The radar signal (radio hologram) at a frequency of 15.55 GHz is presented in the form of half-tone images. The first column on the left of the radio hologram corresponds to samples of the radar signal with a step of 0.5 cm, obtained as a result of a mechanical scan for the sounding scene with the sequence number 1. The last column of the radio hologram corresponds to the samples of the radar signal for the sounding scene with the serial number 201. Intermediate columns of the radio hologram correspond to the scenes with intermediate ordinal numbers. In total, the radio hologram has 201 columns, according to the number of static scenes, and 201 lines, according to the number of samples of the radar signal over an interval of 1 meter in length with 0.5 cm sampling steps. To register a similar radio hologram in real time, a 1 meter long mono-static antenna array would be required, consisting of 201 antennas located at a distance of 0.5 cm from each other. For a multi-frequency signal consisting of N frequencies, it is obtained, respectively, N radio holograms.
Before processing the received data, it is required to calibrate the optical system of the photosensor, as well as to jointly calibrate the radar and optical systems of the installation. The calibration of the Microsoft Kinect v2 optical system and the range channel was discussed here . Calibration of the radar system was carried out in two stages. At the first stage, the position of the antenna displaced by the linear displacement module in the coordinate system associated with the video sensor was determined. The second stage consisted in measuring the frequency-dependent probing signal of the position of the phase center of the antenna, which is necessary for processing the broadband signal. The position of the center of the open end of a circular waveguide, used as an antenna, was entered into the coordinate system of the image sensor using a graphic marker attached to the end of the antenna, as shown in the following figure.
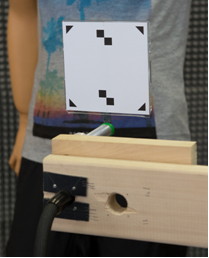
The position of the marker was recorded for the two extreme positions on the scan line. The remaining antenna positions were calculated using interpolation. Stepper motors and the optical system of the image sensor provided the positioning error of the signal samples, which did not significantly affect the resolution of the radar image.
When using a broad band of the probing signal, the position of the phase center of the antenna at different frequencies may be different. Under the phase center of the antenna understand the imaginary center, which can be taken for the center of the spherical wave emitted by the antenna. In a spherical wave, the surfaces of equal phase are spheres. The antenna was calibrated at a scatterer small compared to the radiation wavelength and consisted in finding a correction factor for the signal detected by the antenna, which allows one to obtain the theoretically expected dependence of the signal phase. The effect of antenna calibration is illustrated in the following figure, which shows the result of reconstructing a radar image for a point diffuser, located 20 cm from the scan line, which coincides with the Y axis on the graph. Sounding and reconstruction of the radar image was carried out in the frequency range from 6 to 12 GHz.
The first image on the left in the figure above was obtained after calibrating the antenna feeders for the average position on the scan line using the reference loads (calibration set) for the vector network analyzer. It is seen that the displacement of the measurement planes to the ends of the feeders does not allow to get a focused radar image. The second image shows a radar image obtained after calibrating the antenna and correcting the source data. The third is a reference image obtained as a result of numerical simulation.
After calibrating the antenna system, you can process the data obtained in experiments with a dummy with a broadband probe signal. The processing of the radar signal consisted of the following steps: finding specific points on the halftone image of the dummy; generating a dense grid associated with specific points, each node of which is a moving focus point for a radar signal; finding the trajectory of special points from frame to frame; finding the trajectory of dense mesh nodes; integrating a focused radar signal for each node of the dense grid from frame to frame; visualization of the received data array in the form of a radar image.
The figure below illustrates the extraction of specific points and tracking them on a sequence of halftone images of a moving dummy. Each halftone image corresponds to a depth frame, which contains the necessary range attribute for each pixel of the halftone image.
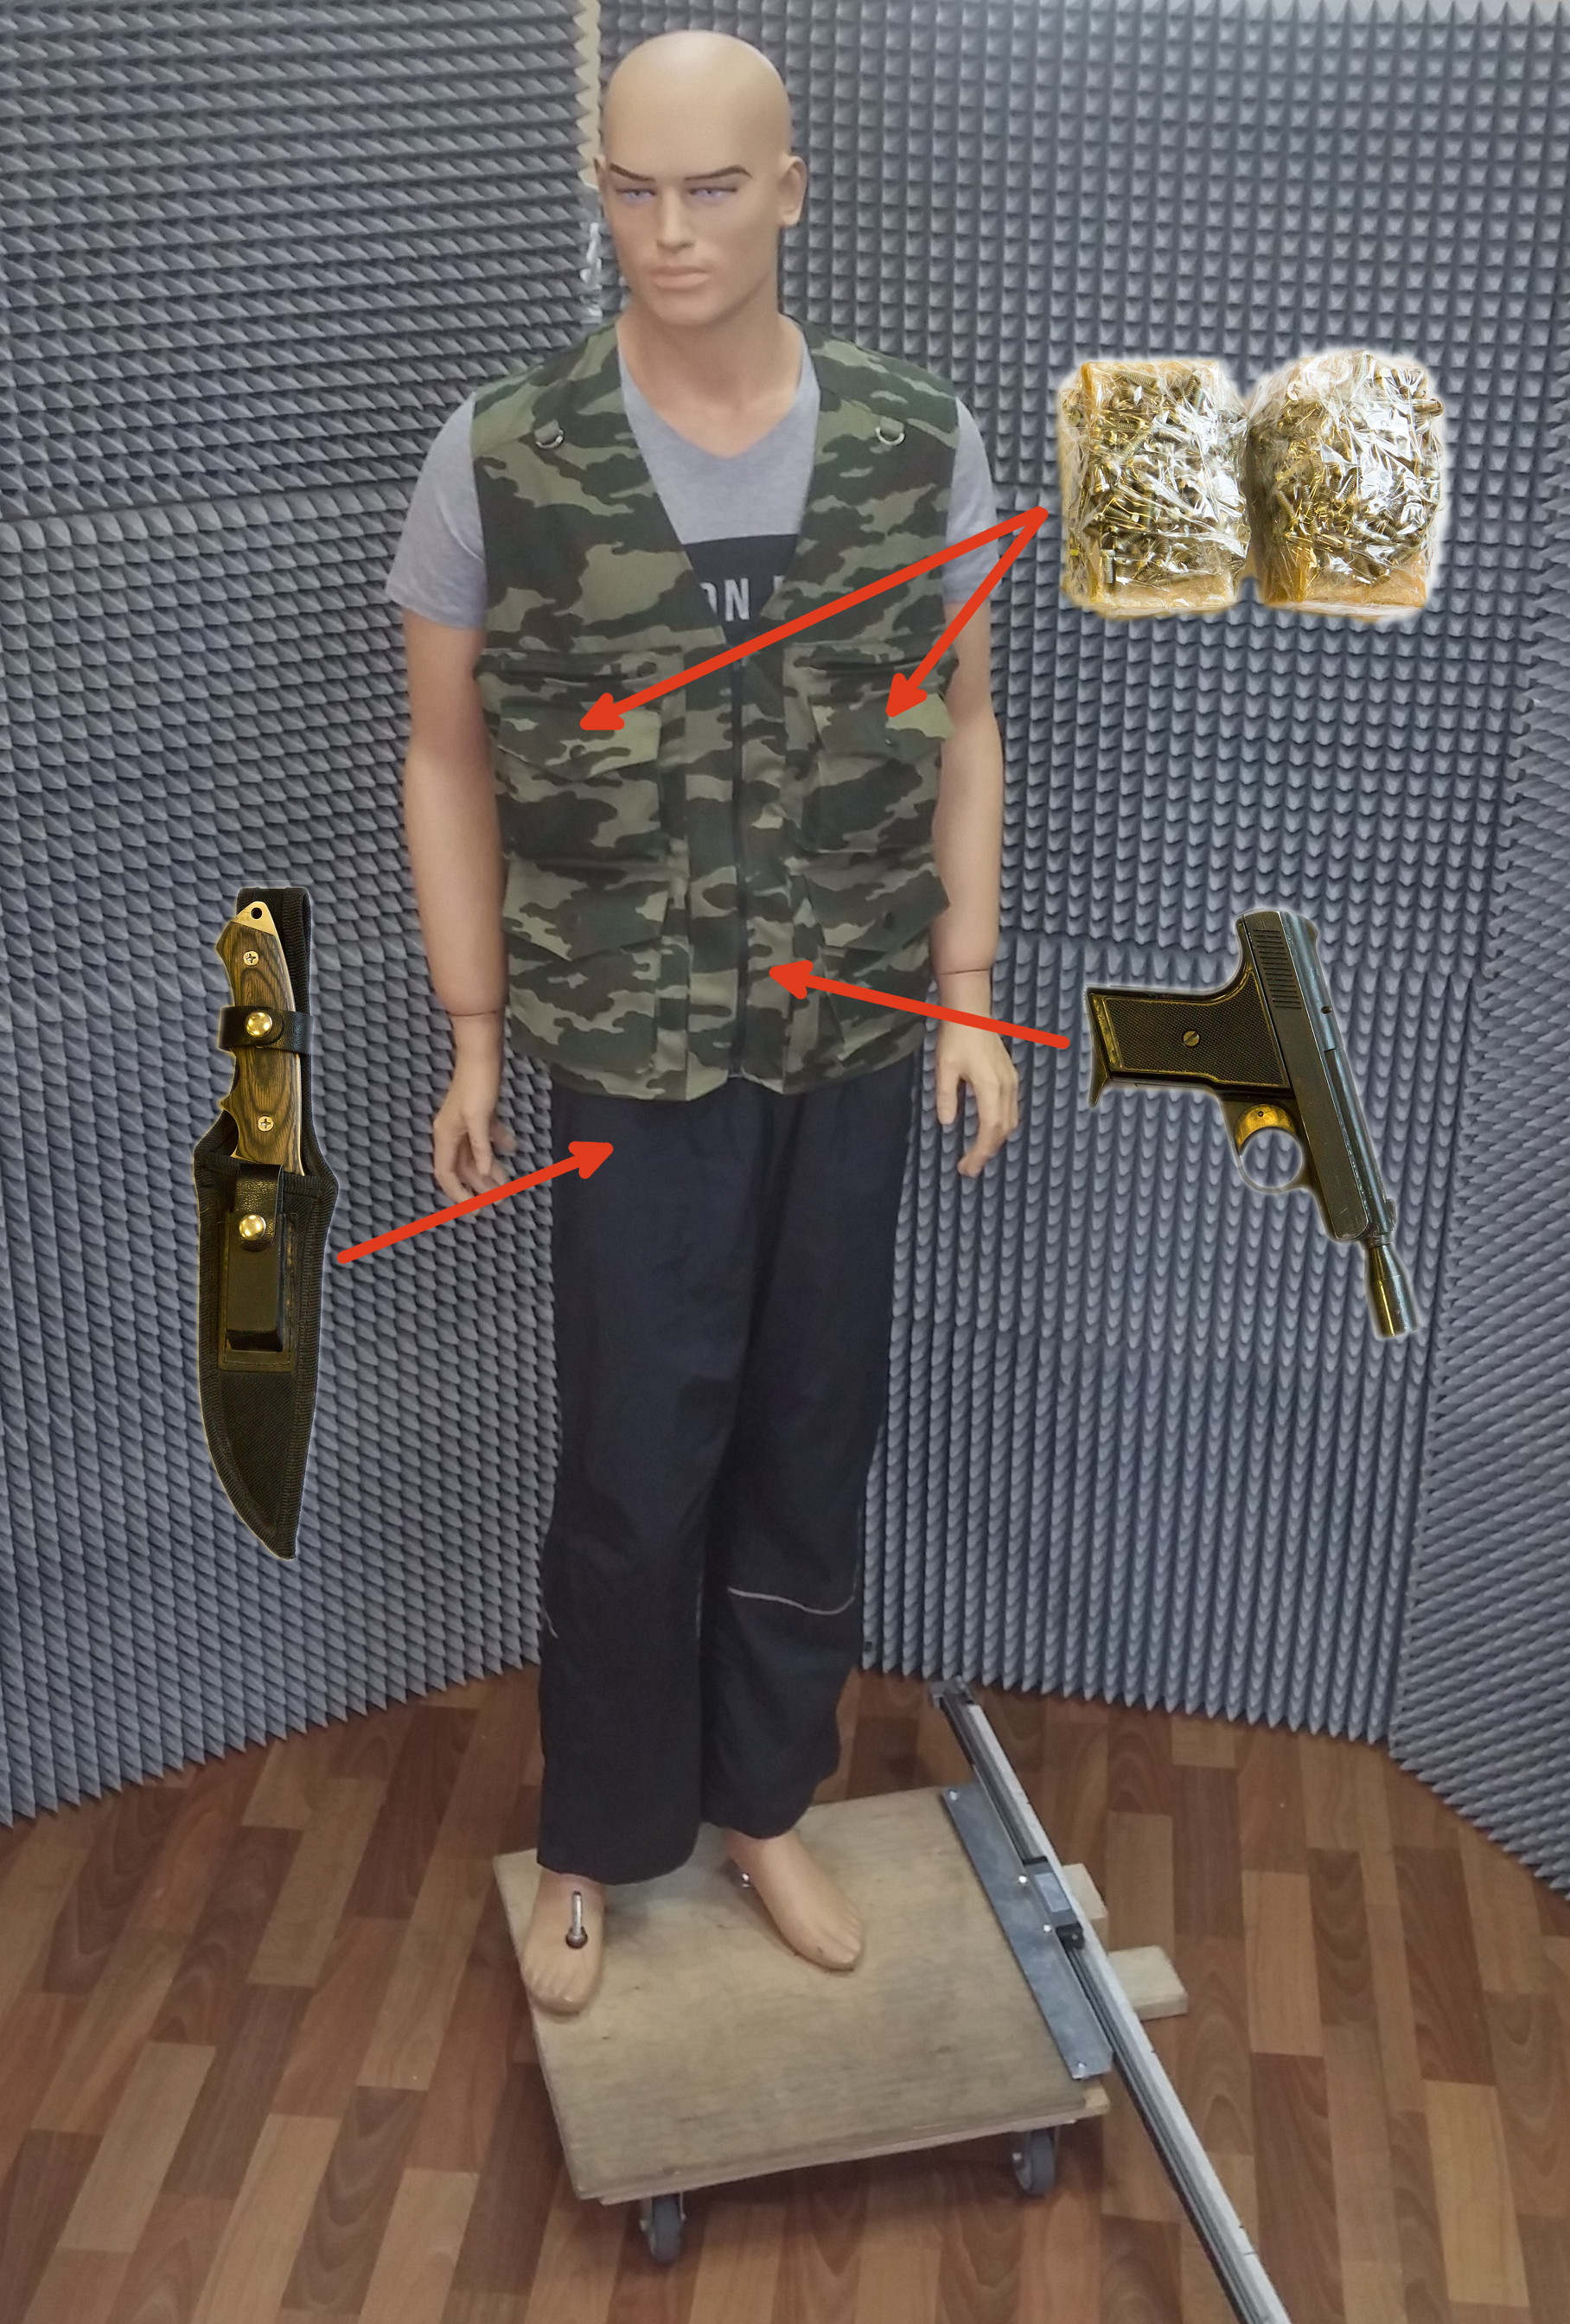
At the current stage of the project, simulation experiments were carried out with a dummy. The following figure shows a mannequin, under the clothes of which various objects that pose a threat were hidden: a knife in a case, a gas pistol in a cloth belt, and pieces of soap with bolts on the surface as a simulator of an improvised explosive device.
In the simulation experiment with the dummy shown in the figure, a signal was used with stepwise frequency switching in the range from 6 to 12 GHz with a frequency change step of 250 MHz, as a result of which the reflected signal was recorded at 25 frequencies. The dummy moved at intervals of 1 cm at a total distance of 100 cm using the linear displacement module. The line along which the antennas were scanned had a length of 100 cm with a sampling step of 1 cm. The total amount of radar data, therefore, was an array of complex numbers 101⨯101⨯25 in size. The distance to the dummy varied from 150 to 110 cm along the optical axis of the image sensor. The average distance from the dummy to the scanning line with antennas was 80 cm.
The following figure shows the resulting radar image obtained by focusing on a sequence of layers from the clothing surface to a depth of 2.5 cm and presenting the obtained data in the near-surface layer using the maximum value projection method.
As can be seen in the figure above, all hidden objects under clothing are distinguishable. The reflection from the knife can be taken as a reflection from the surface of the right thigh of the dummy. It is expected that the images of hidden objects on the body of a moving person will have a greater contrast than on the dummy, since for a person walking in steps, the orientation of body surface fragments constantly changes in space, and when the signal is accumulated, such areas on radar images will have a much lower brightness. Radar images obtained for the human body should also be less noisy compared to the radar images of the dummy, since the dummy translucent for radio waves creates a complex interference pattern of the field on its surface, resulting in artifacts on the resulting radar images.
The spatial resolution of a reduced radar image with objects hidden under clothes is limited by the wavelength of the signal being probed and is about 3 cm for the average frequency of the 9 GHz band used. The resolution of the radar images can be increased by increasing the radiation frequency, but this increases the absorption of waves in clothing due to which tight outerwear becomes opaque. Unlike microwave scanners used at airports, the provision of high-resolution radar images for ground transportation is not required. More important is the possibility of inspection in tight outer clothing.
A possible appearance of a microwave inspection system with an inverse synthetic aperture is presented in the following figure.
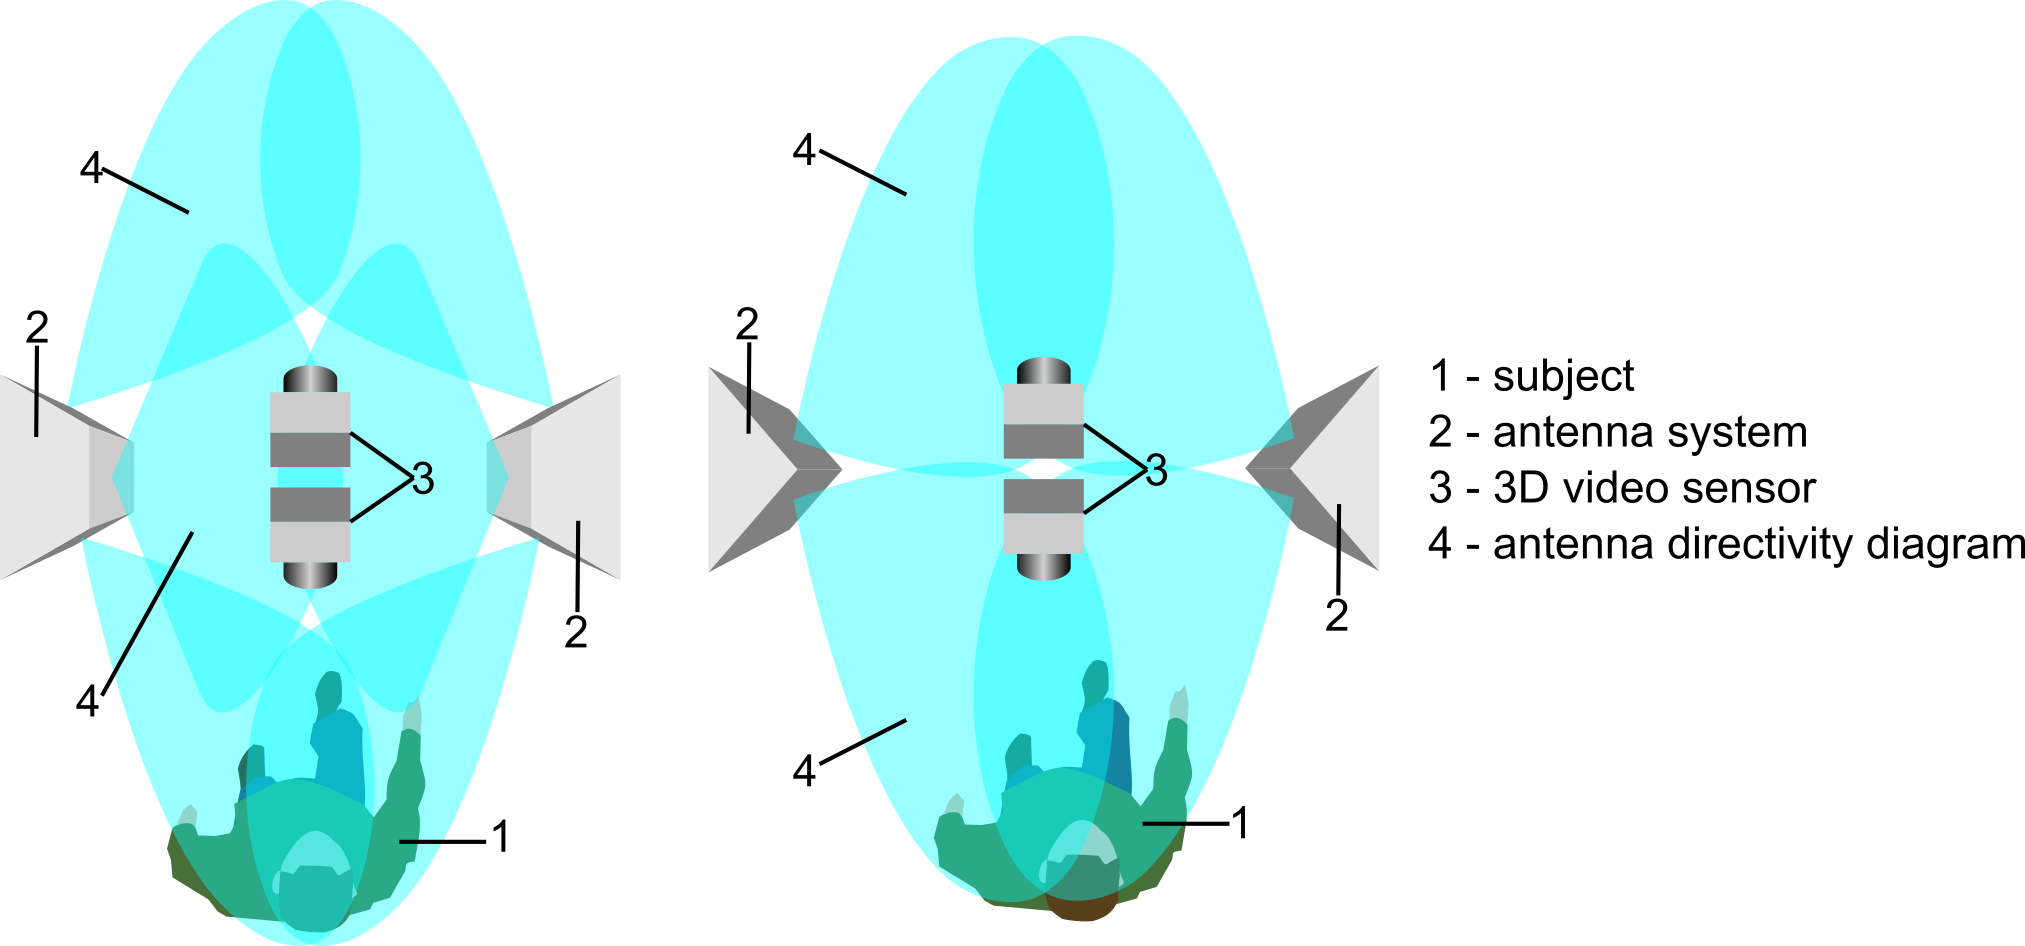
The figures show variants of the inspection system with a different number of linear antenna arrays, a sufficient number of which can be installed during simulation experiments on the described installation, without creating a complex radar system with a fixed number of antennas and their location. The number of antenna arrays should be sufficient to obtain radar images for the entire surface of the inspected person.
The next step in the creation of an inspection system will be the development of high-speed linear antenna arrays for real-time data collection in order to conduct experiments on a moving person. Instead of a vector network analyzer, one or more frequency-tunable microwave oscillators and a quadrature receiver will be used.
A microwave screening system with inversely synthesized apertures can change the approach to ensuring safety in ground transportation, just as microwave scanners have impacted the safety of air transport. The appearance on the market of accessible devices for three-dimensional video capturing of the observed scene makes it possible to implement a comprehensive system for inspecting structured passenger traffic, which would allow, without any inconvenience, to automatically inspect passengers in outerwear in motion using safe microwave radiation.
As mentioned above, simulation experiments with the installation will produce the puppet animation technique. Applying it to the radar data, you can get a “radar animation film”, in which each of the following radar images is obtained by integrating the newly received data with the previous radar image, resulting in increased resolution. Looking at the animation, you can see that a detailed radar image can be obtained when the dummy has traveled a sufficient distance, forming a synthesized aperture of sufficient length that is in full compliance with the provisions of the classical radar.
This work was supported by the grant of the Russian Science Foundation No. 15-19-30012.
To understand the difference between the developed personal inspection microwave system and the systems existing in the market, and how the existing limitations of microwave inspection systems that prevent their widespread use (such as frame metal detectors) can be overcome, it is necessary to consider the state of affairs.
To obtain radar images of objects hidden under clothes in all microwave inspection systems, aperture synthesis is used, in which the mechanical movement of the antennas, or their electronic switching, makes it possible to form an antenna with a larger equivalent aperture. By using a synthesized aperture, a high spatial resolution is obtained, which is determined by the wavelength, the band of the probing signal, and the size of the aperture itself. The principal parameter limiting the spatial resolution of radar images is the wavelength of the radiation, since it is impossible to achieve a spatial resolution of less than the wavelength in a sensing geometry that is practically suitable for human inspection.
In modern inspection systems, the synthesized aperture is formed in two ways: by mechanical movement of antennas and electronic switching, or only by electronic switching. In the most well-known and widespread system L-3 ProVision , through which many readers passed, mechanical scanning using two linear vertical antenna arrays is used. In the vertical direction, the synthesized aperture is obtained by electronically switching antennas, and in the horizontal direction by mechanical displacement [1].
Later systems, such as Eqo from Smiths Detection [2] and QPS from Rohde & Schwarz [3], do not use mechanical movement for aperture formation. Instead, there is a rapid switching of antennas or antenna elements located on a flat panel, which makes it possible to obtain a radar image of the panel being scanned in real time. Despite the fast electronic switching of antennas in the last two systems, their performance remains at the level of the L-3 ProVision mechanical scanning system, since the inspected person must take off outerwear, walk to the inspection area, take a stationary pose for the scan time (QPS), or turn, standing still, to receive radar images from all sides (Eqo).
In electronic inspection systems, the microwave part is much more complicated than in systems using mechanical scanning, since an increased number of antennas need to be switched. Due to the greater number of channels in the system, a huge data flow is generated (note this parameter in the QPS system), which is processed in real time by a high-performance computer that consumes most of the energy consumed. The only advantage of screening systems in the screen form factor is that they are smaller than the portal version of the L-3 ProVision.
Based on the traditional approach to the synthesis of aperture, the bandwidth of microwave inspection systems can be increased by surrounding the person being inspected with a plurality of panels with antennas for obtaining a simultaneous view from different angles. This approach was implemented in the easyCheck inspection system developed by Camero [4]. This system has a portal design in the form of panels with antennas located around the person being inspected. Multi-angle radar images of a person passing through the portal are obtained with a frequency of 8 Hz, which allows to detect objects that are dangerous under the clothes.
At present, all screening systems on the market automatically recognize dangerous objects and report the result of recognition in the form of pictograms, without presenting radar images to the operator, thereby preserving the privacy of the people being inspected.
In the screening system we are developing, the natural movement of a person between fixed vertical linear antenna arrays will be used to form a synthesized aperture, which allows surpassing analogues by the following characteristics: throughput, mass, dimensions, cost, and power consumption. The coherent processing of the radar signal in such a system is carried out using an RGB-D video sensor or lidar, which synchronously with the radar system registers the movement of the person being inspected in space. The depth map recorded by the video sensor serves to extract the trajectory of parts of the human body for subsequent compensation associated with the movement of phase raids in the radar signal. The synthesized aperture, formed by the movement of the target itself past a stationary antenna or antenna system, is called an inverse synthesized aperture.
A microwave screening system using the principle of inverse aperture synthesis should have the superior characteristics listed above for the following reasons:
- The maximum bandwidth will be achieved due to the fact that the inspected person does not need to stop, since to obtain a radar image, it is required to pass between the antenna lines.
- Mass and dimensions become minimal, since neither a portal is needed to isolate the zone of movement of the antennas, nor massive panels with antennas.
- The number of antennas becomes significantly smaller than that of microwave systems with exclusively electronic switching, which reduces the complexity and cost of the microwave part of the inspection system.
- Samples of the radar signal come from a smaller number of channels and are processed as they arrive in such a way that after a person passes the inspection zone, the length of which must be equal to the horizontal size of panels or the portal of traditional systems, the radar image is calculated simultaneously for the entire surface of the human body. Due to the low flow of radar data and their processing as it is received, a powerful data processor is not required, and the microwave system can be built in a mobile version in a form factor of a metal detector or two racks with antennas located on both sides of the person walking.
The operability of the described microwave inspection system was investigated using the experimental setup [5, 6] created for these purposes, the photo of which is shown in the following figure.
The installation consists of a linear displacement module (1) receiving and transmitting antennas (2), a vector network analyzer (3), flexible antenna feeders (4), a human dummy (5), a trolley for moving the dummy (6), a linear displacement module of the dummy ( 7), RGB-D video sensor (8) and personal computer (9). The receiving and transmitting antennas (2) are connected to the vector network analyzer by means of flexible feeders (4). Data acquisition occurs using the doll multiplication method. Independent movement of the receiving and transmitting antennas (if two modules are used) along parallel lines allows simulating the behavior of linear monostatic and multi-static (MIMO) antenna arrays. At the same time, the positions of the antennas in which the radar signal is sampled are set programmatically, thanks to which the characteristics of any linear antenna array can be investigated with the help of the installation. The human dummy (5), the direction of movement of which can be set by orienting the linear displacement module (7) placed on the floor, moves incrementally at programmable intervals. After setting the parameters of the experiment: sampling intervals of the radar signal, the dummy moving interval, the frequency range of the probing signal, the number of discrete frequencies, the experiment runs automatically. In the course of the experiment, for each position of the dummy, a map of the depth of the sensing scene and the sampling of the radar signal at the given antenna positions is recorded. The resulting data is processed together to obtain radar images. To obtain similar real-time data from a moving person, an electronically-switched linear antenna array is required. A key feature of the screening system being developed is the use of an RGB-D video sensor (in the experimental setup we used Microsoft Kinect v2) or a similar device, which allows obtaining a detailed radar image using a significantly smaller amount of radar data.
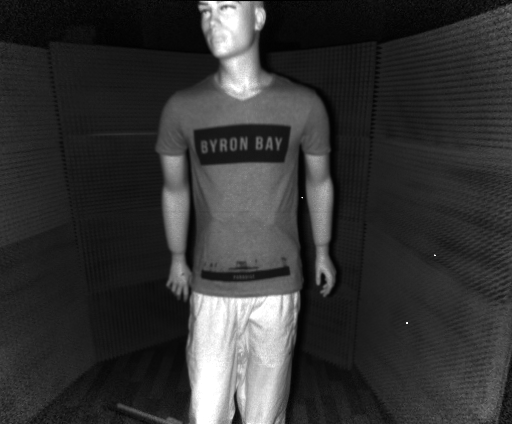
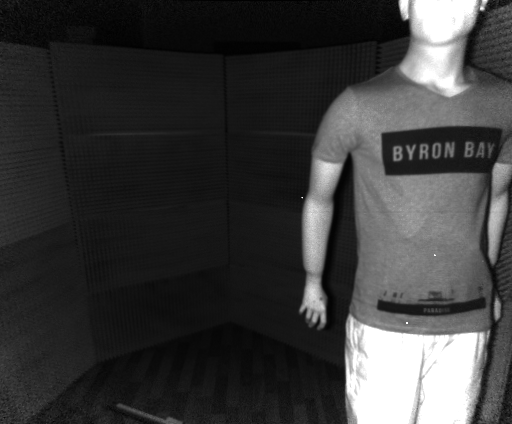
Examples of the initial data recorded during the experiments are shown in the following figures.
 |  |  |
| 1st frame | 101st frame | 201st frame |
|---|---|---|
| IR images obtained using Microsoft Kinect. | ||
 |  | 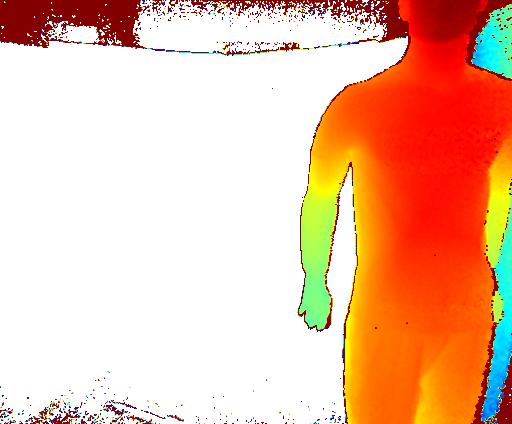 |
| 1st frame | 101st frame | 201st frame |
|---|---|---|
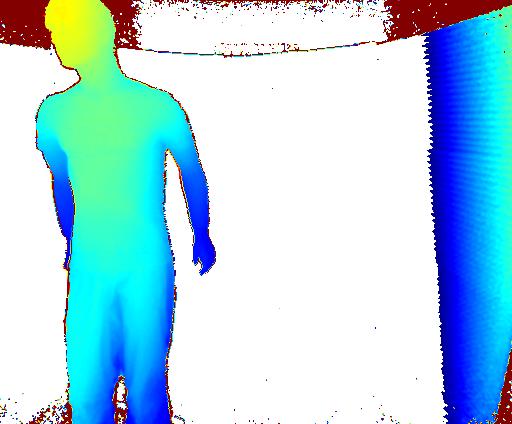
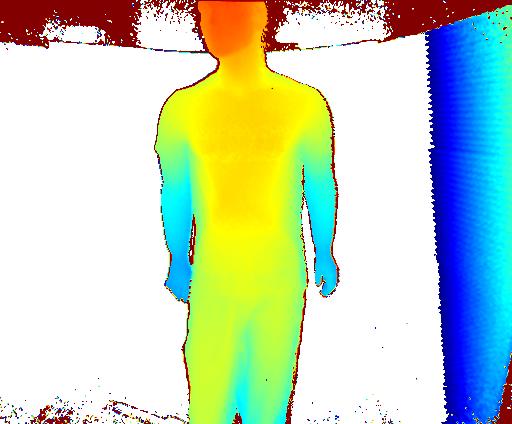
| Depth maps provided by Microsoft Kinect. | ||
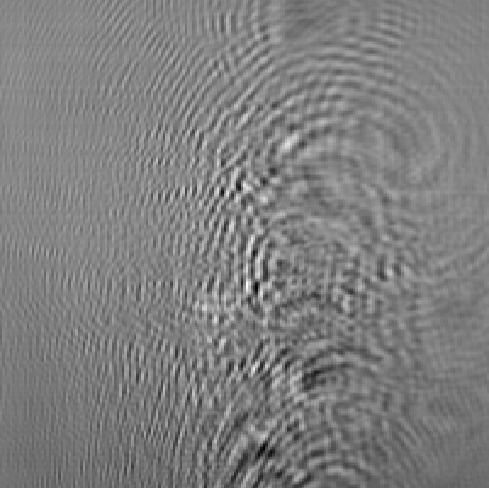 | 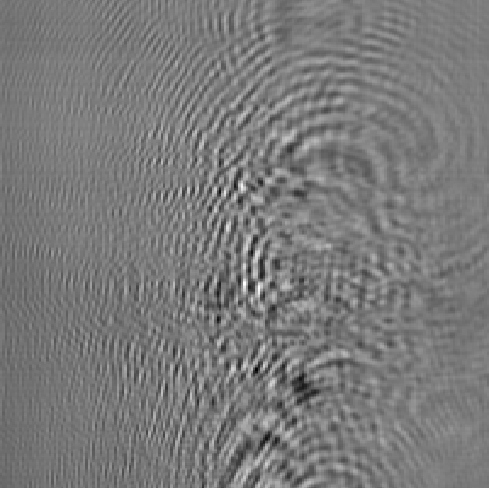 | 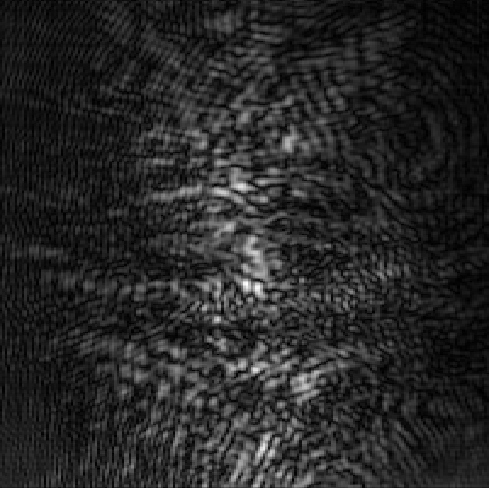 |
| Common-mode signal component | Quadrature signal component | Signal amplitude |
|---|---|---|
| A radar signal (radio hologram) recorded at a frequency of 15.55 GHz. | ||
The infrared images and depth maps of the sensing scene shown above, with the sequence numbers 1, 101, 201, were obtained during the experiment, in which the dummy was moved to a distance of 1 m with stops every 0.5 cm, resulting in 201 frames. The radar signal (radio hologram) at a frequency of 15.55 GHz is presented in the form of half-tone images. The first column on the left of the radio hologram corresponds to samples of the radar signal with a step of 0.5 cm, obtained as a result of a mechanical scan for the sounding scene with the sequence number 1. The last column of the radio hologram corresponds to the samples of the radar signal for the sounding scene with the serial number 201. Intermediate columns of the radio hologram correspond to the scenes with intermediate ordinal numbers. In total, the radio hologram has 201 columns, according to the number of static scenes, and 201 lines, according to the number of samples of the radar signal over an interval of 1 meter in length with 0.5 cm sampling steps. To register a similar radio hologram in real time, a 1 meter long mono-static antenna array would be required, consisting of 201 antennas located at a distance of 0.5 cm from each other. For a multi-frequency signal consisting of N frequencies, it is obtained, respectively, N radio holograms.
Before processing the received data, it is required to calibrate the optical system of the photosensor, as well as to jointly calibrate the radar and optical systems of the installation. The calibration of the Microsoft Kinect v2 optical system and the range channel was discussed here . Calibration of the radar system was carried out in two stages. At the first stage, the position of the antenna displaced by the linear displacement module in the coordinate system associated with the video sensor was determined. The second stage consisted in measuring the frequency-dependent probing signal of the position of the phase center of the antenna, which is necessary for processing the broadband signal. The position of the center of the open end of a circular waveguide, used as an antenna, was entered into the coordinate system of the image sensor using a graphic marker attached to the end of the antenna, as shown in the following figure.
The position of the marker was recorded for the two extreme positions on the scan line. The remaining antenna positions were calculated using interpolation. Stepper motors and the optical system of the image sensor provided the positioning error of the signal samples, which did not significantly affect the resolution of the radar image.
When using a broad band of the probing signal, the position of the phase center of the antenna at different frequencies may be different. Under the phase center of the antenna understand the imaginary center, which can be taken for the center of the spherical wave emitted by the antenna. In a spherical wave, the surfaces of equal phase are spheres. The antenna was calibrated at a scatterer small compared to the radiation wavelength and consisted in finding a correction factor for the signal detected by the antenna, which allows one to obtain the theoretically expected dependence of the signal phase. The effect of antenna calibration is illustrated in the following figure, which shows the result of reconstructing a radar image for a point diffuser, located 20 cm from the scan line, which coincides with the Y axis on the graph. Sounding and reconstruction of the radar image was carried out in the frequency range from 6 to 12 GHz.
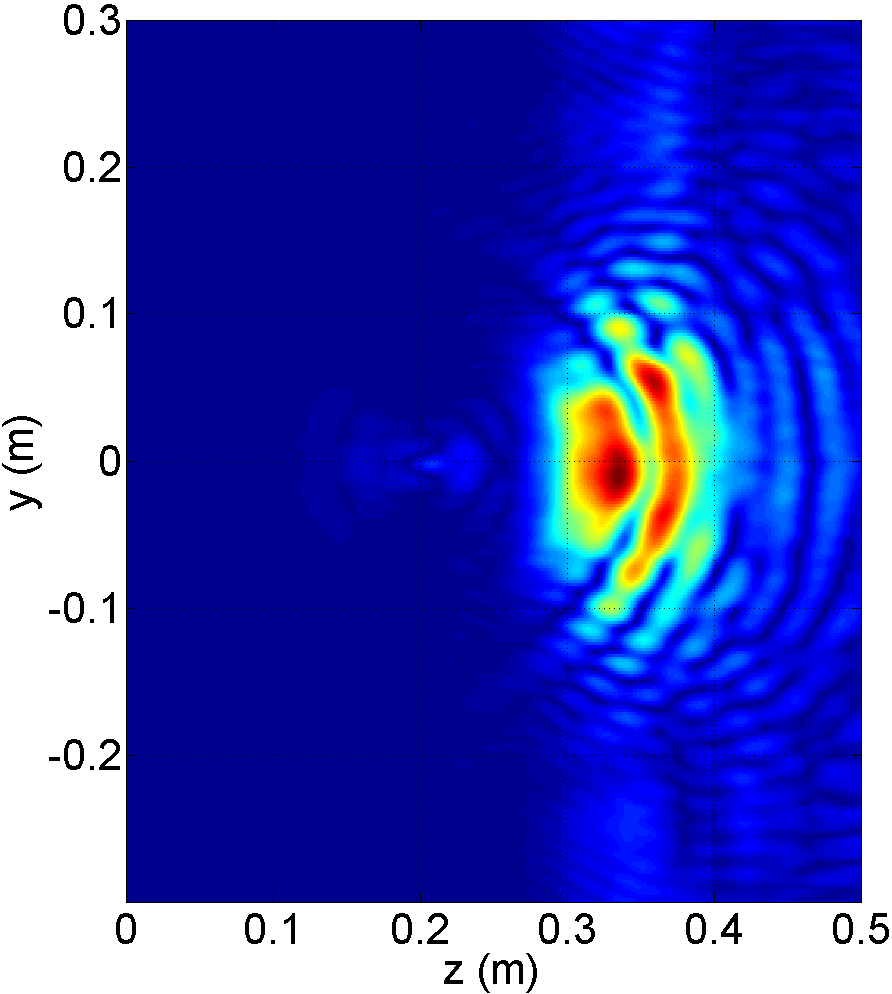 | 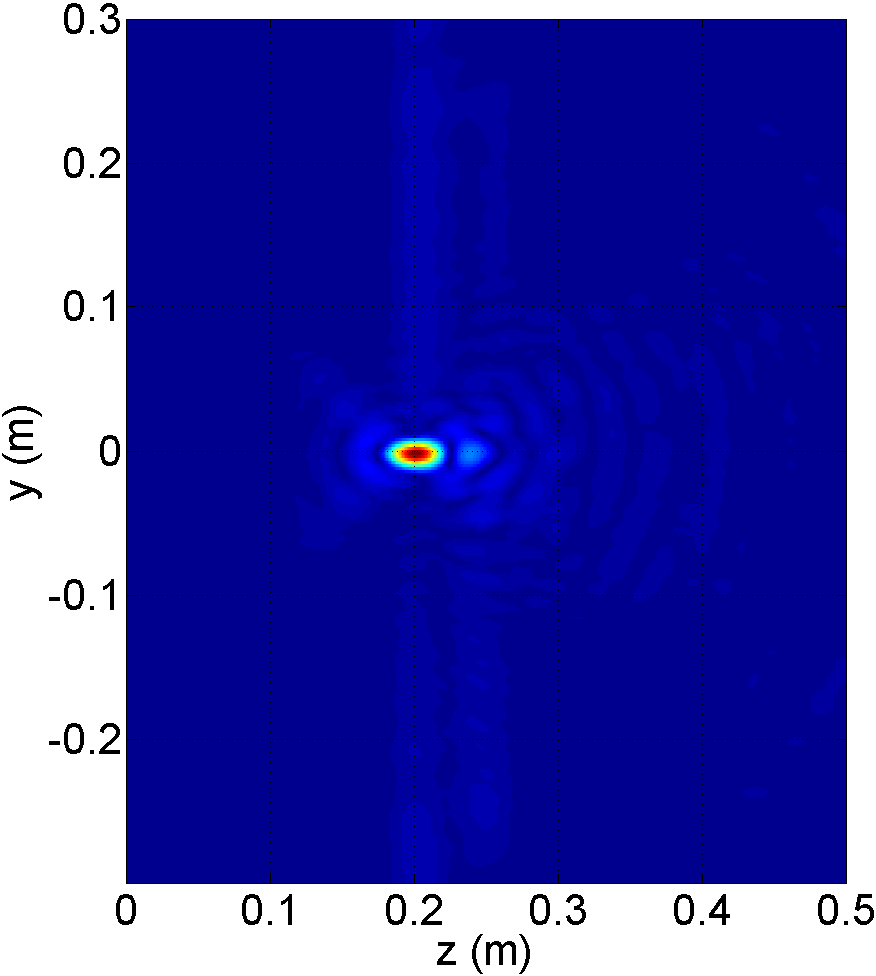 | 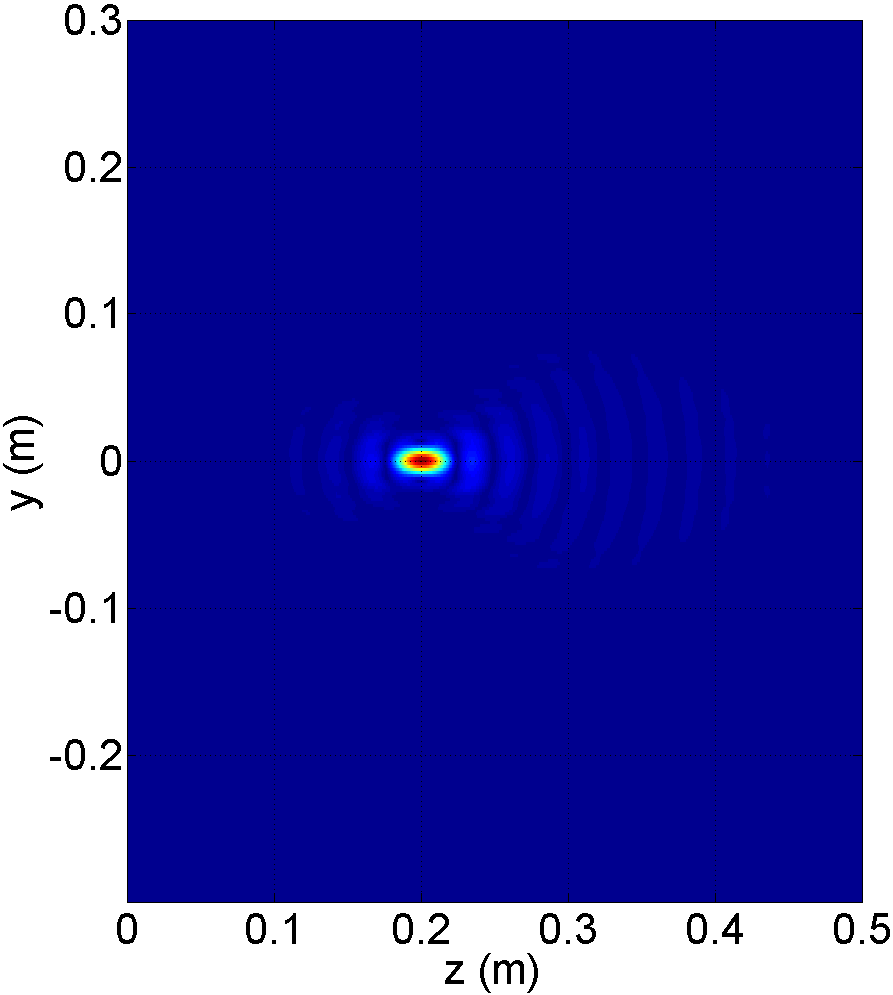 |
| Without antenna calibration | After calibration | Model |
|---|---|---|
| Restored radar image of a point diffuser | ||
The first image on the left in the figure above was obtained after calibrating the antenna feeders for the average position on the scan line using the reference loads (calibration set) for the vector network analyzer. It is seen that the displacement of the measurement planes to the ends of the feeders does not allow to get a focused radar image. The second image shows a radar image obtained after calibrating the antenna and correcting the source data. The third is a reference image obtained as a result of numerical simulation.
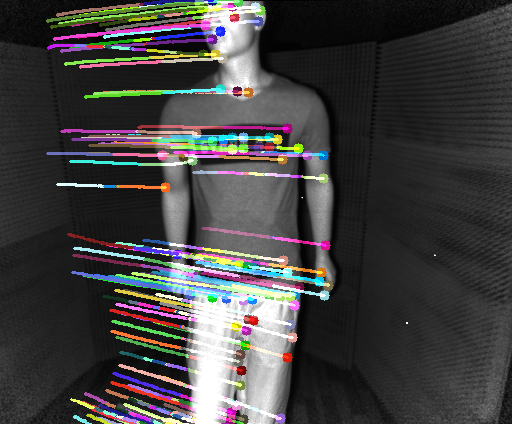
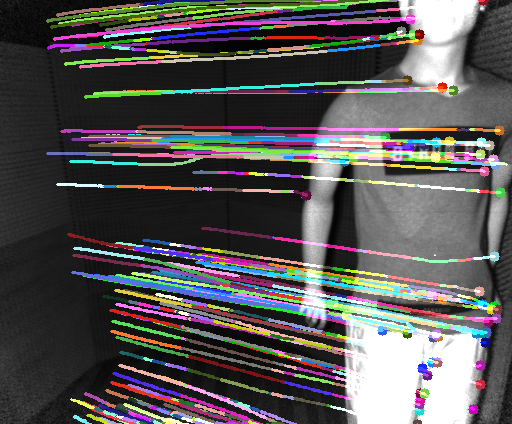
After calibrating the antenna system, you can process the data obtained in experiments with a dummy with a broadband probe signal. The processing of the radar signal consisted of the following steps: finding specific points on the halftone image of the dummy; generating a dense grid associated with specific points, each node of which is a moving focus point for a radar signal; finding the trajectory of special points from frame to frame; finding the trajectory of dense mesh nodes; integrating a focused radar signal for each node of the dense grid from frame to frame; visualization of the received data array in the form of a radar image.
The figure below illustrates the extraction of specific points and tracking them on a sequence of halftone images of a moving dummy. Each halftone image corresponds to a depth frame, which contains the necessary range attribute for each pixel of the halftone image.
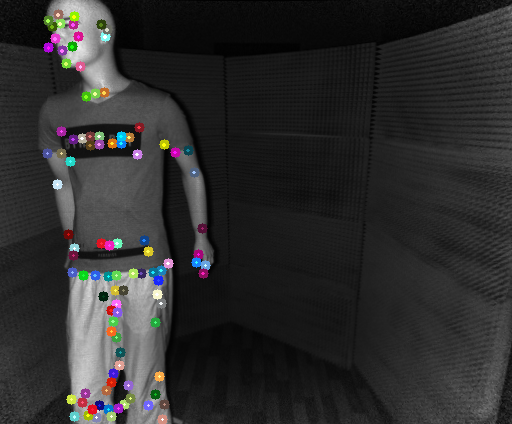 |  |  |
| 1st frame | 101st frame | 201st frame |
|---|---|---|
| Tracking the dummy on a sequence of frames obtained during a simulation experiment. | ||
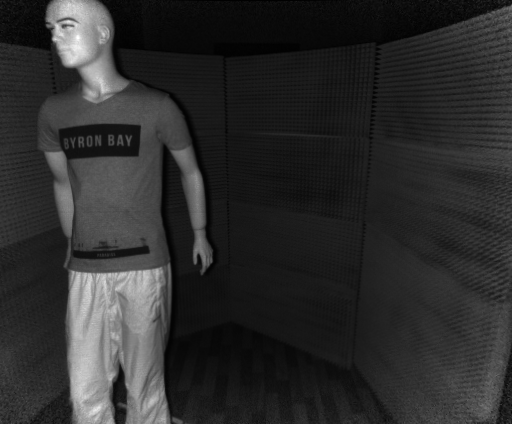
At the current stage of the project, simulation experiments were carried out with a dummy. The following figure shows a mannequin, under the clothes of which various objects that pose a threat were hidden: a knife in a case, a gas pistol in a cloth belt, and pieces of soap with bolts on the surface as a simulator of an improvised explosive device.
In the simulation experiment with the dummy shown in the figure, a signal was used with stepwise frequency switching in the range from 6 to 12 GHz with a frequency change step of 250 MHz, as a result of which the reflected signal was recorded at 25 frequencies. The dummy moved at intervals of 1 cm at a total distance of 100 cm using the linear displacement module. The line along which the antennas were scanned had a length of 100 cm with a sampling step of 1 cm. The total amount of radar data, therefore, was an array of complex numbers 101⨯101⨯25 in size. The distance to the dummy varied from 150 to 110 cm along the optical axis of the image sensor. The average distance from the dummy to the scanning line with antennas was 80 cm.
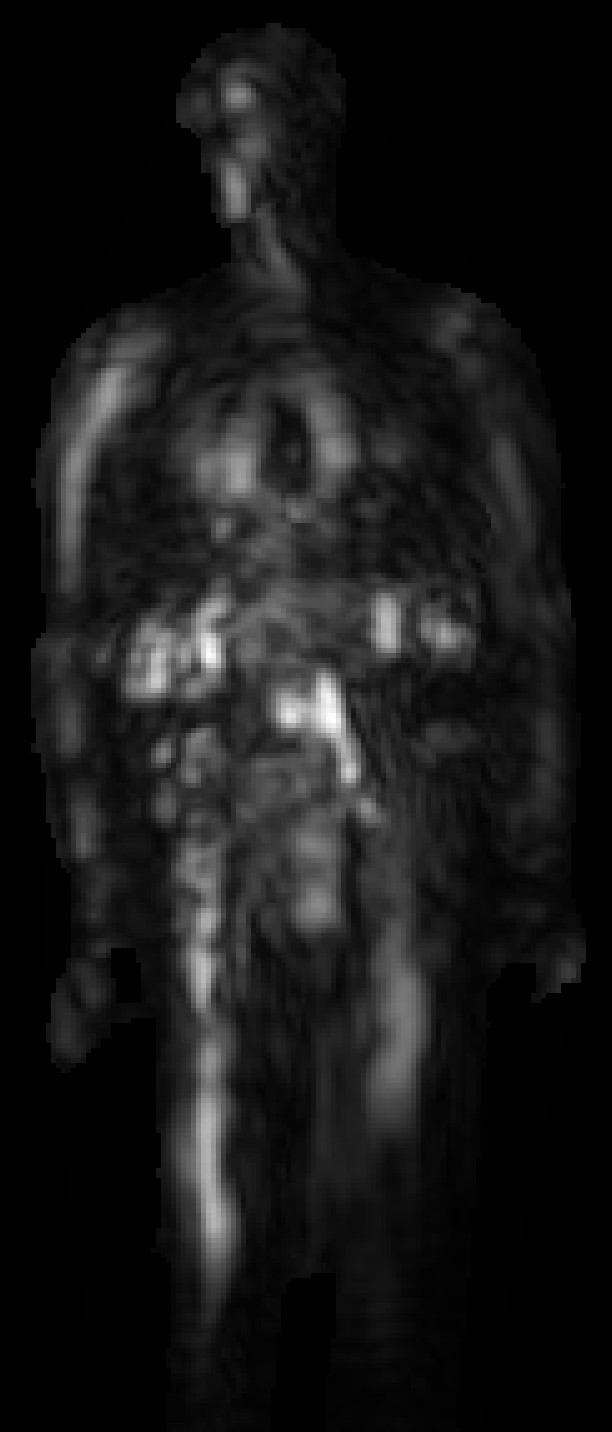
The following figure shows the resulting radar image obtained by focusing on a sequence of layers from the clothing surface to a depth of 2.5 cm and presenting the obtained data in the near-surface layer using the maximum value projection method.
As can be seen in the figure above, all hidden objects under clothing are distinguishable. The reflection from the knife can be taken as a reflection from the surface of the right thigh of the dummy. It is expected that the images of hidden objects on the body of a moving person will have a greater contrast than on the dummy, since for a person walking in steps, the orientation of body surface fragments constantly changes in space, and when the signal is accumulated, such areas on radar images will have a much lower brightness. Radar images obtained for the human body should also be less noisy compared to the radar images of the dummy, since the dummy translucent for radio waves creates a complex interference pattern of the field on its surface, resulting in artifacts on the resulting radar images.
The spatial resolution of a reduced radar image with objects hidden under clothes is limited by the wavelength of the signal being probed and is about 3 cm for the average frequency of the 9 GHz band used. The resolution of the radar images can be increased by increasing the radiation frequency, but this increases the absorption of waves in clothing due to which tight outerwear becomes opaque. Unlike microwave scanners used at airports, the provision of high-resolution radar images for ground transportation is not required. More important is the possibility of inspection in tight outer clothing.
A possible appearance of a microwave inspection system with an inverse synthetic aperture is presented in the following figure.
The figures show variants of the inspection system with a different number of linear antenna arrays, a sufficient number of which can be installed during simulation experiments on the described installation, without creating a complex radar system with a fixed number of antennas and their location. The number of antenna arrays should be sufficient to obtain radar images for the entire surface of the inspected person.
The next step in the creation of an inspection system will be the development of high-speed linear antenna arrays for real-time data collection in order to conduct experiments on a moving person. Instead of a vector network analyzer, one or more frequency-tunable microwave oscillators and a quadrature receiver will be used.
A microwave screening system with inversely synthesized apertures can change the approach to ensuring safety in ground transportation, just as microwave scanners have impacted the safety of air transport. The appearance on the market of accessible devices for three-dimensional video capturing of the observed scene makes it possible to implement a comprehensive system for inspecting structured passenger traffic, which would allow, without any inconvenience, to automatically inspect passengers in outerwear in motion using safe microwave radiation.
As mentioned above, simulation experiments with the installation will produce the puppet animation technique. Applying it to the radar data, you can get a “radar animation film”, in which each of the following radar images is obtained by integrating the newly received data with the previous radar image, resulting in increased resolution. Looking at the animation, you can see that a detailed radar image can be obtained when the dummy has traveled a sufficient distance, forming a synthesized aperture of sufficient length that is in full compliance with the provisions of the classical radar.
This work was supported by the grant of the Russian Science Foundation No. 15-19-30012.
Literature
- DL McMakin, PE Keller, DM Sheen, and TE Hall, «Dual-surface dielectric depth detector for holographic millimeter-wave security scanners,» in Proc. SPIE 7309, Orlando, Florida, USA, Apr. 2009. [ Online ].
- BN Lyons, E. Entchev, and MK Crowley, «Reflect-array based mmwave people screening system,» in Proc. SPIE 8900, Dresden, Germany, Oct. 2013. [ Online ].
- SS Ahmed, «Personnel screening with advanced multistatic imaging technology,» in Proc. SPIE 8715, Baltimore, Maryland, USA, May 2013. [ Online ].
- A. Beeri and R. Daisy, «System and method for volume visualization in ultra-wideband radar imaging system,» USA Patent 9 354 307, May, 2016. [ Online ].
- A. Zhuravlev, V. Razevig, A. Tataraidze, M. Chizh, S. Ivashov, and A. Ivashov, «Experimental setup to simulate the performance of ISAR-based microwave personnel screening system,» in 2016 IEEE International Symposium on Phased Array Systems and Technology (PAST), Boston, MA, USA, 2016, pp. 1-7. [ Online ].
- A. Zhuravlev, V. Razevig, M. Chizh, and S. Ivashov, «Imaging of concealed objects on moving persons by creating synthetic aperture due to their natural motion,» in 2017 IEEE International Conference on Microwaves, Communications, Antennas and Electronic Systems (COMCAS), Tel Aviv, Israel, 2017, pp. 1-4.
All Articles