Acoustic measurements. Measure the frequency response of improvised means
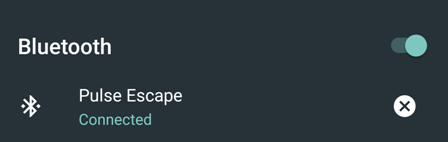
I bought a Motorola Pulse Escape bluetooth headset. The sound was generally pleasant, but one moment remained incomprehensible. According to the instructions, they have an equalizer switch. Presumably, the headphones have a few wired settings that switch in a circle. Unfortunately, I could not determine by ear what the settings were and how many of them there, and decided to find out with the help of measurements.
So, we want to measure the amplitude-frequency response (AFC) of headphones - this is a graph that shows which frequencies are played louder and which ones are quieter. It turns out that such measurements can be made "on the knee", without special equipment.
We need a computer with Windows (I used a laptop), a microphone, and a sound source — some kind of player with bluetooth (I picked up a smartphone). Well, the headphones themselves, of course.
(Under the cut - a lot of pictures).
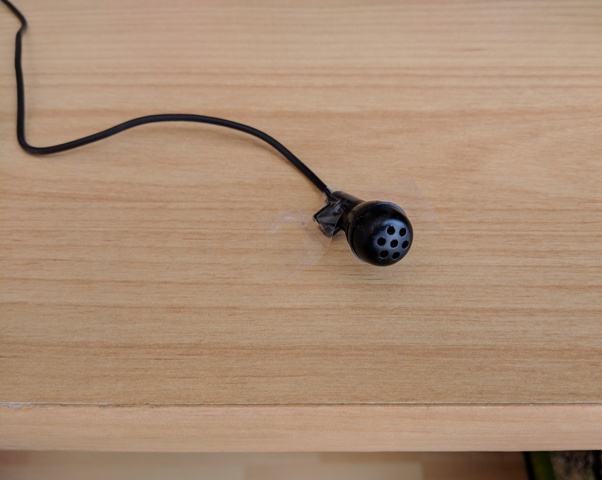
Here I have found such a microphone among the old gadgets. The microphone is penny, for talking, not intended either for recording music, much less for measurements.
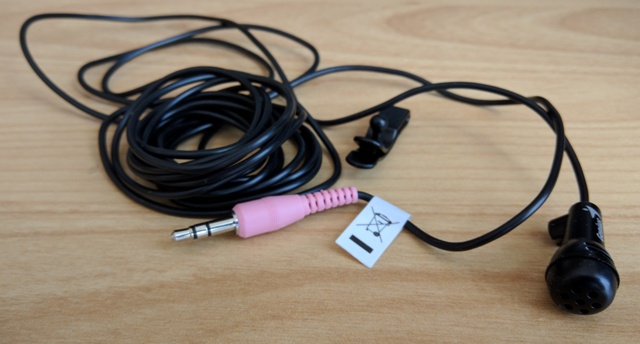
Of course, such a microphone has its own frequency response (and, running ahead, the directivity pattern), therefore it will distort the measurement results greatly, but it is suitable for the task, because we are interested not so much in the absolute characteristics of the headphones as in how they change when the equalizer is switched.
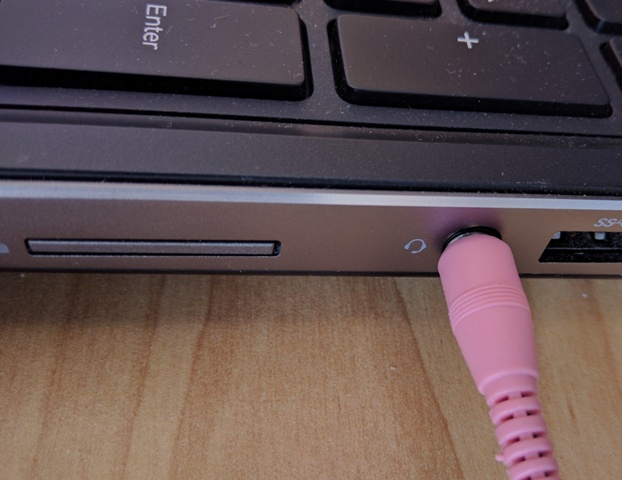
The laptop had only one combined audio jack. We connect our microphone there:
Windows asks what kind of device we have connected. We answer that this is a microphone:
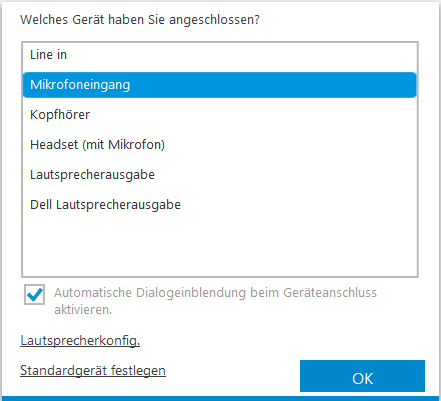
Windows - German, sorry. I promised to use the materials at hand.
Thus, the only audio jack is busy, so you need an additional sound source. We download a special test audio signal to the smartphone - the so-called pink noise. Pink noise is a sound that contains the whole range of frequencies, and equal power over the entire range. (Do not confuse it with white noise! White noise has a different power distribution, therefore it cannot be used for measurements, it threatens to damage the speakers).
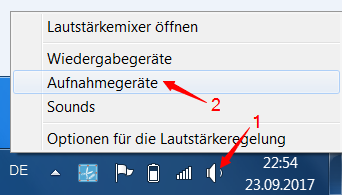
Adjust the sensitivity level of the microphone. Click the right mouse button on the loudspeaker icon in Windows and select the adjustment of recording devices:
We find our microphone (I got it called Jack Mic):
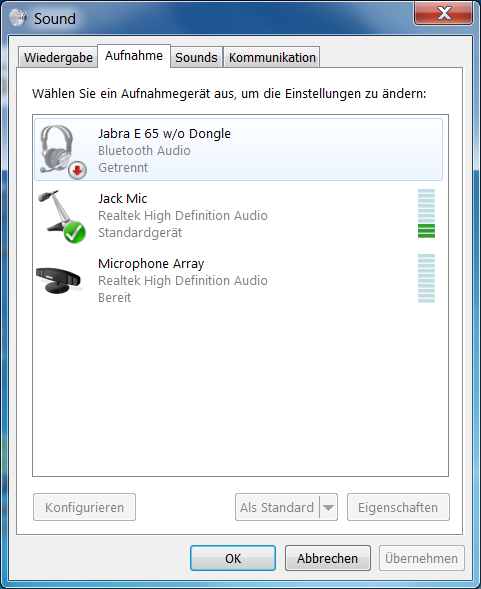
Choose it as a recording device (a bird in a green circle). Expose him to the level of sensitivity closer to the maximum:
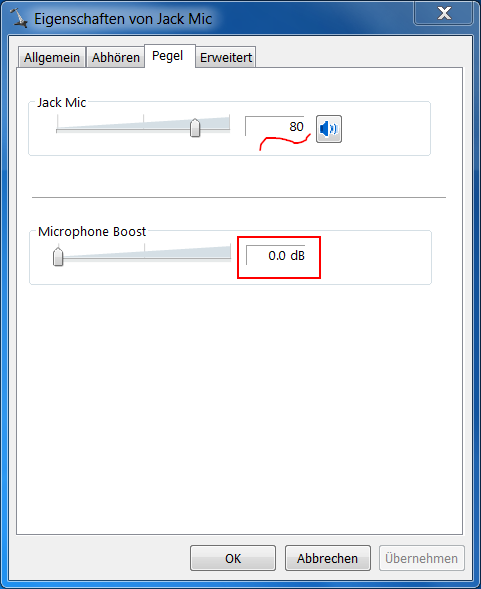
Microphone Boost (if any) remove! This is an automatic sensitivity adjustment. For the voice - well, but in the measurements will only interfere.
Install on the laptop measuring program. I love TrueRTA for being able to see many graphs on one screen at once. (RTA - in English AFC). In the free demo version, the program measures the frequency response in steps of an octave (that is, the adjacent measurement points differ in frequency by 2 times). This, of course, is very rude, but it will do for our purposes.
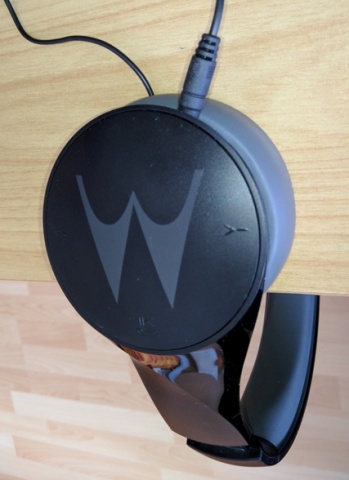
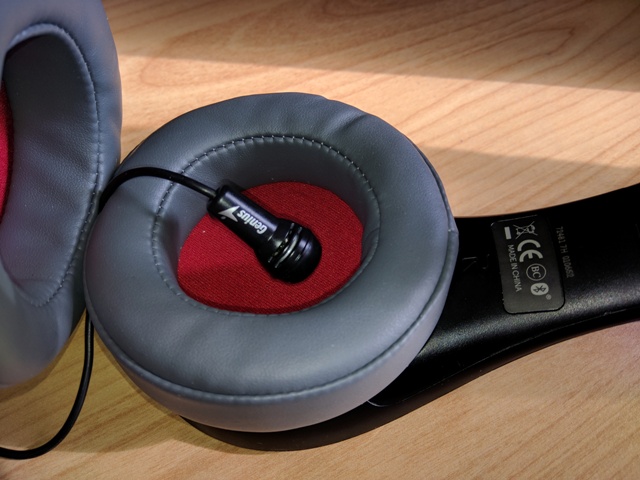
With the help of adhesive tape, we fix the microphone near the edge of the table, so that it can be covered with an earpiece:
It is important to fix the microphone so as not to move in the measurement process. We connect the headphones with a wire to the smartphone and put one earphone on top of the microphone, so that it is tightly closed from the top - like this, the earphone covers the human ear:
The second earpiece hangs freely under the table, from which we will hear the included test signal. Make sure that the headphones are stable, they also can not be shifted in the measurement process. You can start.
Run the program TrueRTA and see:
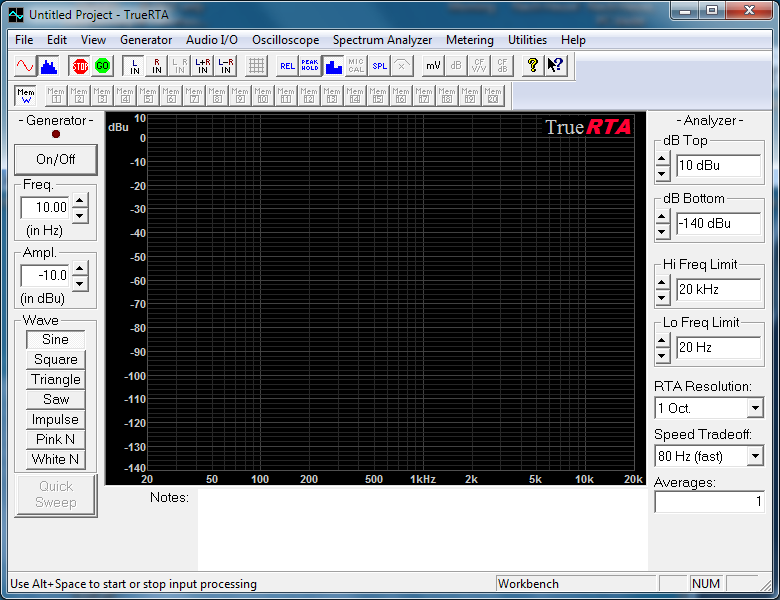
The main part of the window is a field for graphs. To the left of it are the buttons of the signal generator, we will not need it, because we have an external signal source, a smartphone. On the right - chart and measurement settings. Above - some more settings and controls. We set the white color of the field to better see the graphics (menu View → Background Color → White).
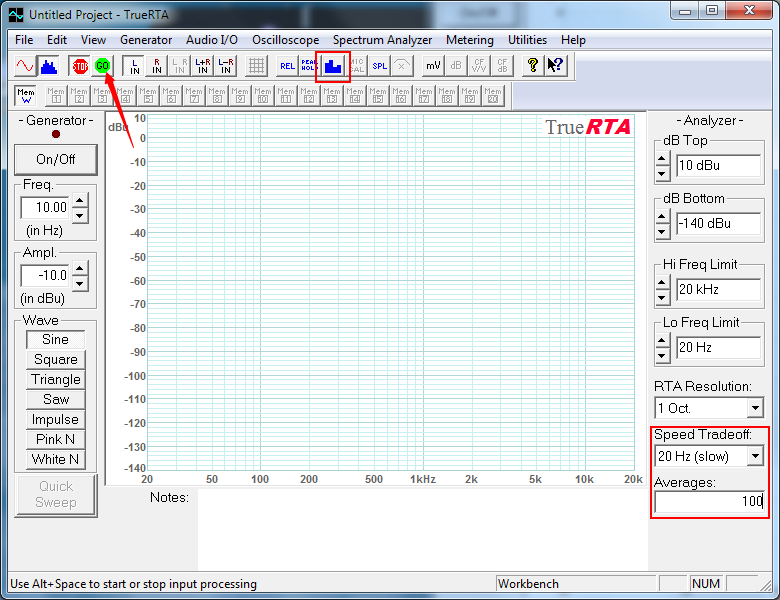
We set the measurement limit to 20 Hz and the number of measurements, say, 100. The program will automatically do the specified number of measurements in a row and average the result; this is necessary for the noise signal. Turning off the display of bar charts, let the graphs be drawn instead (the button on top with the image of bars is marked in the following screenshot).
Having made the settings, we make the first measurement - it will be the measurement of silence. We close the windows and doors, ask the children to shut up and click Go:
If everything is done correctly, a graph will start to appear in the field. Let's wait until it stabilizes (stops “dancing” back and forth) and press Stop:
We see that the “silence volume” (background noise) does not exceed -40dBu, and set (dB Bottom knob in the right part of the window) the lower display limit to -40dBu to remove the background noise from the screen and see the signal of interest to us larger.
Now we will measure the real test signal. Turn on the player on the smartphone, starting with a low volume.
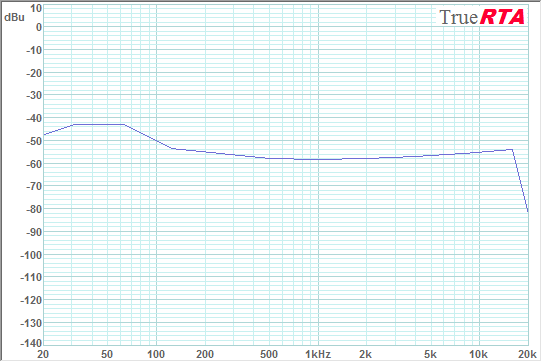
We start the measurement in TrueRTA with the Go button and gradually increase the volume on the smartphone. A hissing noise starts to come from a free headset, and a graph appears on the screen. Add volume until the graph reaches approximately -10 ... 0dBu in height:

Waiting for the stabilization of the graph, stop the measurement with the Stop button in the program. The player is also stopping. So, what do we see on the chart? Good bass (except the deepest), a slight decline to the middle frequencies and a sharp decline to the upper frequencies. I remind you that this is not a real frequency response of headphones, a microphone contributes to it.
We will take this schedule as a reference. Headphones received a signal through the wire, in this mode they work as passive speakers without any equalizers, their buttons do not work. Plot the graph in memory number 1 (through the menu View → Save to Memory → Save to Memory 1 or by pressing Alt + 1). You can save graphs in memory cells, and use the Mem1..Mem20 buttons in the upper part of the window to enable or disable the display of these graphs on the screen.
Now we disconnect the wire (both from the headphones and from the smartphone) and connect the headphones to the smartphone via bluetooth, trying not to move them on the table.
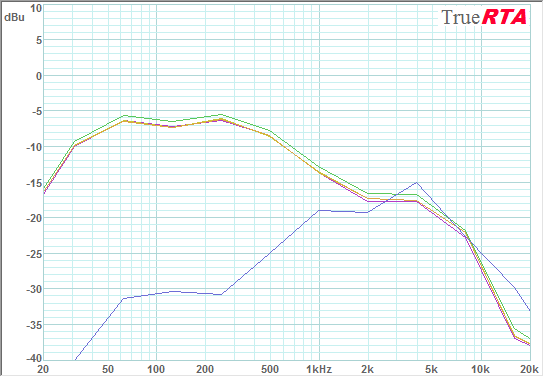
Turn on the player again, start the measurement with the Go button and, adjusting the volume on the smartphone, we bring the new timeline to the reference one. The reference graph is green and the new blue is:
We stop the measurement (the player can not be turned off, if the hissing from a free headset is not annoying) and rejoice that the bluetooth headphones give the same frequency response as the wire. We bring the graph in memory number 2 (Alt + 2), so as not to leave the screen.
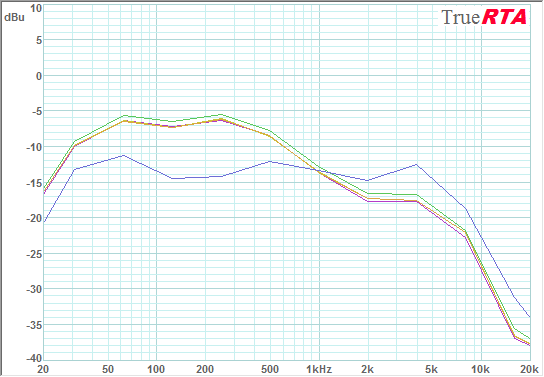
Now we switch the equalizer with the headphone buttons. Headphones report a cheerful female voice "EQ changed". Turn on the measurement and, waiting for the stabilization of the graph, we see:
Hm In some places there are differences in 1 decibel, but this is somehow not serious. Rather like measurement errors. We also bring this graph into memory, switch the equalizer again and after the measurement we see another graph (if you look very well):
Well, you already understood. No matter how much I switched the equalizer on the headphones, it didn't change anything!
On this, in principle, you can finish the work and draw a conclusion: these headphones do not have a working equalizer . (Now it is clear why it was impossible to hear him).
However, the fact that we did not see any changes in the results is distressing and even gives rise to doubts about the correctness of the methodology. Maybe we measured something wrong?
To make sure that we measured the frequency response, and not the weather on the moon, let's turn the equalizer elsewhere. We also have a player in the smartphone! Let's use its equalizer:
And here is the measurement result:
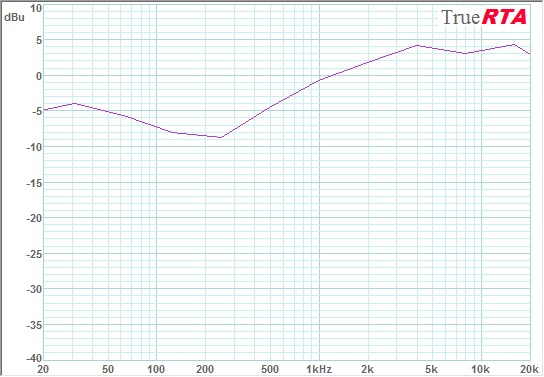
This is another matter! The new schedule is noticeably different from the old ones. Fill it in memory too (I got memory number 6) and find the difference between the new schedule and the reference, TrueRTA can do it (menu Utilities → Difference):
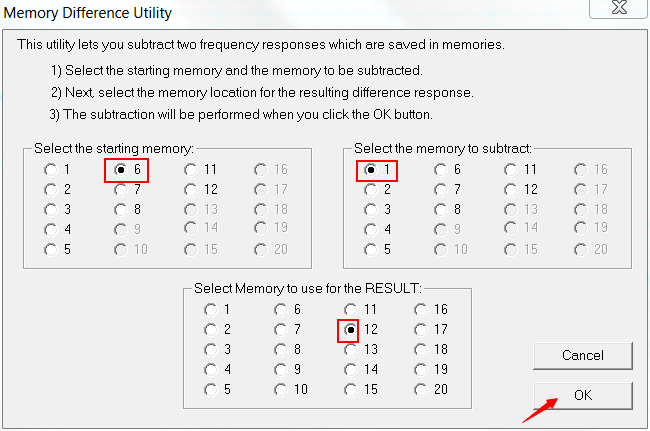
Subtract number 6 from the graph, graph number 1 and put the result in memory number 12. Remove the remaining graphs from the screen with the Mem1, Mem2 buttons, etc., leaving only Mem12:
Isn't it true, this curve approximately resembles what the equalizer promised?
Turn off the equalizer, with him everything is clear. And I also said at the beginning that you can not move headphones and a microphone between measurements. And what will happen if you move a centimeter?
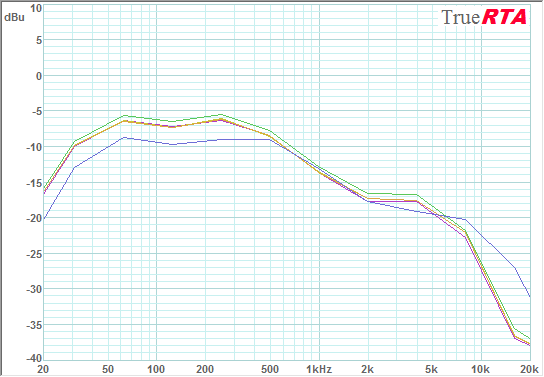
Look, the schedule slightly changed from the shift: the bass diminished, the tops were added. This most likely means that the microphone has a different sensitivity to sounds coming from different directions (this is called a directivity pattern).
Let's spend one more experience: we measure sounding, having refused the closed volume. Like this:
And what do we see as a result?
Where have all our bass gone? Have you seen them by chance?
So, we want to measure the amplitude-frequency response (AFC) of headphones - this is a graph that shows which frequencies are played louder and which ones are quieter. It turns out that such measurements can be made "on the knee", without special equipment.
We need a computer with Windows (I used a laptop), a microphone, and a sound source — some kind of player with bluetooth (I picked up a smartphone). Well, the headphones themselves, of course.
(Under the cut - a lot of pictures).
Training
Here I have found such a microphone among the old gadgets. The microphone is penny, for talking, not intended either for recording music, much less for measurements.
Of course, such a microphone has its own frequency response (and, running ahead, the directivity pattern), therefore it will distort the measurement results greatly, but it is suitable for the task, because we are interested not so much in the absolute characteristics of the headphones as in how they change when the equalizer is switched.
The laptop had only one combined audio jack. We connect our microphone there:
Windows asks what kind of device we have connected. We answer that this is a microphone:
Windows - German, sorry. I promised to use the materials at hand.
Thus, the only audio jack is busy, so you need an additional sound source. We download a special test audio signal to the smartphone - the so-called pink noise. Pink noise is a sound that contains the whole range of frequencies, and equal power over the entire range. (Do not confuse it with white noise! White noise has a different power distribution, therefore it cannot be used for measurements, it threatens to damage the speakers).
Adjust the sensitivity level of the microphone. Click the right mouse button on the loudspeaker icon in Windows and select the adjustment of recording devices:
We find our microphone (I got it called Jack Mic):
Choose it as a recording device (a bird in a green circle). Expose him to the level of sensitivity closer to the maximum:
Microphone Boost (if any) remove! This is an automatic sensitivity adjustment. For the voice - well, but in the measurements will only interfere.
Install on the laptop measuring program. I love TrueRTA for being able to see many graphs on one screen at once. (RTA - in English AFC). In the free demo version, the program measures the frequency response in steps of an octave (that is, the adjacent measurement points differ in frequency by 2 times). This, of course, is very rude, but it will do for our purposes.
With the help of adhesive tape, we fix the microphone near the edge of the table, so that it can be covered with an earpiece:
It is important to fix the microphone so as not to move in the measurement process. We connect the headphones with a wire to the smartphone and put one earphone on top of the microphone, so that it is tightly closed from the top - like this, the earphone covers the human ear:
The second earpiece hangs freely under the table, from which we will hear the included test signal. Make sure that the headphones are stable, they also can not be shifted in the measurement process. You can start.
Measurements
Run the program TrueRTA and see:
The main part of the window is a field for graphs. To the left of it are the buttons of the signal generator, we will not need it, because we have an external signal source, a smartphone. On the right - chart and measurement settings. Above - some more settings and controls. We set the white color of the field to better see the graphics (menu View → Background Color → White).
We set the measurement limit to 20 Hz and the number of measurements, say, 100. The program will automatically do the specified number of measurements in a row and average the result; this is necessary for the noise signal. Turning off the display of bar charts, let the graphs be drawn instead (the button on top with the image of bars is marked in the following screenshot).
Having made the settings, we make the first measurement - it will be the measurement of silence. We close the windows and doors, ask the children to shut up and click Go:
If everything is done correctly, a graph will start to appear in the field. Let's wait until it stabilizes (stops “dancing” back and forth) and press Stop:
We see that the “silence volume” (background noise) does not exceed -40dBu, and set (dB Bottom knob in the right part of the window) the lower display limit to -40dBu to remove the background noise from the screen and see the signal of interest to us larger.
Now we will measure the real test signal. Turn on the player on the smartphone, starting with a low volume.
We start the measurement in TrueRTA with the Go button and gradually increase the volume on the smartphone. A hissing noise starts to come from a free headset, and a graph appears on the screen. Add volume until the graph reaches approximately -10 ... 0dBu in height:
Waiting for the stabilization of the graph, stop the measurement with the Stop button in the program. The player is also stopping. So, what do we see on the chart? Good bass (except the deepest), a slight decline to the middle frequencies and a sharp decline to the upper frequencies. I remind you that this is not a real frequency response of headphones, a microphone contributes to it.
We will take this schedule as a reference. Headphones received a signal through the wire, in this mode they work as passive speakers without any equalizers, their buttons do not work. Plot the graph in memory number 1 (through the menu View → Save to Memory → Save to Memory 1 or by pressing Alt + 1). You can save graphs in memory cells, and use the Mem1..Mem20 buttons in the upper part of the window to enable or disable the display of these graphs on the screen.
Now we disconnect the wire (both from the headphones and from the smartphone) and connect the headphones to the smartphone via bluetooth, trying not to move them on the table.
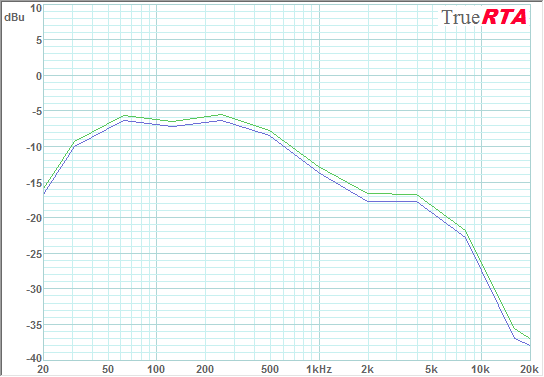
Turn on the player again, start the measurement with the Go button and, adjusting the volume on the smartphone, we bring the new timeline to the reference one. The reference graph is green and the new blue is:
We stop the measurement (the player can not be turned off, if the hissing from a free headset is not annoying) and rejoice that the bluetooth headphones give the same frequency response as the wire. We bring the graph in memory number 2 (Alt + 2), so as not to leave the screen.
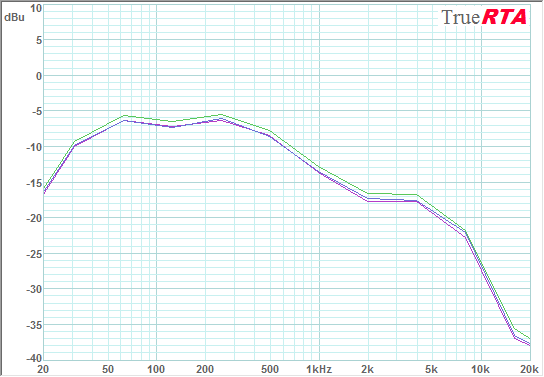
Now we switch the equalizer with the headphone buttons. Headphones report a cheerful female voice "EQ changed". Turn on the measurement and, waiting for the stabilization of the graph, we see:
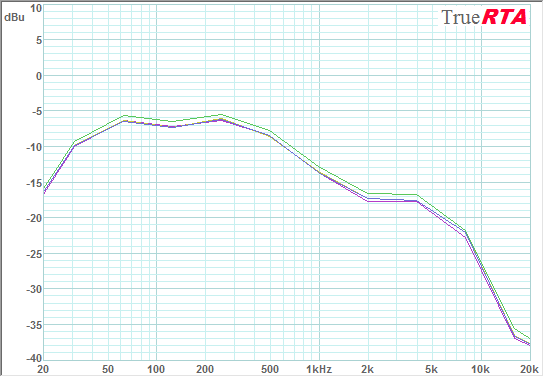
Hm In some places there are differences in 1 decibel, but this is somehow not serious. Rather like measurement errors. We also bring this graph into memory, switch the equalizer again and after the measurement we see another graph (if you look very well):
Well, you already understood. No matter how much I switched the equalizer on the headphones, it didn't change anything!
On this, in principle, you can finish the work and draw a conclusion: these headphones do not have a working equalizer . (Now it is clear why it was impossible to hear him).
However, the fact that we did not see any changes in the results is distressing and even gives rise to doubts about the correctness of the methodology. Maybe we measured something wrong?
Bonus measurements
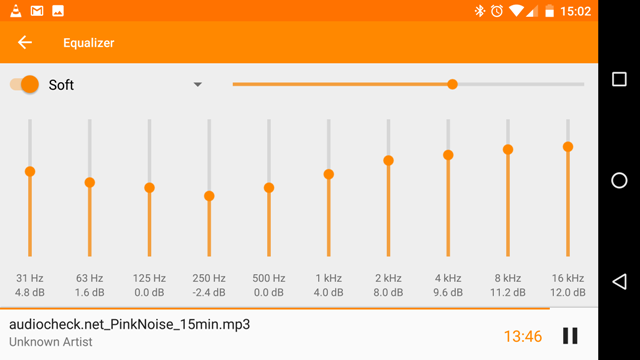
To make sure that we measured the frequency response, and not the weather on the moon, let's turn the equalizer elsewhere. We also have a player in the smartphone! Let's use its equalizer:
And here is the measurement result:
This is another matter! The new schedule is noticeably different from the old ones. Fill it in memory too (I got memory number 6) and find the difference between the new schedule and the reference, TrueRTA can do it (menu Utilities → Difference):
Subtract number 6 from the graph, graph number 1 and put the result in memory number 12. Remove the remaining graphs from the screen with the Mem1, Mem2 buttons, etc., leaving only Mem12:
Isn't it true, this curve approximately resembles what the equalizer promised?
Turn off the equalizer, with him everything is clear. And I also said at the beginning that you can not move headphones and a microphone between measurements. And what will happen if you move a centimeter?
Look, the schedule slightly changed from the shift: the bass diminished, the tops were added. This most likely means that the microphone has a different sensitivity to sounds coming from different directions (this is called a directivity pattern).
Let's spend one more experience: we measure sounding, having refused the closed volume. Like this:
And what do we see as a result?
Where have all our bass gone? Have you seen them by chance?
All Articles