Neuroart: why create pictures of brain neurons
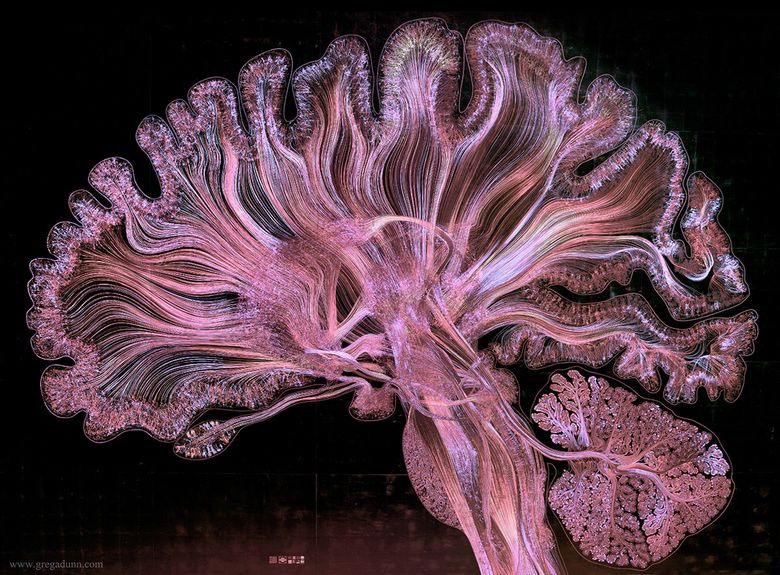
Art and science rarely overlap. When this happens and applied research, which is understandable only to specialists, is enriched with visual images, science receives more attention from ordinary people. Compare yourself: brain research around the world is done every day, but graphs, charts and X-rays do not cause us strong emotions. However, as soon as colorful drawings appear that illustrate the effect on the brain, the news gets a great response. Outside the context of scientific discoveries, we just like to look at the work of internal organs, it is especially interesting to monitor the functioning of the hemispheres responsible for thinking.
Brain mapping
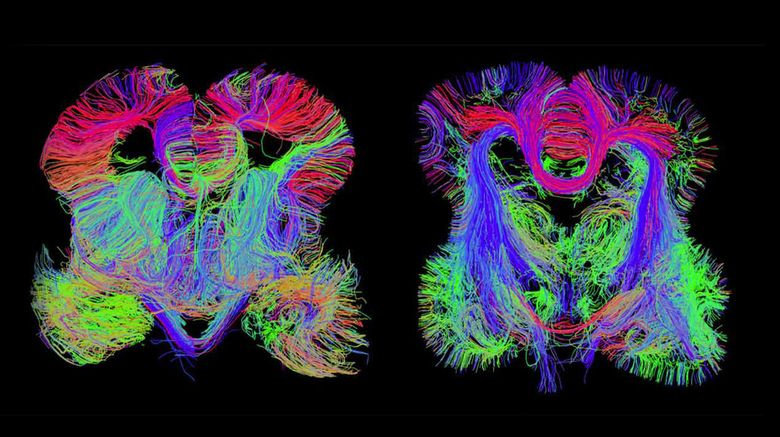
Mouse brain connection
Scientists from the Allen Institute for Brain Science in Seattle have created a map that details the relationships between mouse brain cells. Before creating such a picture, no artist would have thought of it - the researchers injected a green fluorescent virus into a certain area of the brain of a living mouse. The virus infected neurons near the injection site, and after three weeks spreading throughout the brain. As a result, a map of interconnections occurring in one of the brain regions was displayed as a green fluorescent grid of infected neurons.
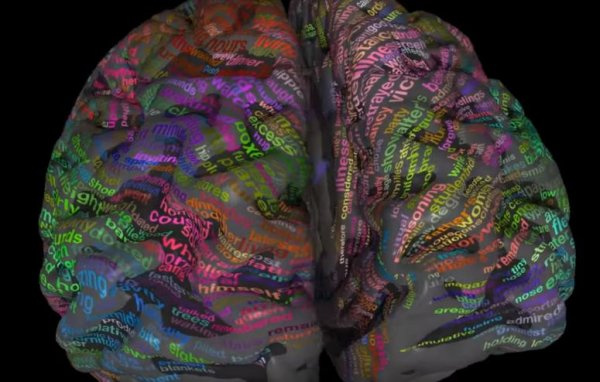
Even "ordinary" brain maps are impressive. Scientists from the University of California at Berkeley have developed an interactive map that shows where the meanings of certain words are stored, as well as how words and their meanings are related.

The world's largest three-dimensional map of the neural networks of the cerebral cortex was published by neuroscientists from the Allen Institute, Harvard Medical School and NERF (a research project in neuroelectronics). The development of the map took more than ten years: the researchers analyzed huge amounts of data on brain activity, and this allowed to establish the relationship between the structure and functions of the brain.
To create a map of the mouse's brain, horizontal and vertical lines were displayed on the screen in front of their eyes — neurons reacted to these visual signals. Then ultrathin brain slices were made. This allowed us to obtain numerous images of neurons and synapses, which were used in the creation of a 3D model.
The brain as the biggest mystery
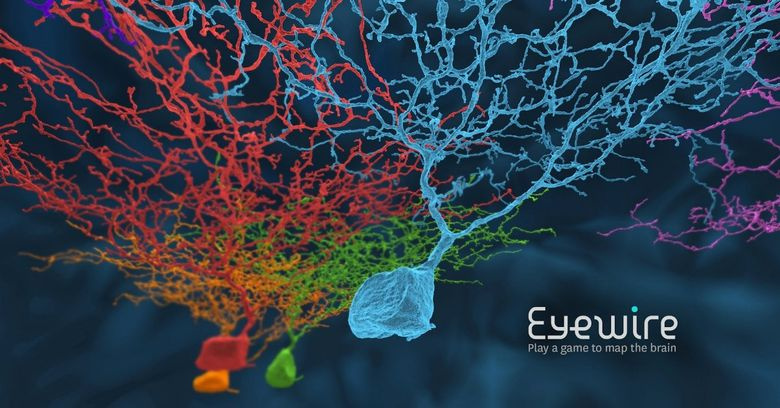
There is still no complete map of the human brain. There are several approaches to solving this problem. One way is to decipher the way in which electrical signals travel between neurons when the brain performs certain functions. The problem is that each slice with a thickness of fifty billionths of a meter has to be carefully photographed using an electron microscope, and then programmatically trying to reestablish the connections between neurons individually.
The process takes a lot of time, but there are ways to speed it up. For example, you can use different colors to mark different neurons and connections with color so that they can be better seen. In the EyeWire project, any user in the game format is offered to color the neural connections in the picture with real neurons of the retina, taken with an electron microscope. This is how science makes progress through gamification.
Canvas and paint neural connections
A graduate of the Faculty of Neuroscience at the University of Pennsylvania, Greg Dunn removed a scientific search from the equation and concentrated on the visual component. He began to draw neurons in the style of Japanese watercolor painting Sumi-e (this is a type of monochrome painting, in which only two colors are traditionally present).
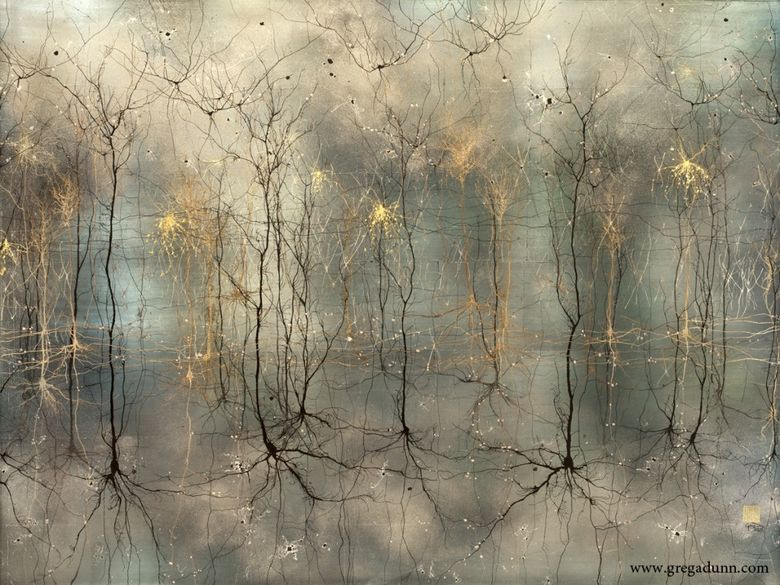
The columnar structure of the cerebral cortex. Gold, ink, developer, mica on the aluminum panel
Dunn first studies the real image of the neurons, then transfers the main outlines to paper and begins to create the picture. To more accurately convey the features of the structures of neural connections, the artist uses the deposition of ink on non-absorbing paper. At the same time, he improvises more, and does not copy the real image - to achieve the same ornate structure is extremely difficult if you just copy the original image.
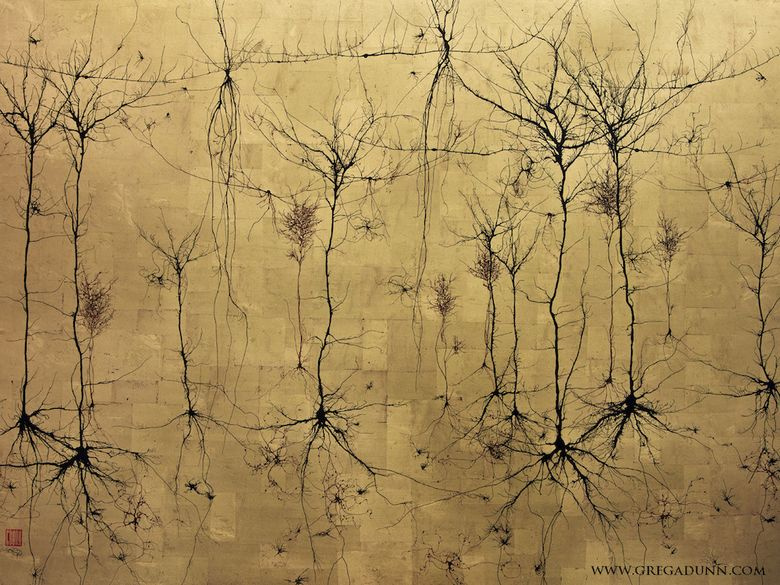
Basket-like and pyramidal neurons (which have a large apical dendrite leading up, there is one downward axon and many basal dendrites) in the motor cortex. 22k gold ink
If you blow on a drop of ink, the patterns of its spreading over the surface will be random, depending on the air turbulence, the shape of the paper, microscopic obstacles - the branching in the figures is the same as the real branching of nerve cells.
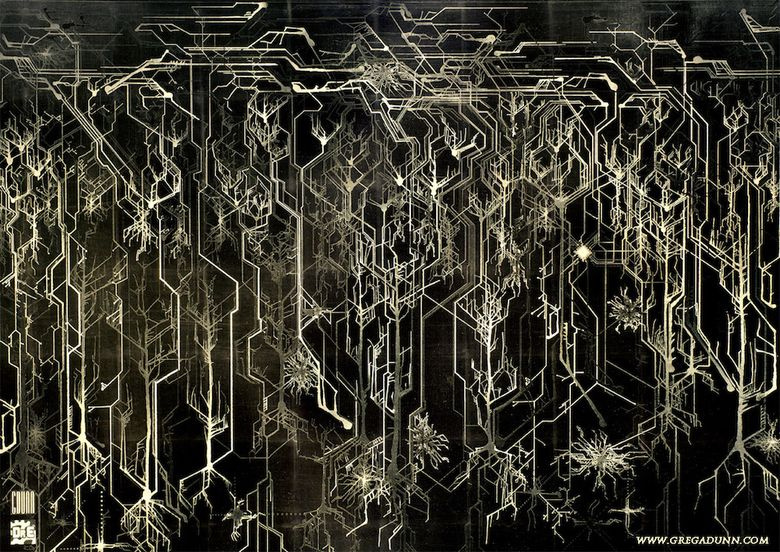
Scheme of the cerebral cortex. Gold engraving on steel
In this work, Dunn transferred the image to the metal using the photolithography method. The engraving was covered with gold leaf. The technique allows etching copies of cellular microstructures in the thinnest gold plates, each of which reflects light at a certain angle.
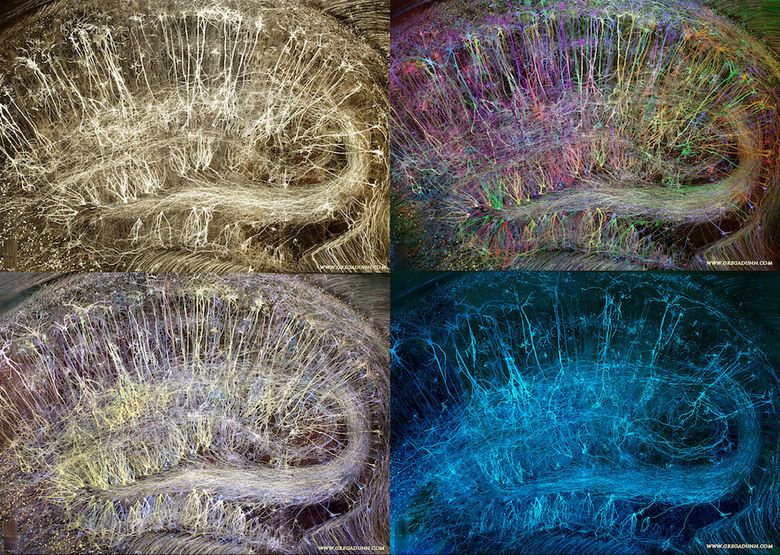
The basis of these works is the brain neuroimaging technique (brain - brain, rainbow - rainbow), which uses fluorescent proteins for staining neurons connected to each other. The figures show the variation of the hippocampal brainbow (the key structure of adult neurogenesis) in four colors.
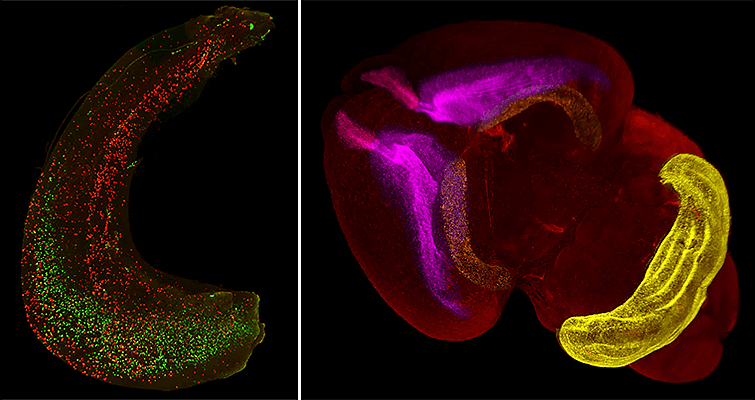
If you look at the hippocampus in various scientific papers , you can compare the levels of visualization of objects. Here is the hippocampus (left) and the whole mouse brain (right), painted entirely. In the image of the hippocampus, dividing cells are marked in red. Pink is the olfactory bulb, purple is the subventricular zone and the rostral migration route, orange is the hippocampus, yellow is the surface of the cerebellum.
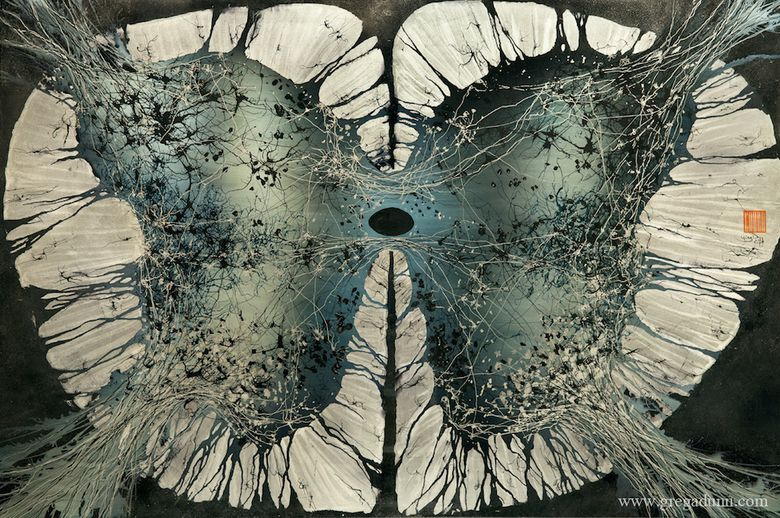
Most of Dunn's work is about neurons, but he pays attention to other cells as well. In the picture above, you see an image of a spinal cord.

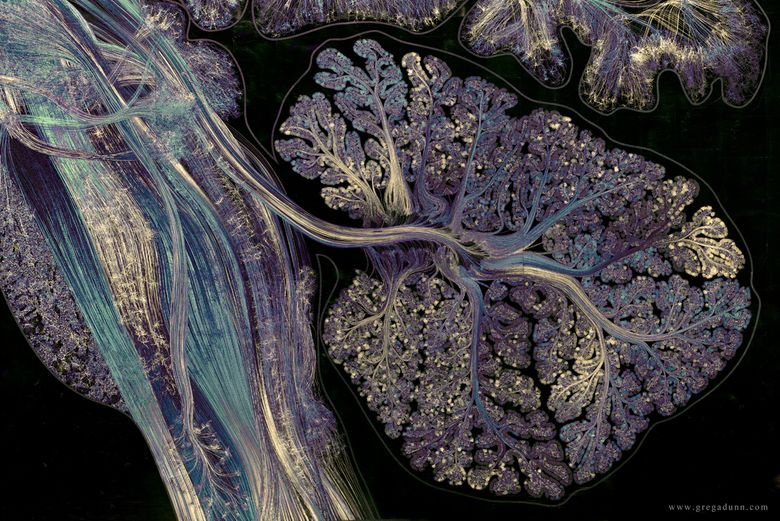
Cerebellum. Gold, paint, enamel on the aluminized panel
The paintings use not only gold, but also transparent paints, varnishes, sealants, special foaming agents, metal powders, chemically active ingredients.
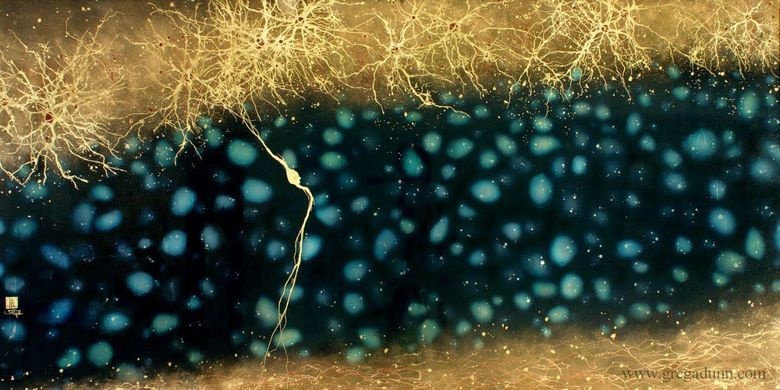
This picture shows the growing human cerebral cortex (at the 15th week of pregnancy).
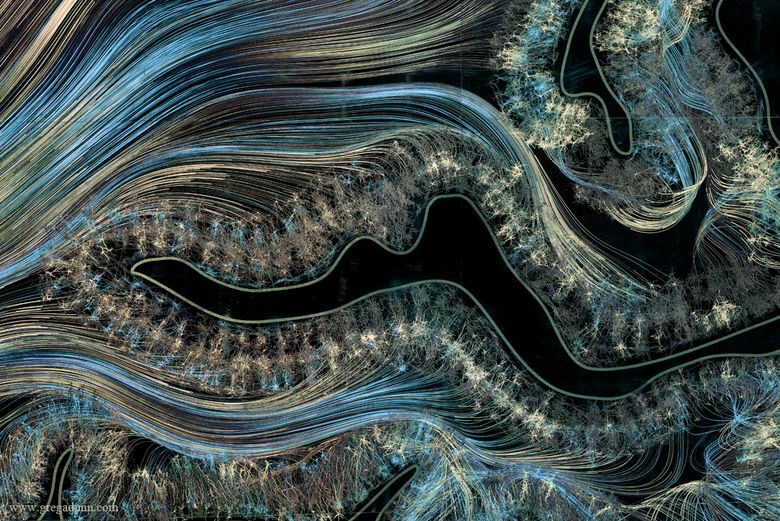
This drawing shows the visual cortex. This is only part of a grand artist's picture, which depicts 750,000 neurons and the connections between them.
As you can see, science and art can intersect in ways of transmitting information. And if the dry language of academic articles does not attract people much, then in order to popularize scientific ideas one can use the experience of artistic culture.
Greg Dunn’s paintings are exhibited at the Franklin Institute in Philadelphia, and on the project’s website you can watch videos that show how the elements look under different highlights.
All Articles