Bluff-キャンバス描画ライブラリ

最近、友人がキャンバスにさまざまなグラフを描くための非常に優れたjavascriptライブラリへのリンクを提供しました。 それはブラフと呼ばれます。 以下は彼女について少しです。


使い方


すべてのグラフには、ほぼ同じ初期化方法があります。

// , id

var g = new Bluff.Line('example', 400);


//

g.theme_keynote();

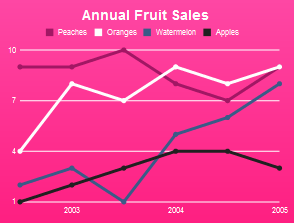
g.title = 'My Graph';


//

g.data('Apples', [1, 2, 3, 4, 4, 3]);

g.data('Oranges', [4, 8, 7, 9, 8, 9]);

g.data('Watermelon', [2, 3, 1, 5, 6, 8]);

g.data('Peaches', [9, 9, 10, 8, 7, 9]);

g.labels = {0: '2003', 2: '2004', 4: '2005'};


//

g.draw();


デフォルトでは、アスペクト比は4です。3。 ただし、高さは手動で設定することもできます。


var g = new Bluff.Line('example', '800x300');


ライブラリの現在のバージョンは、次のタイプのグラフをサポートしています。


HTMLデータ


配列を介してデータを転送する方法については上記で説明しましたが、BluffではHTMLテーブルからデータを埋め込むこともできます。 主なことは、タグが . ,


Annual Fruit Sales Apples Oranges Watermelon Peaches 1 4 2 9 2003 2 8 3 9 3 7 1 10 2004 4 9 5 8 4 8 6 7 2005 3 9 8 9

画像

< table id ="data" >

< caption > Annual Fruit Sales </ caption >

< thead >

< tr >

< th scope ="col" ></ th >

< th scope ="col" > Apples </ th >

< th scope ="col" > Oranges </ th >

< th scope ="col" > Watermelon </ th >

< th scope ="col" > Peaches </ th >

</ tr >

</ thead >

< tbody >

< tr >

< th scope ="row" ></ th >

< td > 1 </ td > < td > 4 </ td > < td > 2 </ td > < td > 9 </ td >

</ tr >

< tr >

< th scope ="row" > 2003 </ th >

< td > 2 </ td > < td > 8 </ td > < td > 3 </ td > < td > 9 </ td >

</ tr >

< tr >

< th scope ="row" ></ th >

< td > 3 </ td > < td > 7 </ td > < td > 1 </ td > < td > 10 </ td >

</ tr >

< tr >

< th scope ="row" > 2004 </ th >

< td > 4 </ td > < td > 9 </ td > < td > 5 </ td > < td > 8 </ td >

</ tr >

< tr >

< th scope ="row" ></ th >

< td > 4 </ td > < td > 8 </ td > < td > 6 </ td > < td > 7 </ td >

</ tr >

< tr >

< th scope ="row" > 2005 </ th >

< td > 3 </ td > < td > 9 </ td > < td > 8 </ td > < td > 9 </ td >

</ tr >

</ tbody >

</ table >

< canvas id ="graph" width ="300" height ="225" ></ canvas >

< script type ="text/javascript" >

var g = new Bluff.Line( 'graph' , '300x225' );

g.theme_odeo();

g.data_from_table( 'data' );

g.draw();

</ script >


* This source code was highlighted with Source Code Highlighter .


. . , . , colors, marker_color, font_color morebackground_colors:


g.set_theme({

colors: ['#202020', 'white', '#a21764', '#8ab438',

'#999999', '#3a5b87', 'black'],

marker_color: '#aea9a9',

font_color: 'black',

background_colors: ['#ff47a4', '#ff1f81']

});


:

g.theme_keynote();

g.theme_37signals();

g.theme_rails_keynote();

g.theme_odeo();

g.theme_pastel();

g.theme_greyscale();


. css, :

< div class ="bluff-tooltip" >

< span class ="label" >

< span style ="color: #abcdef;" > </ span >

Data series name

</ span >

< span class ="data" >

42

</ span >

</ div >


* This source code was highlighted with Source Code Highlighter .


g.tooltips = true , . :

Bluff.AccumulatorBar Bluff.Bar Bluff.Line Bluff.Mini.Bar Bluff.Mini.SideBar Bluff.SideBar Bluff.SideStackedBar Bluff.StackedBar

.


. ,


Annual Fruit Sales Apples Oranges Watermelon Peaches 1 4 2 9 2003 2 8 3 9 3 7 1 10 2004 4 9 5 8 4 8 6 7 2005 3 9 8 9

画像

< table id ="data" >

< caption > Annual Fruit Sales </ caption >

< thead >

< tr >

< th scope ="col" ></ th >

< th scope ="col" > Apples </ th >

< th scope ="col" > Oranges </ th >

< th scope ="col" > Watermelon </ th >

< th scope ="col" > Peaches </ th >

</ tr >

</ thead >

< tbody >

< tr >

< th scope ="row" ></ th >

< td > 1 </ td > < td > 4 </ td > < td > 2 </ td > < td > 9 </ td >

</ tr >

< tr >

< th scope ="row" > 2003 </ th >

< td > 2 </ td > < td > 8 </ td > < td > 3 </ td > < td > 9 </ td >

</ tr >

< tr >

< th scope ="row" ></ th >

< td > 3 </ td > < td > 7 </ td > < td > 1 </ td > < td > 10 </ td >

</ tr >

< tr >

< th scope ="row" > 2004 </ th >

< td > 4 </ td > < td > 9 </ td > < td > 5 </ td > < td > 8 </ td >

</ tr >

< tr >

< th scope ="row" ></ th >

< td > 4 </ td > < td > 8 </ td > < td > 6 </ td > < td > 7 </ td >

</ tr >

< tr >

< th scope ="row" > 2005 </ th >

< td > 3 </ td > < td > 9 </ td > < td > 8 </ td > < td > 9 </ td >

</ tr >

</ tbody >

</ table >

< canvas id ="graph" width ="300" height ="225" ></ canvas >

< script type ="text/javascript" >

var g = new Bluff.Line( 'graph' , '300x225' );

g.theme_odeo();

g.data_from_table( 'data' );

g.draw();

</ script >


* This source code was highlighted with Source Code Highlighter .


. . , . , colors, marker_color, font_color morebackground_colors:


g.set_theme({

colors: ['#202020', 'white', '#a21764', '#8ab438',

'#999999', '#3a5b87', 'black'],

marker_color: '#aea9a9',

font_color: 'black',

background_colors: ['#ff47a4', '#ff1f81']

});


:

g.theme_keynote();

g.theme_37signals();

g.theme_rails_keynote();

g.theme_odeo();

g.theme_pastel();

g.theme_greyscale();


. css, :

< div class ="bluff-tooltip" >

< span class ="label" >

< span style ="color: #abcdef;" > </ span >

Data series name

</ span >

< span class ="data" >

42

</ span >

</ div >


* This source code was highlighted with Source Code Highlighter .


g.tooltips = true , . :

Bluff.AccumulatorBar Bluff.Bar Bluff.Line Bluff.Mini.Bar Bluff.Mini.SideBar Bluff.SideBar Bluff.SideStackedBar Bluff.StackedBar

.


All Articles