物理学は何と言っていますか? 一枚の紙に書いて、数式の断片といくつかのベクトルを見せることは面白いですか? 安全かつ明確にしましょう。
通常の数学的振り子から始めましょう:
ところで、サインを引数としてとったとしても、振り子の周期を測定する実験はgに良い結果を与えます。 しかし、大きな角度を賞賛するためには、特にscipyがそのような機会を提供する場合、方程式を正直に解く必要があります。
方程式を2つの最初の次数に分割し、標準形式で記述します
そして今、私たちはこれを大胆にヘビに与えます(元のscipy.integrate.odeintについての詳細 )。
t = linspace(0,15,100) G = 9.8 L = 1.0 def diffeq(state, t): th, w = state return [w, -G/L*sin(th)] dt = 0.05 t = np.arange(0.0, 20, dt) th1 = 179.0 w1 = 0.0 state = np.radians([th1, w1]) y = odeint(diffeq, state, t)
力学の研究室の最初の年には振り子があり、それらのそれぞれの可能性は仕事のタスクをほとんど使い果たしました。 しかし、 オベレベックの振り子を引き付ける
そして今、N年後、私は映画(次のカリブの海賊)で何が起こるかを見ました!
うーん、本当にそうですか? これを行うには、2つの方程式のみを書き留めておけば十分です。最初の方程式は、ポータブル加速度とコリオリ加速度を考慮して、ガイドブレードのレストシステムに書き込まれます。
ギロチンの塊はどこに行きましたか? 摩擦のないほとんどの問題のように、それは平等の左右にあり、何にも影響しません。
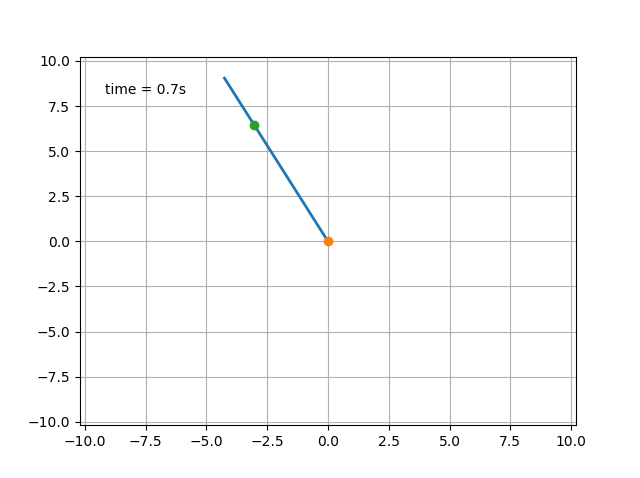
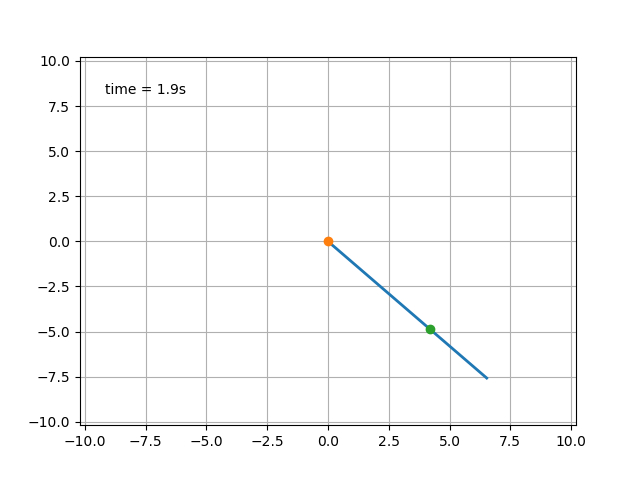
結果をお楽しみください:


初期速度が速い場合、この「アトラクション」は水平位置を通過した後に安全です。
import matplotlib.animation as animation from pylab import * from scipy.integrate import * import matplotlib.pyplot as plt t = linspace(0,15,100) G = 9.8 L = 10.0 def derivs(state, t): th, w, r, v = state if 0.<r<L or w**2*r>G*cos(th): return [w, -G/r*sin(th), -v, (-w**2*rG*cos(th)-G*sin(th)-2*w*v)] elif w**2*r<G*cos(th): return [w,-G/r*sin(th),-v, w**2*rG*cos(th)] return [w,-G/r*sin(th), 0,0] dt = 0.01 t = np.arange(0.0, 20, dt) th1 = 180.0 w1 = 50. r1 = L*0.9 v1 = 0.0 state = np.radians([th1, w1]) state = np.append(state, [r1, v1]) y = odeint(derivs, state, t) x1 = L*sin(y[:, 0]) y1 = -L*cos(y[:, 0]) x2 = (y[:,2].clip(min = 0, max = L))*sin(y[:, 0]) y2 = -(y[:,2].clip(min = 0, max = L))*cos(y[:, 0]) fig = plt.figure() ax = fig.add_subplot(111, autoscale_on=False, xlim=(-L-0.2, L+0.2), ylim=(-L-0.2, L+0.2)) ax.grid() line, = ax.plot([], [], '-', lw=2) point, = ax.plot(0,0,'o', lw=2) extra, = ax.plot(x1/L*r1,y1/L*r1,'o', lw=2) time_template = 'time = %.1fs' time_text = ax.text(0.05, 0.9, '', transform=ax.transAxes) def init(): line.set_data([], []) point.set_data(0,0) time_text.set_text('') extra.set_data(x1/L*r1,y1/L*r1) return line, time_text, point, extra def animate(i): thisx = [0, x1[i]] thisy = [0, y1[i]] thisx2 = x2[i] thisy2 = y2[i] point.set_data(thisx[0],thisy[0]) line.set_data(thisx, thisy) time_text.set_text(time_template % (i*dt)) extra.set_data([thisx2,thisy2]) return line, time_text, point, extra ani = animation.FuncAnimation(fig, animate, np.arange(1, len(y)), interval=25, blit=True, init_func=init, repeat = False) show()
PS ここで私は掘り始めました。
初期パラメーター(垂直からの小さな角度の偏差または小さな初期角速度)で遊んでいるPSSは、ジャイロスコープの安定性を「フラット」に理解することができます。
そして、優しくして、ギロチンに陥らないようにした方が良いです!