Tools for analyzing and debugging .NET applications
You can look under the hood of the code or look at the internal CLR device using many tools. This post was born out of a tweet , and I have to thank everyone who helped make a list of suitable tools. If I missed any of them, write in the comments.
First, I have to mention that a good debugger is already present in Visual Studio and VSCode . There are also many good (commercial) .NET profilers and application monitoring tools worth looking at. For example, I recently tried working with Codetrack and was impressed with its capabilities.
However, the remaining post is devoted to tools for performing individual tasks , which will help to better understand what is happening. All tools are open source .

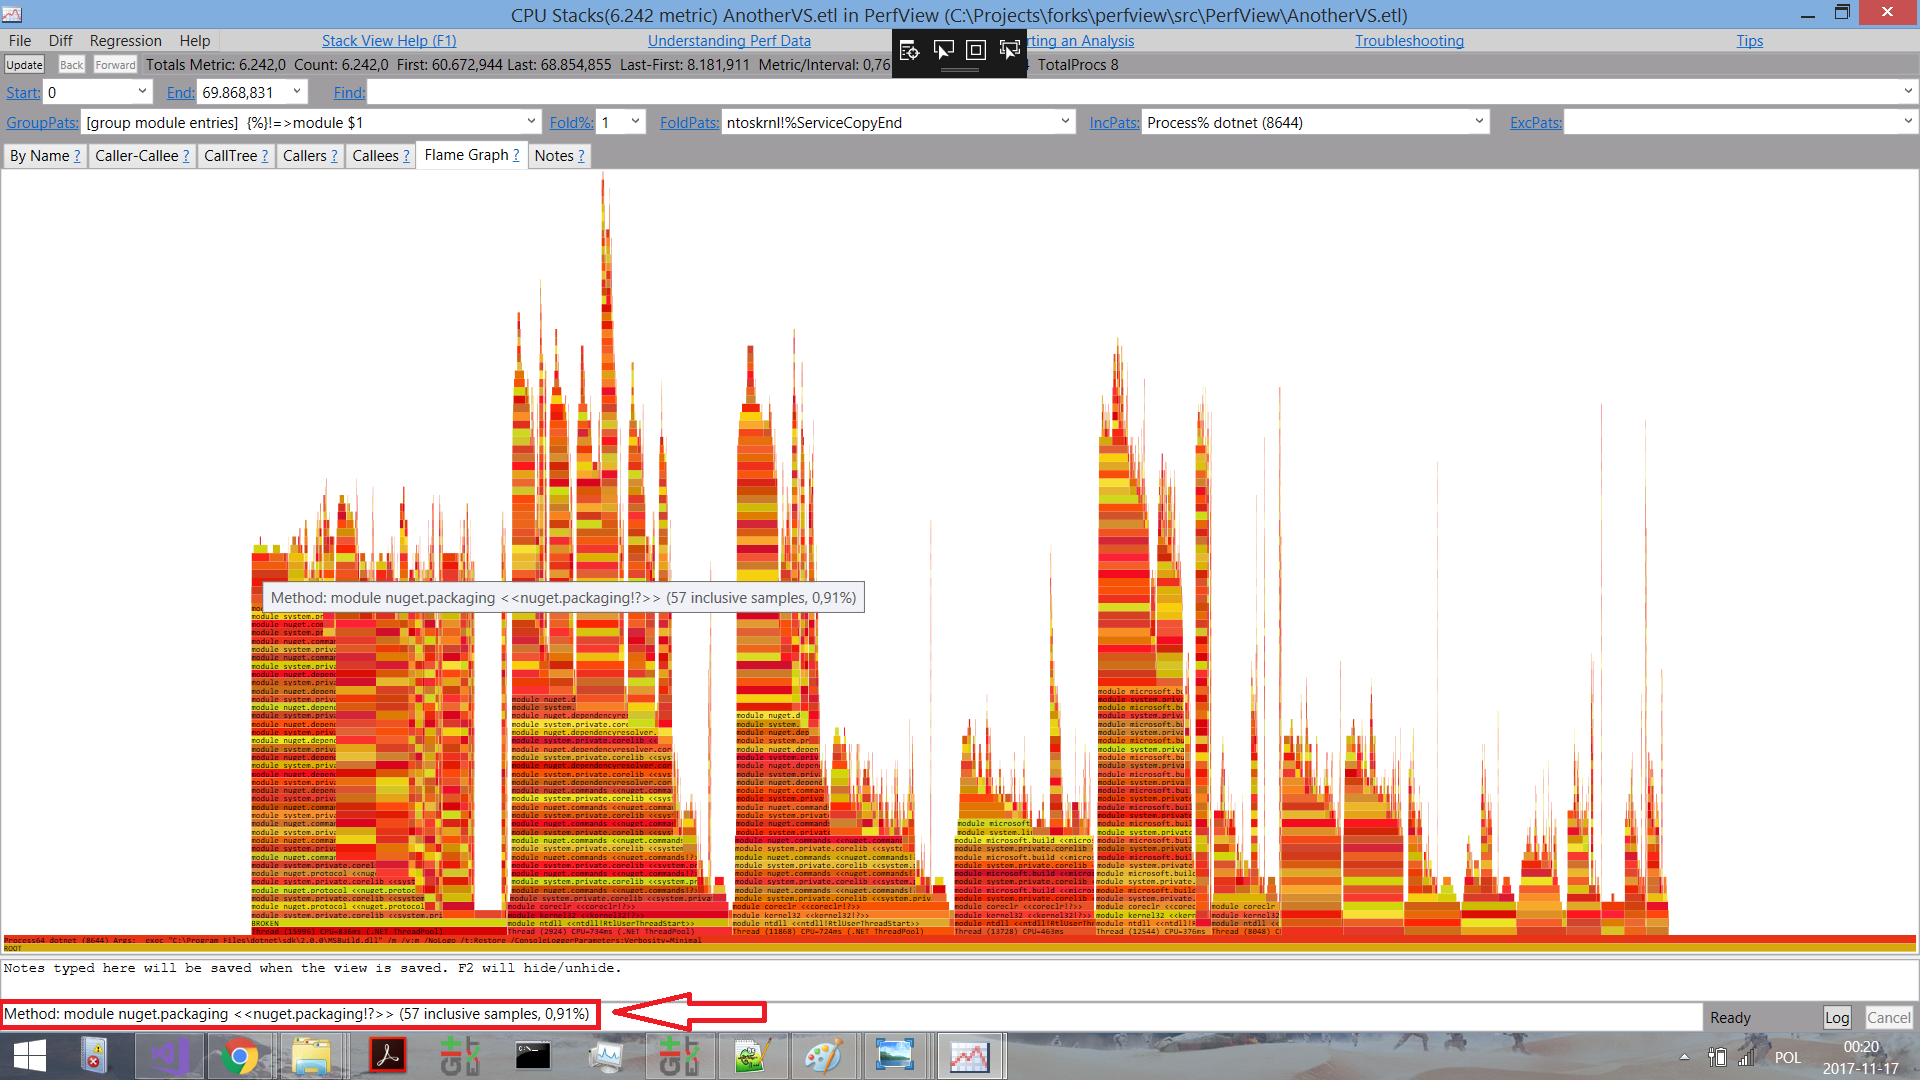
PerfView by Vance Morrison
PerfView is a great tool that I have been using for several years. It works on the basis of Windows Event Tracing (ETW) and allows you to better understand what is happening inside the CLR, and also gives the opportunity to get a profile of memory and CPU utilization. To master the tool, you will have to absorb a lot of information, for example with the help of training videos , but it is worth the time and effort.
The tool is so useful that Microsoft engineers themselves use it, and many of the recent performance improvements in MSBuild appeared after analyzing bottlenecks using PerfView.
The tool is based on the Microsoft.Diagnostics.Tracing.TraceEvent library , which you can use to create your own tools. In addition, since the source code of the library is open, thanks to the community, many useful functions have appeared in it, for example, flame-graphs :
SharpLab by Andrey Shcheokin
SharpLab emerged as a tool for checking the IL code generated by the Roslyn compiler, and over time evolved into something more :
SharpLab is an interactive environment for running .NET code that displays intermediate steps and compilation results. Some functions of the language are just wrappers for others, for example using () becomes try / catch. With SharpLab, you will see the code as the compiler sees it and better understand the essence of .NET languages.
The tool supports C #, Visual Basic and F #, but the most interesting functions in it are Decompilation / Disassembly:
The decompilation / disassembly functions can be used to:
- C #
- Visual basic
- IL
- JIT Asm (native Asm Code)
You understood correctly: the tool outputs the assembler code that .NET JIT generates from your C # code:

Object Layout Inspector by Sergey Teplyakov
With this tool, you can analyze the structure of .NET objects in memory, i.e. how JITter arranged the fields belonging to your class or structure. This is useful when writing high-performance code. It’s also nice to have a tool that does the hard work for us.
There is no official documentation that describes the field structure, as CLR authors reserve the right to change it in the future. But knowledge of the structure can be useful if you are working on a high-speed application.
How can you study the structure? You can look at raw memory in Visual Studio or use the !dumpobj
in the SOS Debugging Extension . Both approaches require a lot of effort, so we will create a tool that will display the structure of the object at runtime.
According to the example in the GitHub repository, if you use TypeLayout.Print<NotAlignedStruct>()
with similar code:
public struct NotAlignedStruct { public byte m_byte1; public int m_int; public byte m_byte2; public short m_short; }
The following output will appear, which will show exactly how the CLR will arrange the struct in memory based on optimization and padding rules.
Size: 12. Paddings: 4 (%33 of empty space) |================================| | 0: Byte m_byte1 (1 byte) | |--------------------------------| | 1-3: padding (3 bytes) | |--------------------------------| | 4-7: Int32 m_int (4 bytes) | |--------------------------------| | 8: Byte m_byte2 (1 byte) | |--------------------------------| | 9: padding (1 byte) | |--------------------------------| | 10-11: Int16 m_short (2 bytes) | |================================|
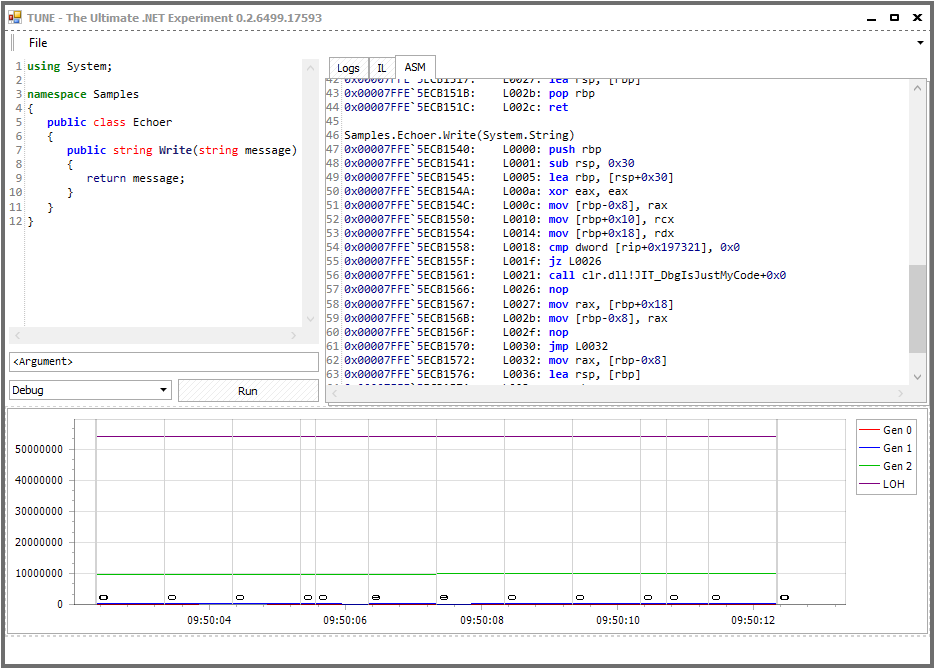
The Ultimate .NET Experiment (TUNE) by Conrad Coconuts
As stated on the GitHub page , TUNE is a promising tool. It will help you learn about the internal structure of .NET and how to improve performance by experimenting with C # code.
Detailed information about him can be found in this post , but at a high level it functions as follows :
- write a working C # code example that contains at least one class with a public method that takes one string parameter. The code is launched using the Run button. You can include any number of methods and classes. But remember that the first public method from the first public class will be executed using the first parameter from the input window under the code;
- click the Run button to compile and execute the code. In addition, it will be compiled into IL-code and assembler code in the corresponding tabs;
- while Tune is running (including at runtime), the tool builds a graph that displays garbage collector data. It contains information on generation sizes and garbage collection sessions (represented as vertical lines with a number below, which indicates in which generation garbage collection is performed).
It looks like this:
CLR Memory Diagnostics (ClrMD) Tools
Finally, let's take a look at a certain category of tools. Since the release of .NET, developers have always been able to use WinDBG and the SOS Debugging Extension to see what happens in the .NET runtime. However, these are not the easiest tools for a first acquaintance and, as stated in the next tweet, are not always the most productive:
Fortunately, Microsoft made available the ClrMD library (also known as Microsoft.Diagnostics.Runtime ), and now anyone can create a tool for analyzing memory dumps for .NET programs. Detailed information can be found in the official blog . I also recommend taking a look at ClrMD.Extensions , which “... provides integration with LINPad and makes using ClrMD even easier . ”
I wanted to put together a list of all existing tools and called on Twitter for help. Reminding yourself: be careful with tweets. The manager responsible for WinDBG may read them and be upset!
Most of these tools work on the basis of ClrMD, because this is easiest. But if desired, you can use COM interfaces directly . It should also be noted that any ClrMD-based tool is not cross-platform , since ClrMD itself is designed only for Windows. Cross-platform options can be found in Analyzing a .NET Core Core Dump on Linux .
Finally, in order to somehow maintain balance, an improved version of WinDBG recently appeared, which they immediately tried to add functionality:
- Extending the new WinDbg, Part 1 - Buttons and commands
- Extending the new WinDbg, Part 2 - Tool windows and command output
- Extending the new WinDbg, Part 3 - Embedding a C # interpreter
- WinDBG extension + UI tool extensions and more here
- NetExt is a WinDBG application that makes debugging easier in .NET compared to the current options: sos or psscor. Also see this InfoQ article .
After all these words, go to the list:
- SuperDump ( GitHub )
- Tool for automatic analysis of crash dump ( presentation )
- msos ( github )
- An environment with a command line interface such as WinDbg for executing SOS commands in the absence of SOS.
- MemoScope.Net ( GitHub )
- A tool for analyzing process memory in .NET. You can dump the application memory into a file and read it later.
- The file contains all data (objects) and information about threads (state, stack, call stack). MemoScope.Net will analyze the data and help you find memory leaks and deadlocks.
- dnSpy ( github )
- .NET assembly debugger and editor
- It can be used to edit and debug assemblies, even if you don't have source code.
- MemAnalyzer ( GitHub )
- A memory analysis tool for managed code. There is a command line interface.
- Like
!DumpHeap
in Windbg can determine which objects take up the most space on the heap without having to install a debugger.
- DumpMiner ( GitHub )
- ClrMD GUI tool. More features will appear in the future .
- Trace CLI ( GitHub )
- Tool for debugging and tracking during operation
- Shed ( GitHub )
- Shed is an application that analyzes the execution of a program in .NET. It can be used to analyze malware in order to obtain data about what information is stored when such software is launched. Shed can:
- Retrieve all objects stored in the managed heap
- output lines stored in memory;
- create a heap snapshot in JSON format for further processing;
- dump all modules loaded into memory.
You can find many other tools that use ClrMD . Making it available was a good idea from Microsoft.
Other tools
Other tools worth mentioning:
- Debugdiag
- The DebugDiag tool is designed to fix problems such as freezes, poor performance, memory leaks or fragmentation, as well as process failures in user mode (now with CLRMD integration).
- SOSEX (maybe no longer being developed)
- ... an extension for debugging managed code that reduces my dissatisfaction with SOS.
- VMMap from Sysinternals
- VMMap is a tool for analyzing virtual and physical memory of processes.
- I used it to analyze memory usage in the CLR
All Articles