Features of Google PageSpeed: improved site rating and search ranking
The material, the translation of which we publish today, is dedicated to the site speed rating, which can be calculated using Google PageSpeed Insights.
It's no secret that the speed of a site in our time has become one of its most important characteristics. The faster the site loads and gets ready for work, the higher may be the income that it brings to its owner. Speeding up a site means reducing the number of users who, having barely visited this site, leave it, tired of waiting for their materials to load. Of particular importance to site performance is the fact that now Google PageSpeed indicators are used as one of the factors ranking sites in search results. As a result, many organizations today pay close attention to the speed of their sites.

Last year, Google made two major changes to its search indexing and site ranking algorithms.
These facts allow us to draw the following conclusions:
Here's what Google says about it: “Faster sites not only enhance user experience; recent data show that increasing the speed of the site, in addition, leads to a decrease in the cost of its support. We really appreciate the speed. The same can be said about our users. That is why we decided that when calculating the search ranking indicators, we will also take into account the speed of the site. ”
In order to understand how these changes affect our projects in terms of optimizing their performance, we need to understand the technologies that underlie the assessment of site speed. PageSpeed 5.0 is a fully revised version of this system. Now it is based on Lighthouse and CrUX (Chrome User Experience Report).
This update, in addition, brought a new scoring algorithm, which greatly complicates the task of obtaining a high score in PageSpeed.
Prior to version 5.0, the PageSpeed tool checked the page, analyzing its compliance with a set of heuristic rules. If there were large uncompressed images on the page, PageSpeed could advise the web developer to compress these images. No Cache Headers? The system could advise them to add.
Recommendations were tied to these page checks. Following recommendations could lead to better page performance. But heuristic rules were rather superficial, they were not aimed at exploring what impressions a page's loading and rendering page would cause a real visitor to a site.
In PageSpeed 5.0, pages are loaded into a real Chrome browser, which is controlled by Lighthouse. Lighthouse records the metrics obtained from the browser, applies the score model to them, and displays an overall performance score. Recommendations for improving performance are based on the points scored by the studied page for individual indicators.
Lighthouse, like PageSpeed, has a site performance rating system. In PageSpeed 5.0, performance evaluation is taken directly from Lighthouse. The performance score output by PageSpeed is now the same score that Lighthouse produces.
PageSpeed's performance rating is based on the rating generated by Lighthouse
Now that we know where the PageSpeed score comes from, let's talk about how that score is calculated and what can be done to improve site speed.
Lighthouse is an open source project, which is handled by a special team, singled out from among the developers of Google Chrome. Over the past couple of years, Lighthouse has become the standard free tool for analyzing site performance.
Lighthouse uses Chrome Remote Debugging Protocol (Chrome Remote Debugging Protocol) to read information about network requests, to measure the performance of JavaScript code, to verify compliance with standards for accessibility of page content. This tool measures time indicators, oriented on the features of perception of the page by users. Among them, for example, First Contentful Paint , Time to Interactive, and Speed Index.
If you are interested in Lighthouse - take a look at this material from the official repository of the project, dedicated to the general description of its architecture.
As part of a page performance study, Lighthouse writes many metrics that focus on evaluating what the user sees and what the user experiences while working with the page. Here are six metrics used to derive an overall performance score:
Each of these indicators is evaluated on a scale of 0-100. The assessment is carried out by obtaining the 75th and 95th percentiles for mobile pages from the HTTP Archive and by using the
function.
Following this algorithm and considering the data used to calculate the TTI, you can see that if the page could become "interactive", suitable for user interaction, in 2.1 seconds, then the TTI will be equal to 92/100.

TTI
After each of the indicators is calculated, a certain weight is assigned to it, which is used as a modifier in calculating the total indicator. Here are the weights assigned to the various metrics.
Weights indicate how each of the indicators affects the mobile user's experience with the page.
In the future, this set may be expanded to include indicators taken from the Chrome User Experience Report dataset related to user experience.
You may be interested in learning how the use of weights affects the final performance rating. If so, take a look at this table created by the Lighthouse team. After analyzing it, you can better understand this process.
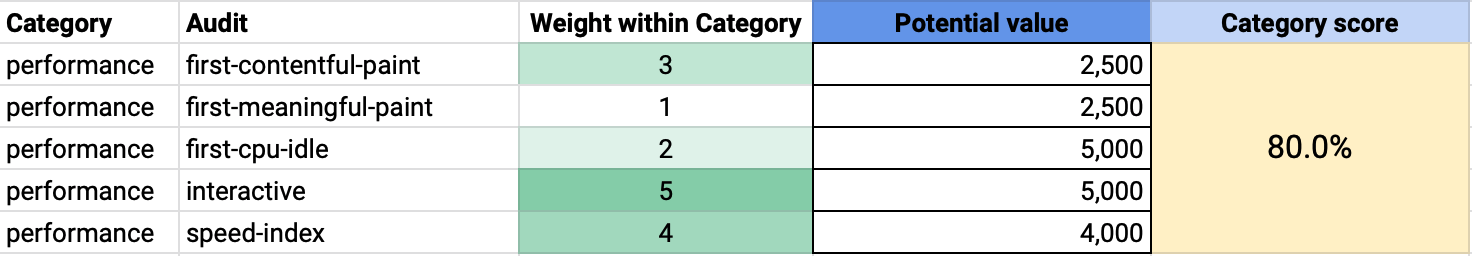
Fragment of a table demonstrating the calculation of page performance rating
If you change the
metric in the example above (this is what we call TTI here) from 5 seconds to 17 seconds (that is, to the level of the global average TTI for mobile pages), then the page rating will drop to 56% ( that is - she will get 56 points out of 100 possible).
If you set the
indicator to 17 seconds, the rating will drop to 62%.
As a result, we can conclude that the TTI metric has the greatest impact on the final site rating. It follows that in order to get a highly rated PageSpeed page, you need to demonstrate a decent TTI.
If we broadly consider the problem of improving TTI, then we can say that there are two factors that extremely strongly affect this indicator:
Here you can find details about TTI, but if you would like to quickly, without the need for additional research, improve the TTI of your site, we could recommend reducing the amount of JavaScript code.
Wherever possible, remove unused JavaScript code, or try to ensure that the page only loads the scripts that are used on this page. Fulfillment of this recommendation may mean getting rid of old polyfills or replacing third-party libraries with more compact and more modern alternatives.
It’s important to remember that what is called the “ JavaScript price ” is not only the time it takes to download the code. The browser needs to unzip, parse, compile and, ultimately, execute the loaded JavaScript code. All of these operations can take a considerable amount of time. Especially on mobile devices.
Among the effective measures to reduce the amount of JS-code used by the pages, the following can be noted:
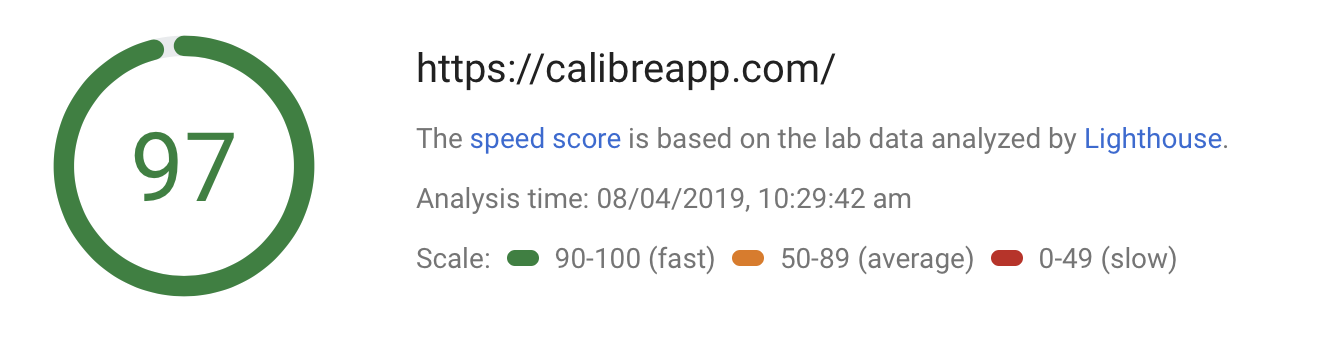
In order to successfully explore how your site is viewed by users viewing it, we recommend using site performance monitoring systems like Caliber . In particular, we are talking about the fact that sites are tested on at least two devices - on a fast desktop computer and on a mobile phone, whose performance is at the level of slow middle-class devices.
With this approach, you will have data for the best option for working with your site, and for the worst. At the same time, you will have to get used to the fact that visitors to your site do not use the same powerful devices that your team uses.
In order to get the most out of JS code performance profiling, test pages are tested on specially slowed down mobile devices. If you have an old telephone lying in your desk drawer, the realization of this idea can give it a wonderful second life.
A good substitute for real devices is the capabilities of the Chrome Developer Tools. Here is material on profiling React applications using these tools.
Metrics like Speed Index, First Contentful Paint, and First Meaningful Paint are based on how the browser renders the page. They are influenced by factors similar to those that we have already talked about. The impact on these factors often leads to an improvement in all of these indicators.
Objectively speaking, improving these metrics is easier than TTI. The fact is that the basis for their calculation is the speed of page rendering by the browser. These metrics can be improved by following exactly the guidelines given after page analysis with Lighthouse.
If you are not pre-loading the fonts or optimizing the page, taking into account the characteristics of critical queries, then you can very well start improving your site’s rendering performance from these two directions. In this article you can find detailed information about how the browser loads and displays the critical resources used in the formation of web pages.
The updated Google search console, Lighthouse and PageSpeed Insights are excellent tools that allow you to instantly evaluate the overall performance of the site. However, they are not well suited for teams that need to continuously monitor and improve the performance of their projects.
Continuous monitoring of performance is the most important part of the workflow, aimed at constantly maintaining site performance at a high level. With this approach, the project team instantly learns about performance issues. With manual performance testing, unexpected scatter of results is possible. As a result, without creating a specialized test environment, it is almost impossible to test site performance using different devices, or simulating other changing parameters of potential users' systems.
Page speed has become a critical factor in page SEO ranking. This statement is especially strong these days, when almost 50% of web traffic is generated by mobile devices.
In order for your site not to lose its position in search results, try to use modern versions of tools to analyze the performance of its most important pages and maintain its speed at a level that suits you.
Dear readers! Do you optimize your web projects taking into account the improvement of indicators influencing the grades of Google PageSpeed?

It's no secret that the speed of a site in our time has become one of its most important characteristics. The faster the site loads and gets ready for work, the higher may be the income that it brings to its owner. Speeding up a site means reducing the number of users who, having barely visited this site, leave it, tired of waiting for their materials to load. Of particular importance to site performance is the fact that now Google PageSpeed indicators are used as one of the factors ranking sites in search results. As a result, many organizations today pay close attention to the speed of their sites.
Changes in site ranking algorithms
Last year, Google made two major changes to its search indexing and site ranking algorithms.
- In March, indexing became based on the mobile version of the page rather than the desktop.
- In July, the SEO ranking algorithm was updated . When calculating it for mobile and advertising pages, they began to use the page speed rating.
These facts allow us to draw the following conclusions:
- The speed of the mobile version of the site will affect its overall SEO ranking.
- If the pages of the site load slowly, this will reduce the ad quality score and advertisements will cost more.
Here's what Google says about it: “Faster sites not only enhance user experience; recent data show that increasing the speed of the site, in addition, leads to a decrease in the cost of its support. We really appreciate the speed. The same can be said about our users. That is why we decided that when calculating the search ranking indicators, we will also take into account the speed of the site. ”
In order to understand how these changes affect our projects in terms of optimizing their performance, we need to understand the technologies that underlie the assessment of site speed. PageSpeed 5.0 is a fully revised version of this system. Now it is based on Lighthouse and CrUX (Chrome User Experience Report).
This update, in addition, brought a new scoring algorithm, which greatly complicates the task of obtaining a high score in PageSpeed.
What has changed in PageSpeed 5.0?
Prior to version 5.0, the PageSpeed tool checked the page, analyzing its compliance with a set of heuristic rules. If there were large uncompressed images on the page, PageSpeed could advise the web developer to compress these images. No Cache Headers? The system could advise them to add.
Recommendations were tied to these page checks. Following recommendations could lead to better page performance. But heuristic rules were rather superficial, they were not aimed at exploring what impressions a page's loading and rendering page would cause a real visitor to a site.
In PageSpeed 5.0, pages are loaded into a real Chrome browser, which is controlled by Lighthouse. Lighthouse records the metrics obtained from the browser, applies the score model to them, and displays an overall performance score. Recommendations for improving performance are based on the points scored by the studied page for individual indicators.
Lighthouse, like PageSpeed, has a site performance rating system. In PageSpeed 5.0, performance evaluation is taken directly from Lighthouse. The performance score output by PageSpeed is now the same score that Lighthouse produces.
PageSpeed's performance rating is based on the rating generated by Lighthouse
Now that we know where the PageSpeed score comes from, let's talk about how that score is calculated and what can be done to improve site speed.
What is Google Lighthouse?
Lighthouse is an open source project, which is handled by a special team, singled out from among the developers of Google Chrome. Over the past couple of years, Lighthouse has become the standard free tool for analyzing site performance.
Lighthouse uses Chrome Remote Debugging Protocol (Chrome Remote Debugging Protocol) to read information about network requests, to measure the performance of JavaScript code, to verify compliance with standards for accessibility of page content. This tool measures time indicators, oriented on the features of perception of the page by users. Among them, for example, First Contentful Paint , Time to Interactive, and Speed Index.
If you are interested in Lighthouse - take a look at this material from the official repository of the project, dedicated to the general description of its architecture.
Calculation of site performance rating in Lighthouse
As part of a page performance study, Lighthouse writes many metrics that focus on evaluating what the user sees and what the user experiences while working with the page. Here are six metrics used to derive an overall performance score:
- Time to Interactive (TTI, Download time for interaction).
- Speed Index.
- First Contentful Paint (FCP, First Content Download Time).
- First CPU Idle.
- First Meaningful Paint (FMP, Download Time for Enough Content).
- Estimated Input Latency.
Each of these indicators is evaluated on a scale of 0-100. The assessment is carried out by obtaining the 75th and 95th percentiles for mobile pages from the HTTP Archive and by using the
log normal
function.
Following this algorithm and considering the data used to calculate the TTI, you can see that if the page could become "interactive", suitable for user interaction, in 2.1 seconds, then the TTI will be equal to 92/100.
TTI
After each of the indicators is calculated, a certain weight is assigned to it, which is used as a modifier in calculating the total indicator. Here are the weights assigned to the various metrics.
| Metrics
| Weight
|
| Time to Interactive (TTI)
| five
|
| Speed index
| four
|
| First contentful paint
| 3
|
| First CPU Idle
| 2
|
| First meaningful paint
| one
|
| Estimated input latency
| 0
|
Weights indicate how each of the indicators affects the mobile user's experience with the page.
In the future, this set may be expanded to include indicators taken from the Chrome User Experience Report dataset related to user experience.
You may be interested in learning how the use of weights affects the final performance rating. If so, take a look at this table created by the Lighthouse team. After analyzing it, you can better understand this process.
Fragment of a table demonstrating the calculation of page performance rating
If you change the
interactive
metric in the example above (this is what we call TTI here) from 5 seconds to 17 seconds (that is, to the level of the global average TTI for mobile pages), then the page rating will drop to 56% ( that is - she will get 56 points out of 100 possible).
If you set the
first-contentful-paint
indicator to 17 seconds, the rating will drop to 62%.
As a result, we can conclude that the TTI metric has the greatest impact on the final site rating. It follows that in order to get a highly rated PageSpeed page, you need to demonstrate a decent TTI.
TTI Improvement
If we broadly consider the problem of improving TTI, then we can say that there are two factors that extremely strongly affect this indicator:
- The amount of JavaScript code loaded on the page.
- The time it takes to complete various JavaScript tasks in the main thread.
Here you can find details about TTI, but if you would like to quickly, without the need for additional research, improve the TTI of your site, we could recommend reducing the amount of JavaScript code.
Wherever possible, remove unused JavaScript code, or try to ensure that the page only loads the scripts that are used on this page. Fulfillment of this recommendation may mean getting rid of old polyfills or replacing third-party libraries with more compact and more modern alternatives.
It’s important to remember that what is called the “ JavaScript price ” is not only the time it takes to download the code. The browser needs to unzip, parse, compile and, ultimately, execute the loaded JavaScript code. All of these operations can take a considerable amount of time. Especially on mobile devices.
Among the effective measures to reduce the amount of JS-code used by the pages, the following can be noted:
- Analysis of the polyfills used and rejection of those that are no longer needed by your audience.
- Finding out the “cost” of each of the third-party libraries used. To learn about the sizes of libraries used in the project, you can use tools such as webpack-bundle-analyser and source-map-explorer .
- Modern JavaScript tools (like webpack) can break down large JS applications into sets of small bundles, which are automatically loaded as they become necessary. In particular, when a user goes from page to page of a site. This approach to optimizing site performance is known as code splitting . Its use has a very good effect on TTI.
- Use service workers who cache bytecode resulting from parsing and compiling scripts. If you can include such caching mechanisms in your project, then the system resources of site visitors will be spent on parsing and compiling the code only when you first go to the resource. On repeated visits to the site, the necessary materials will be taken from the cache.
TTI Monitoring
In order to successfully explore how your site is viewed by users viewing it, we recommend using site performance monitoring systems like Caliber . In particular, we are talking about the fact that sites are tested on at least two devices - on a fast desktop computer and on a mobile phone, whose performance is at the level of slow middle-class devices.
With this approach, you will have data for the best option for working with your site, and for the worst. At the same time, you will have to get used to the fact that visitors to your site do not use the same powerful devices that your team uses.
Careful manual profiling
In order to get the most out of JS code performance profiling, test pages are tested on specially slowed down mobile devices. If you have an old telephone lying in your desk drawer, the realization of this idea can give it a wonderful second life.
A good substitute for real devices is the capabilities of the Chrome Developer Tools. Here is material on profiling React applications using these tools.
Other metrics
Metrics like Speed Index, First Contentful Paint, and First Meaningful Paint are based on how the browser renders the page. They are influenced by factors similar to those that we have already talked about. The impact on these factors often leads to an improvement in all of these indicators.
Objectively speaking, improving these metrics is easier than TTI. The fact is that the basis for their calculation is the speed of page rendering by the browser. These metrics can be improved by following exactly the guidelines given after page analysis with Lighthouse.
If you are not pre-loading the fonts or optimizing the page, taking into account the characteristics of critical queries, then you can very well start improving your site’s rendering performance from these two directions. In this article you can find detailed information about how the browser loads and displays the critical resources used in the formation of web pages.
Results: on monitoring sites and on making tangible improvements to their work
The updated Google search console, Lighthouse and PageSpeed Insights are excellent tools that allow you to instantly evaluate the overall performance of the site. However, they are not well suited for teams that need to continuously monitor and improve the performance of their projects.
Continuous monitoring of performance is the most important part of the workflow, aimed at constantly maintaining site performance at a high level. With this approach, the project team instantly learns about performance issues. With manual performance testing, unexpected scatter of results is possible. As a result, without creating a specialized test environment, it is almost impossible to test site performance using different devices, or simulating other changing parameters of potential users' systems.
Page speed has become a critical factor in page SEO ranking. This statement is especially strong these days, when almost 50% of web traffic is generated by mobile devices.
In order for your site not to lose its position in search results, try to use modern versions of tools to analyze the performance of its most important pages and maintain its speed at a level that suits you.
Dear readers! Do you optimize your web projects taking into account the improvement of indicators influencing the grades of Google PageSpeed?
All Articles