A bit about Wi-Fi analyzers coverage on Android
It's no secret that Wi-Fi networks are rather exposed to interference, and walls and other objects can appear on the path of a wireless signal, and after the next such obstacle, an electromagnetic wave may simply not fulfill its purpose. In the digital age, you can visualize anything, and even the way Wi-Fi-band signals that are invisible to the human eye are spread.
When there is a tool that allows you to visually show the signal level immediately on a map of the area, this greatly facilitates the perception of the network picture as a whole. Such tools allow you to immediately download the building plan, and walking along it with the Wi-Fi receiver turned on, you can receive heat maps of radio coverage and many other useful data:
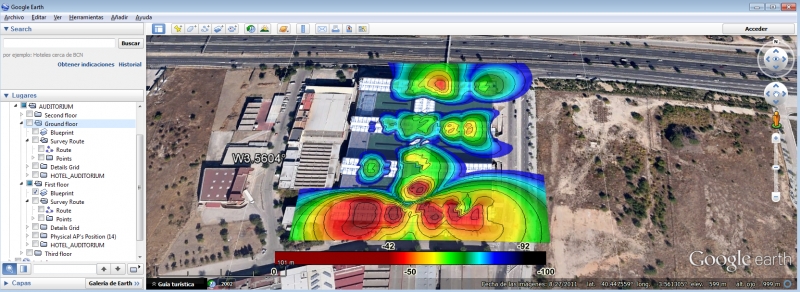
The screenshot above was made in the Acrylic Wi-Fi program (for Windows OS), which allows building heat maps using data from Google Map, but there are equally effective software products for mobile devices. Most of the tools for analyzing Wi-Fi coatings based on OS Windows offer a large amount of functionality. By the way, here we conducted a review of some of them, distributed free of charge, or conditionally free of charge (demo version and / or with reduced functionality). But if you do not need all the chips of advanced Windows-based applications with the definition of interference sources or better visualization, then Android-based software can help solve a number of important tasks.
Wi-Fi coverage analyzers on Google Play are not uncommon, there are quite a large number of them represented, but when choosing an application we were repelled by several factors: free distribution, the ability to build heat maps and the presence of unusual functionality (something more than just monitoring channels). As a result, the list of dozens of applications was reduced to 4. The review includes such programs as: Wi-Fi Analyzer and Surveyor, Wi-Fi Visualizer, iMapper Wi-Fi Pro, and WiTuners Mobile:
Wi-Fi Analyzer and Surveyor
Using this Wi-Fi analyzer as an example, we will consider the principle of operation in the application in more detail; for other software products, we will omit some step-by-step configuration items and proceed directly to the analysis of capabilities.
The ManageEngine Wi-Fi Analyzer and Surveyor application has very simple functions and is distributed completely free of charge. The program does not even have an extended paid version. The installer weighs about 6 MB. When you open the application, after its first setting, you can go to the Analyzer or Surveyor page. At the same time, the Analyzer mode monitors the Wi-Fi networks that your device sees, and in Surveyor you can add a floor plan from the memory of your device or cloud storage:

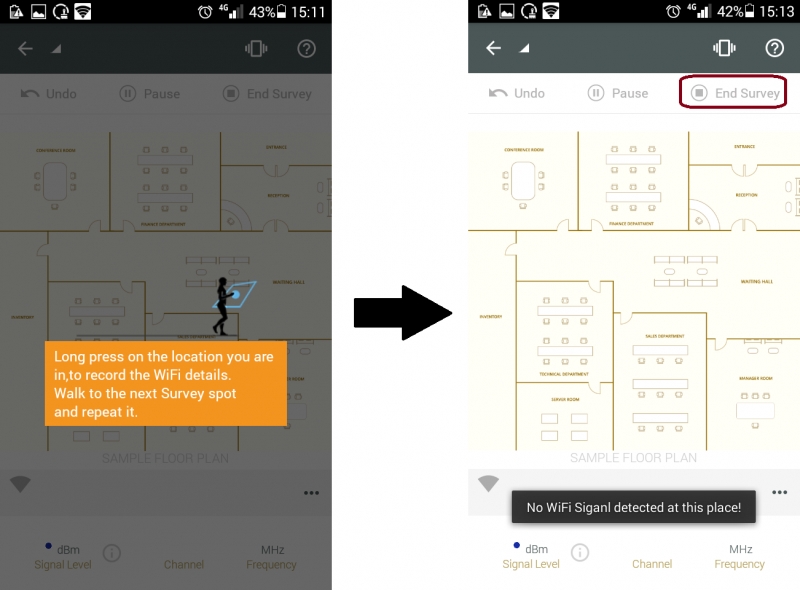
After the room map has been added, the application offers you to “walk” around the building and at those points where you are, to make measurements of radio coverage, this is done by long pressing on the monitor screen of your smartphone. After you have walked through all control points, you can complete the “survey” of the territory and display the report by clicking the “End Survey” button. Moreover, if you make measurements, and the Wi-Fi signal at a certain point is not detected, then you will receive a corresponding notification from the program:
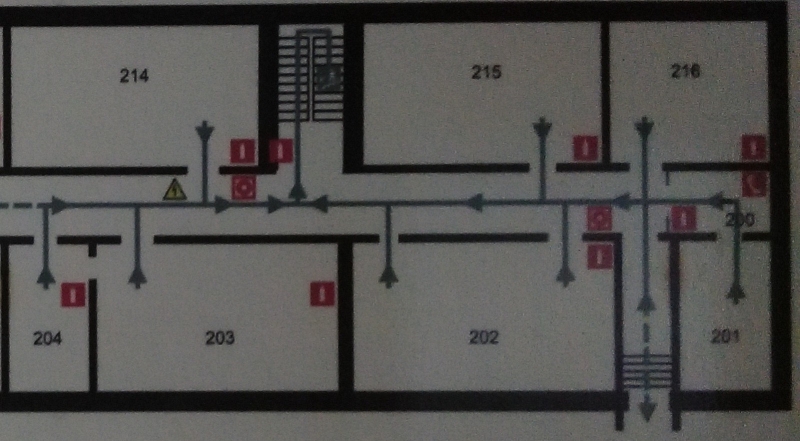
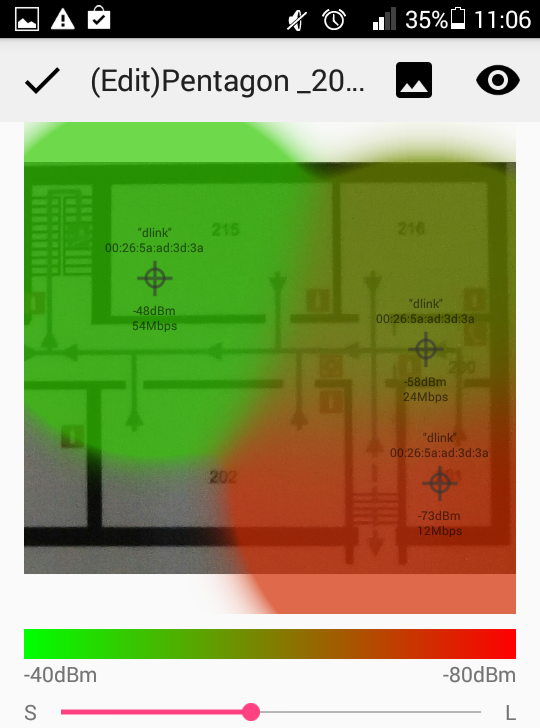
The description of the program indicates that you can take a picture of the floor plan and load it into the program for further work with it. Let's add a bit of entourage and see what happens. As an initial data, we will choose an evacuation plan from the building codenamed “Pentagon”, photographed, as indicated in the program description, on the same smartphone:
In the “Surveyor” tab, click “Add Plan” and upload the photo you made directly from the photo gallery. Next, move to the desired point on the map and click on the smartphone screen, immediately on the map information appears about the level of the recorded Wi-Fi signal. Certainly, it is good that the application remembers the signal level from all available APs in the measured points. The screenshots below show the signal levels at the measured points for three randomly selected networks:
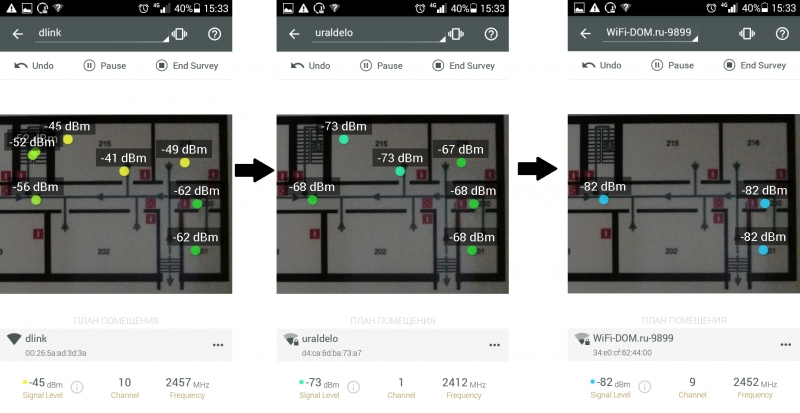
Please note that the same number of measurements was made on all three screenshots, but depending on which network you choose in the drop-down menu (in our example, this is the dlink, uraldelo, WiFi-DOM.ru networks), the signal levels of a specific network are displayed on the map . If the smartphone failed to detect one of these networks at the measuring points, then it, accordingly, will not be displayed on the map.
Unfortunately, it’s impossible to select a separate access point, in order to see its range, you can only select its SSID. The difference is that if multiple access points use the same SSID, then the application cannot determine if the different equipment creates such a coverage area, or one. The application also allows you to display data with the effect of the heat map, and not just to report on the signal level at the specified point:
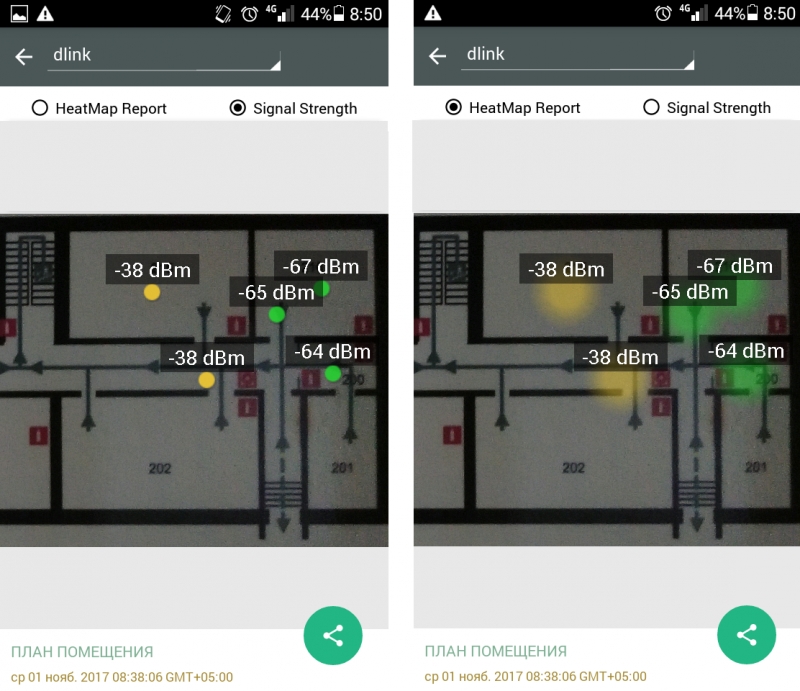
Let's face it, the effect is so-so ... It has been suggested that to create a full-fledged heat map, you need to make a sufficiently large number of measurements, but this idea was not crowned with success:
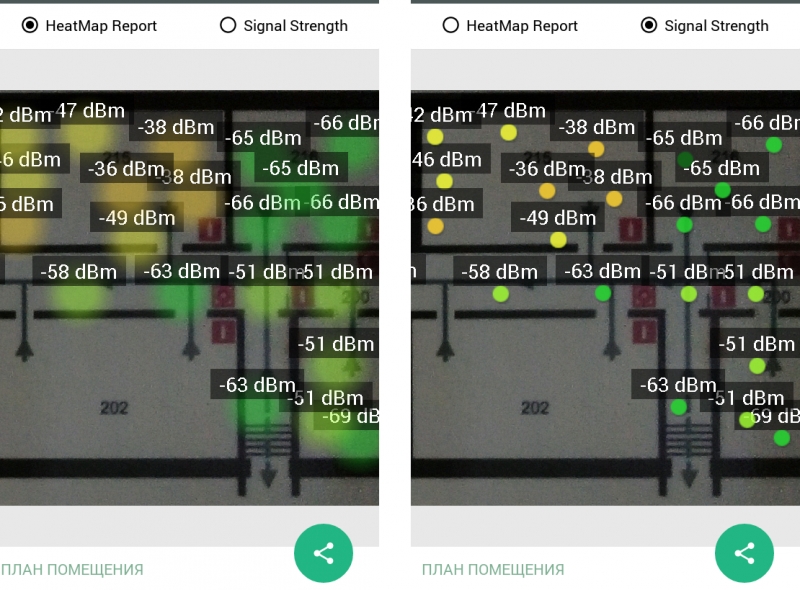
The heat map effect (HeatMap Report) only slightly radiates beyond the original size of the dots that you see in the signal strength report (Signal Strenght), so in fact you just see blurry dots. As we will see later, all other Wi-Fi coverage analysis software tools use certain prediction algorithms to fill these gaps and create a more complete heat map without having to bypass every square meter of building. Therefore, in terms of building heat maps, the Wi-Fi Analyzer and Surveyor program is not very convenient.
Let's stay a little longer on this program and say a few words about the Analyzer tool of the application in question. Here you can find 4 tabs at the bottom of the screen, each of which contains trivial data available in almost every such application:
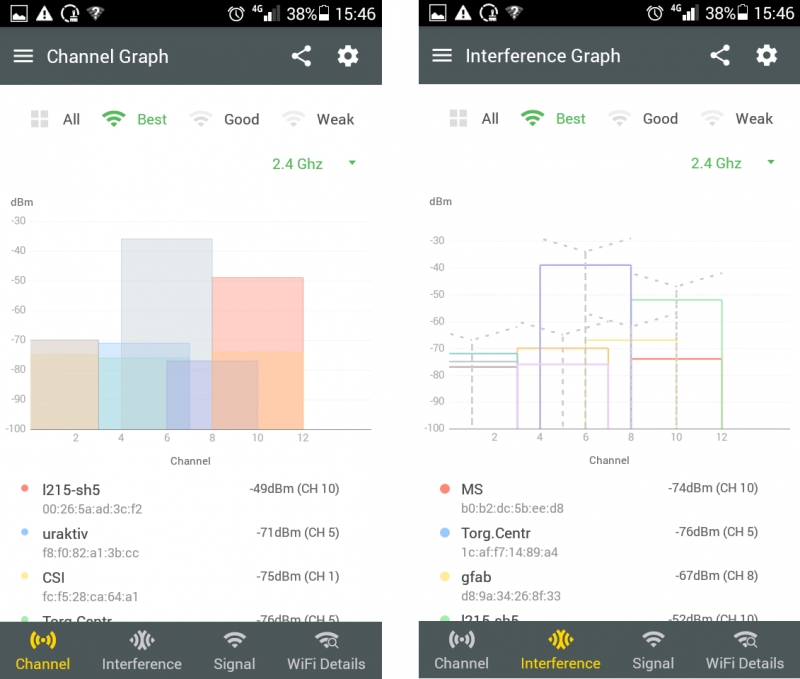
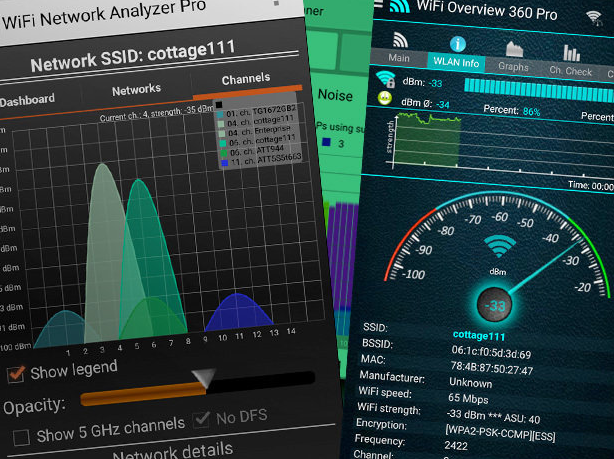
The Channel tab displays information about the available access points (APs) and the channels on which they operate in the form of column-diagrams. Further, the “Interference” and “Signal” tabs, which provide the same information as before (in the “Channel” tab), but directly on the subject of interference and signal level from each access point (for better readability, so to speak):

Here you can choose which access points to display based on information about the signal level (best (Best), good (Good), weak (Weak) or show all (All)). And the last tab - “Wi-Fi Details” (or information about Wi-Fi) shows a text list of available points and basic information about them: SSID, MAC-addresses, signal level, channel used for data transmission. Unfortunately, there is no information about the applied network encryption algorithm.
In the analyzer settings, you can set the scan interval or disable it in principle, which can be useful if you just need access to previously taken measurements. In addition, the program can give any network a name you have invented that will help you track these networks in the future. These simple settings can help you work continuously with specific networks.
Wi-Fi Visualizer
ITO Akihiro's Wi-Fi Visualizer application is also free and provides very simple functionality for building heat maps, as well as several other useful tools.
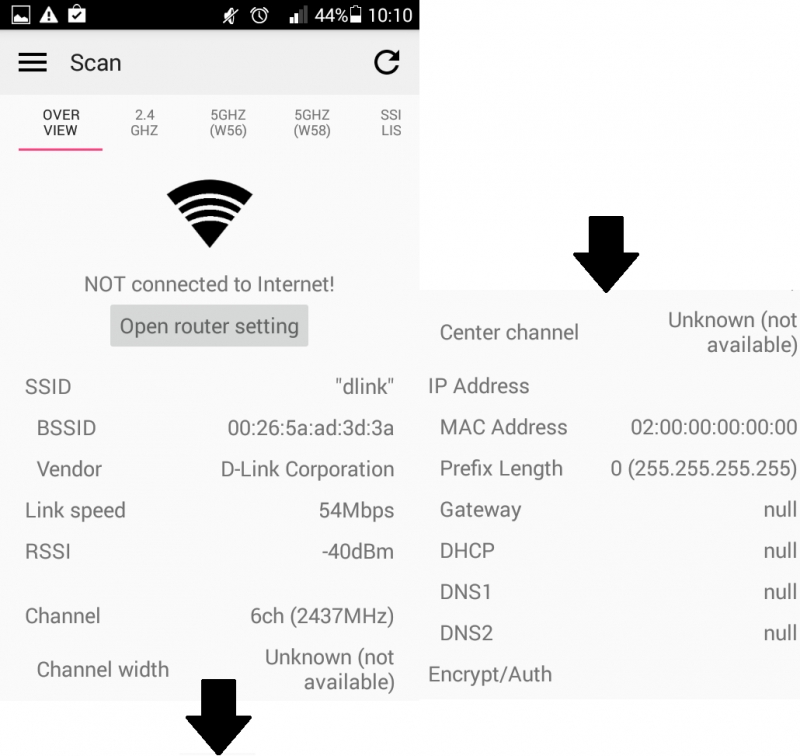
After opening the Wi-Fi Visualizer, you will see the Scan screen, which displays information about the current connection to the Wi-Fi access point. Along with the states of the wireless network, it also shows the channel width, the center channel and the maximum data transfer rate (although the program cannot always determine all these parameters):
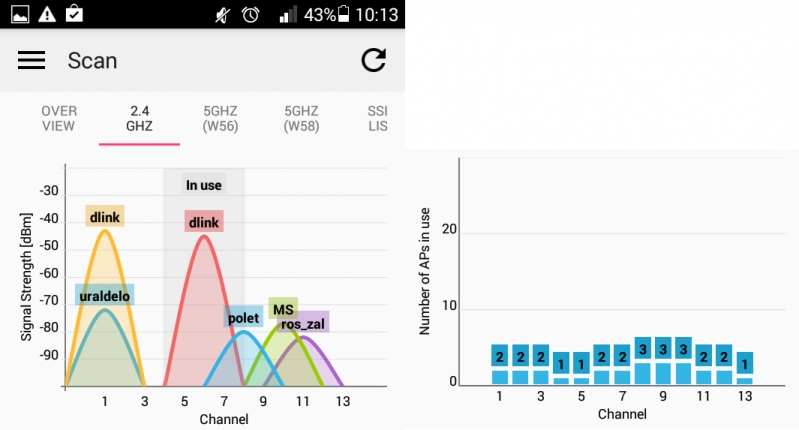
You can also view tabs on the same page, which allow you to see channel occupancy and their graphical representation in the 2.4 GHz bands and for each subset of the 5 GHz bands, but it would be more convenient to see all the 5 GHz bands on one page:
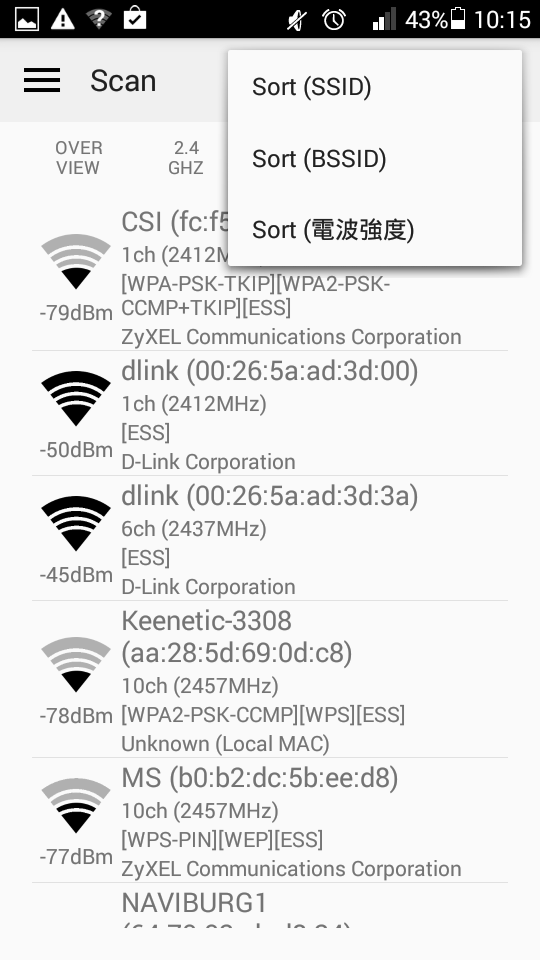
Also, on the scan page there is a tab with a list of available SSIDs. You cannot filter the list, but you can sort the devices by SSID and BSSID. On the same page “Scan” it is possible to save a list of devices and graphics with information and the status of the channel, to which you can go back and view them later. This is a rather handy feature that not all free applications offer:
This is where the scanning functions end, and we can proceed to the consideration of heatmaps, the corresponding “Heatmap” tab:
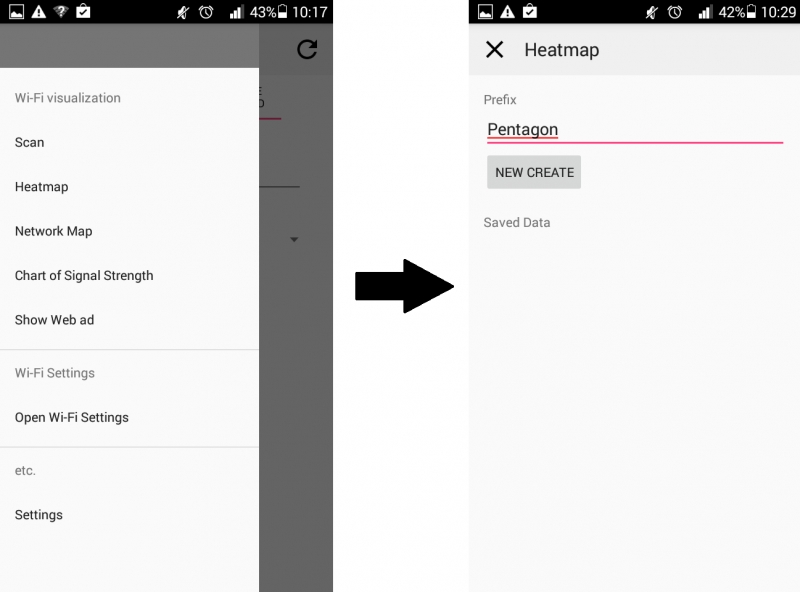
On the “Heatmap” page you can name and create a new project. When you add a floor plan (it can be a simple picture), you also indicate your location on the map, as well as in the previous program, the program registers the access point and saves its data transfer speed and power at the specified point. Unfortunately, in contrast to the application considered earlier, the program registers statistics only for the AP that you are currently connected to. This is not very convenient and can be a problem if you want to see whether the signals from one point affect another on the heat map. In this program, it is simply impossible to do this. But thanks to the adaptive signal level prediction algorithm, it is possible to build more uniform heatmaps:
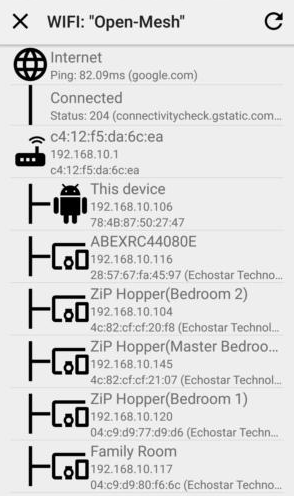
Let us turn to the not less interesting tab "Network Map" (below under "Heatmap"). Here on the screen you can view the tree of devices detected on the network. In fact, this is a simple IP scanner that shows the IP, MAC addresses and network names of devices on the network (such as routers / switches / wireless APs) in addition to client devices. This is a great bonus feature, which is not observed in most other applications for analyzing Wi-Fi networks:
On the “Chart of Signal Strenght” tab you can view a graph of the signal level vs. time variation (data is shown for the access point to which you are connected). Although this function is very simple, it is also very convenient. The graph shows a static line indicating a typical roaming boundary line of –80 dBm. You can, moving away from the access point, understand at what distance from it the indicated attenuation in -80 dBm will be observed and in the future take this into account when organizing a seamless radio coverage:
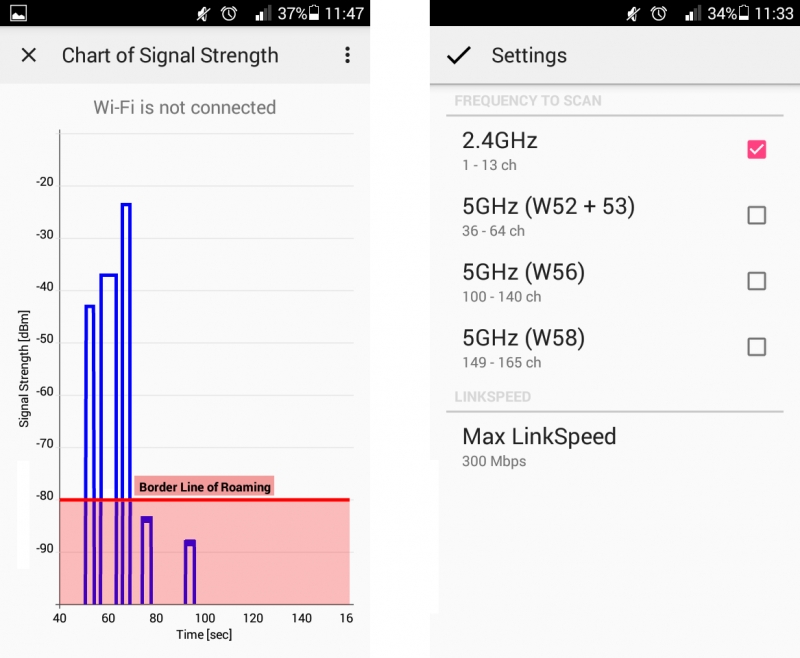
The "Setting" tab provides information about the characteristics of your device: supported frequencies and maximum data transfer rate.
Thus, if you need a good tool for analyzing radio coverage and Wi-Fi networks in general, this application is worth adding to your arsenal. Such solutions are well suited for analyzing small wireless networks, especially if you are the only system administrator in your company. With it, you can carry out express analysis when designing or expanding an existing Wi-Fi network.
In this part of the article we reviewed the work of two of the four promised applications. In the second part, we will look at the work of two more software solutions with equally interesting features that allow for the analysis of radio coverage - iMapper Wi-Fi Pro and WiTuners Mobile.
All Articles